Abstract
Analysis of food additives is highly significant in the food industry and directly related to human health. This investigation into the removal efficiency of sunset yellow as an azo dye in fruit juices using Chitosan-nickel ferrite nanoparticles (Cs@NiFe2O4 NPs). The nanoparticles were synthesized and characterized using various techniques. The effective parameters for removing sunset yellow were optimized using the response surface methodology (RSM) based on the central composite design (CCD). Under the optimum conditions, the highest removal efficiency (94.90%) was obtained for the initial dye concentration of 26.48 mg L−1 at a pH of 3.87, a reaction time of 67.62 min, and a nanoparticle dose of 0.038 g L−1. The pseudo-second-order kinetic model had a better fit for experimental data (R2 = 0.98) than the other kinetic models. The equilibrium adsorption process followed the Freundlich isotherm model with a maximum adsorption capacity of 212.766 mg g−1. The dye removal efficiency achieved for industrial and traditional fruit juice samples (91.75% and 93.24%), respectively, confirmed the method's performance, feasibility, and efficiency. The dye adsorption efficiency showed no significant decrease after five recycling, indicating that the sorbent has suitable stability in practical applications. variousThe synthesized nanoparticles can be suggested as an efficient sorbent to remove the sunset yellow dye from food products.
Subject terms: Environmental sciences, Chemistry
Introduction
Food additives critically impact food safety and quality1. In the food industry, both natural and synthetic colours are frequently utilized2. Natural dyes are usually unstable and readily destroyed during food processing. Therefore Synthetic dyes with chemical compounds similar to natural colorants are extensively utilized in food products3.
Azo dyes, the largest group of synthetic food colorants, constitute 70% of all organic dyes produced worldwide4. They are decomposed and converted into secondary amine metabolites called benzidine due to the activity of microorganisms and heat, which are often more stable and resistant to oxidizing agents, pH variations, heat, UV radiation, acids, and alkalis in terms of their complex chemical structure3,5,6. Toxicological studies indicated that azo dyes could cause mild to severe side effects, such as persistent headaches, hyperactivity in children, asthma, allergic reactions, urticarial, liver and kidney disorders, cancer, and interference with human serum albumin and hemoglobin7–10.
The list of permitted food colorants varies from country to country11–13. The permitted synthetic food dyes in Iran include sunset yellow (orange), quinoline yellow (yellow), brilliant blue (blue), indigotin or indigo carmine (blue), Allura red (red), ponceau (red), and carmoisine (red). However, they have been prohibited in some products, e.g., ice cream, drinks, fruit juice, desserts, and traditional products14.
Sunset Yellow, a famous synthetic food dye, is a hydroxyl mono-azo disulfone dye with conjugated aromatic rings and an azo functional group (N = N)13. The maximum daily intake of 4 mg per kilogram of body weight has been determined for this colorant by the World Health Organization (WHO) and the Food and Agriculture Organization (FAO)15,16. Its maximum allowed level in alcoholic and non-alcoholic beverages is 200 and 50 mg L−1, respectively16.
Two widely used methods for removing dyes as contaminants from food sources include the adsorption process in the presence of a sorbent and photodegradation in the presence of a photocatalyst17,18. The adsorption process involves binding contaminant molecules to a solid material, known as a sorbent, resulting in their removal from real samples19–22. This method can be tailored to target specific dye molecules, making it versatile and precise. It effectively removes a wide range of synthetic dyes commonly used in the food industry and is cost-effective and environmentally friendly23. The procedure can be customized to different food matrices and is easily applicable to various types of food products24. Additionally, the reusability of sorbents makes the process economically viable and reduces waste generation, highlighting its environmental sustainability.
Nanostructured materials such as multilayers, nanowires, nanoparticles, and nanocomposites have attracted vast attention due to their specific optical, electrical, chemical, and magnetic properties25–30. Simultaneous control of one or more parameters during food production or processing, transportability, and high speed and accuracy evaluation are among the characteristics of nanocomposites31. Spinel ferrites with excellent magnetic and electronic properties and reusability have been interesting magnetic oxide nanoparticles in the last decades32,33. Nickel ferrite, a soft semiconductor spinel ferrite, has high electrical resistance, and low magnetic saturation34,35. For biomedical applications, nanoparticles should be coated with biocompatible polymers like chitosan to ensure stability, biodegradability, and non-toxicity in the physiological environment36–38. Chitosan, a natural polymeric sorbent, has been reported to eliminate anionic dyes from solutions39.
The limitation of chitosan is its difficult separation from the final solution. The chitosan-magnetic nanoparticle composites can easily be separated from the solution via an external magnet40.
This research evaluated the adsorption rate of sunset yellow on chitosan-coated nanoparticles. A two-level CCD was utilized to optimize the parameters effective on sunset yellow removal, including sorbent amount, reaction time, dye concentration, and pH. The experimental design reduces the number of tests, costs, and time in the process of optimizing the useful components via the simultaneous examination of several parameters. The adsorption behaviour was examined using pseudo-first-order, pseudo-second-order, and intraparticle diffusion kinetic models, as well as Langmuir and Freundlich isotherms.
Materials and methods
Materials
Chitosan (Low Mw, 50,000–190,000 KDa), NaOH, NiCl2 .6H2O, FeCl3 .6H2O, oleic acid, acetic acid (˃ 98%), and sunset yellow (98%) were supplied by Merck Company (Darmstadt, Germany).
Synthesis of NiFe2O4 nanoparticles
Initially, a solution of NiCl2·6H2O (0.2 M, 20 mL) was combined with a solution of FeCl3.6H2O (0.4 M, 20.0 mL) under stirring at room temperature. The pH of the solution was adjusted to approximately 13 using an aqueous solution of NaOH (3.0 M). The mixture was stirred at 60 °C for 30 min, followed by the addition of 0.01 mL of oleic acid to the solution as a surfactant. The mixture was then heated at 80 °C for 40 min. The resulting brown precipitates (amorphous NiFe2O4 NPs) were separated using a magnet, subsequently rinsed with deionized water and ethanol several times, and finally dried at 80 °C for 2–3 h. The resulting amorphous NiFe2O4 nanoparticles were sealed in a stainless-steel autoclave with Teflon coating and kept at 600 °C for 6 h41–45.
Synthesis of Cs@NiFe2O4 NPs
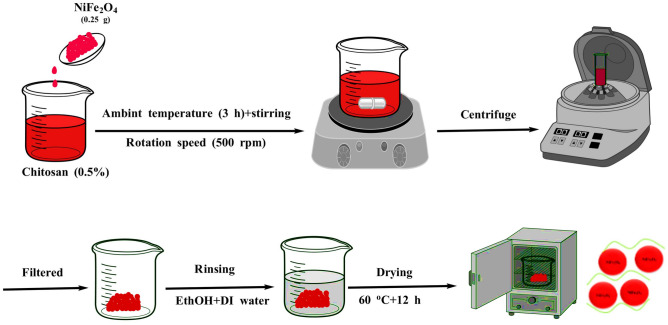
Chitosan solution was prepared by dissolving 1 g of chitosan with 50.0 mL of 1% acetic acid solution. Subsequently, 0.25 g of NiFe2O4 NPs were added to this solution. The suspension was stirred at ambient temperature for 3 h at 500 rpm. Following this, the mixture was centrifuged to separate the resulting brown precipitates (CS@NiFe2O4 NPs), and then rinsed with ethanol and distilled water before being dried at 60 °C for 12 h41,42. The schematic image of the adsorbent synthesis method is presented in Fig. 1.
Figure 1.
The schematic image of the adorbent synthesis procedure.
Characterization
Fourier transform infrared spectroscopy (FTIR) was achieved using Bruker Vertor-22 FTIR with a resolution of 4 cm−1 in the 500–4000 cm−1 range. At 25 °C, the X-Ray diffraction (XRD) pattern was captured at 2θ = 5–80° using a 0.04°/min scanning speed. A transmission electron microscope (TEM, EM Philips EM 208S) was employed to observe the particle size and dispersibility of the composite nanoparticles. Using scanning electron microscopy (SEM, MIRA3-LUM, Czech), the morphological properties were also studied, and the specific surface area was found by the Brunauer–Emmett–Teller (BET) Surface Area & Porosity Analyzer (II BELSORP mini, Japan). The mass loss of the materials was investigated with a thermogravimetric analyzer (TGA; TGA STA6000, PerkinElmer Corporation, USA) ranging from 20 to 850 °C at a heating rate of 10 °C/min using nitrogen as purge and protective gas.
Experiment design and optimization
The RSM method was used to design sorption experiments using Design Expert software. This model helps to describe the effect of the influencing factors and interrelationships with the least number of experiments considering optimal values for each factor. A total of 30 experiments were determined according to preliminary tests (Table 1). Data analysis for the desired response, the removal efficiency, was performed considering the confidence interval of 95%.
Table 1.
The principal factors, experiments, and responses obtained in the CCD for sunset yellow removal by Cs@NiFe2O4 NPs.
| Factor | Name | Unit | Minimum | Maximum | Mean ± SD |
|---|---|---|---|---|---|
| F1 | Dye concentration | mg L−1 | 10.00 | 50.00 | 30.00 ± 15.76 |
| F2 | Sorbent amount | g L−1 | 0.0200 | 0.0600 | 0.0400 ± 0.0158 |
| F3 | Contact time | min | 20.00 | 70.00 | 45.00 ± 19.70 |
| F4 | pH | 3.00 | 9.00 | 6.00 ± 2.36 |
| Run | F1 | F2 | F3 | F4 | Response |
|---|---|---|---|---|---|
| Dye concentration (mg L−1) | Sorbent amount (g L−1) | Contact time (min) | pH | Removal Efficiency (%) | |
| 1 | 10 | 0.02 | 20 | 3 | 79.48 |
| 2 | 10 | 0.04 | 45 | 6 | 74.08 |
| 3 | 50 | 0.02 | 70 | 9 | 50.46 |
| 4 | 30 | 0.06 | 45 | 6 | 80.58 |
| 5 | 50 | 0.06 | 20 | 3 | 74.32 |
| 6 | 50 | 0.02 | 20 | 9 | 51.08 |
| 7 | 30 | 0.04 | 45 | 9 | 64.64 |
| 8 | 50 | 0.02 | 20 | 3 | 77.65 |
| 9 | 30 | 0.04 | 45 | 6 | 88.63 |
| 10 | 30 | 0.04 | 20 | 6 | 76.11 |
| 11 | 30 | 0.04 | 45 | 6 | 91.59 |
| 12 | 10 | 0.06 | 70 | 9 | 72.54 |
| 13 | 30 | 0.04 | 45 | 6 | 94.61 |
| 14 | 10 | 0.02 | 70 | 3 | 78.46 |
| 15 | 10 | 0.06 | 20 | 3 | 58.18 |
| 16 | 50 | 0.06 | 70 | 3 | 88.93 |
| 17 | 30 | 0.02 | 45 | 6 | 76.62 |
| 18 | 30 | 0.04 | 45 | 6 | 90.96 |
| 19 | 30 | 0.04 | 45 | 6 | 93.28 |
| 20 | 10 | 0.02 | 70 | 9 | 53.24 |
| 21 | 10 | 0.06 | 70 | 3 | 87.76 |
| 22 | 30 | 0.04 | 70 | 6 | 92.09 |
| 23 | 50 | 0.02 | 70 | 3 | 70.68 |
| 24 | 30 | 0.04 | 45 | 3 | 87.56 |
| 25 | 10 | 0.02 | 20 | 9 | 46.86 |
| 26 | 30 | 0.04 | 45 | 6 | 87.64 |
| 27 | 50 | 0.04 | 45 | 6 | 80.19 |
| 28 | 50 | 0.06 | 20 | 9 | 48.72 |
| 29 | 50 | 0.06 | 70 | 9 | 86.68 |
| 30 | 10 | 0.06 | 20 | 9 | 39.56 |
To evaluate the sorption efficiency, the Cs@NiFe2O4 NPs were separated from the samples at the end of the process by centrifuging at 4000 rpm for 10 min. The sediments were removed using a magnet. The absorbance of the solution was calculated using a UV–visible spectrophotometer (Uviline 9400, Secomam) at a wavelength of 485 nm. The dye reduction percentage and the adsorption amount were calculated by Eqs. (1) and (2), respectively.
| 1 |
| 2 |
where R is the dye removal efficiency (%), C0 is the initial dye concentration (mg L−1), Ce is the equilibrium dye concentration (mg L−1), qe is the adsorption capacity (mg g−1), V is the sample volume (L), and M is the sorbent mass (g L−1 )46,47.
Adsorption isotherms
Adsorption isotherms, including Langmuir and Freundlich isotherms, were used to investigate the behavior of the synthesized sorbent and the interaction between the sorbent and the dye. Isotherm tests were performed at a pH of 3.84, an equilibrium time of 68 min, and various dye concentrations (10, 15, 20, 25, 30, 35, 40, 45, and 50 mg L−1)46.
Models of the kinetics of adsorption
Intraparticle diffusion, pseudo-first-order, and pseudo-second-order kinetic models were used to control, quantitatively analyze, and determine the mechanism of the adsorption process of sunset yellow dye by the synthesized Cs@NiFe2O4 NPs. The adsorption kinetic parameters were calculated by matching equations obtained from charts with adsorption kinetic equations. Kinetic experiments were performed under varying contact times (10, 20, 30, 40, 50, 60, 70, and 80 min) at an initial dye concentration of 26.48 mg L−1 using the optimized sorbent dose (0.038 g L−1) in the pH of 3.846.
Real sample study
The application of the nanocomposites to remove sunset yellow dye in the orange juices purchased from a local market (Tehran, Iran) and traditional orange juices spiked with 5 mg L−1 of sunset yellow dye was investigated to evaluate the impact of the matrix on dye removal. It has been confirmed that all methods, the experimental data collection, and the plant experiments complied with relevant with relevant institutional, national, and international guidelines and legislation. The samples were placed in an ultrasonic bath for 60 min and then diluted with deionized water. Afterward, the samples were filtered with 0.45 μm membranes. Nanoparticles were added to the sample solution (0.038 g L−1), and after 68 min at 20 °C, they were removed with a magnet from the solution. The absorbance of the samples was measured before adding nanoparticles to the sample solution and after separating the nanoparticles with a spectrophotometer at 485 nm. The removal efficiency was calculated as follows Eqs. (1).
Results and discussion
FTIR analysis
The FTIR spectra of Cs, NiFe2O4 NPs, and Cs@NiFe2O4 NPs are presented in Fig. 2. The FTIR spectrum of Cs indicates a broad band at 3600–3267 cm-1 attributed to O–H (hydroxyl group) and NH2 (amine group) starching vibrations48,49, sharp peaks owing to symmetric and asymmetric C–H stretching vibrations at 2901 cm−1 and 2806 cm−1, respectively, and peaks at 1638, 1423, and 1194 cm-1 due to N–H (amide I) bending, C–N carboxylic vibrations of the glycoside ring, C–O–C respectively50,51.
Figure 2.
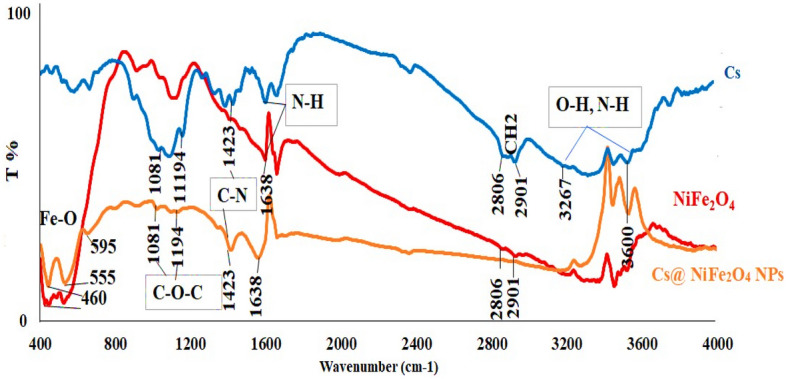
The FTIR spectra of Cs, NiFe2O4 NPs, Cs@NiFe2O4 NPs.
The FTIR pattern of NiFe2O4 NPs demonstrated a characteristic band in 460–595 cm−1 related to the Fe–O stretching vibration. The sharp band in 1764 cm−1 can be assigned to the vibrations of ions of sulfate adsorbed on the particle surface of NiFe2O449,52.
Similar peaks are also observed in the FTIR range of Cs@NiFe2O4 NPs. The only difference is slight variations in the peaks’ appearance and intensity. The results confirmed the successful coating of NiFe2O4 nanoparticles by chitosan, probably through chemical reaction and electrostatic interaction between the chitosan's positively charged surface and the nickel ferrite's negatively charged surface.
XRD analysis
In Fig. 3A and B, the XRD patterns show NiFe2O4 NPs with and without chitosan coating.
Figure 3.
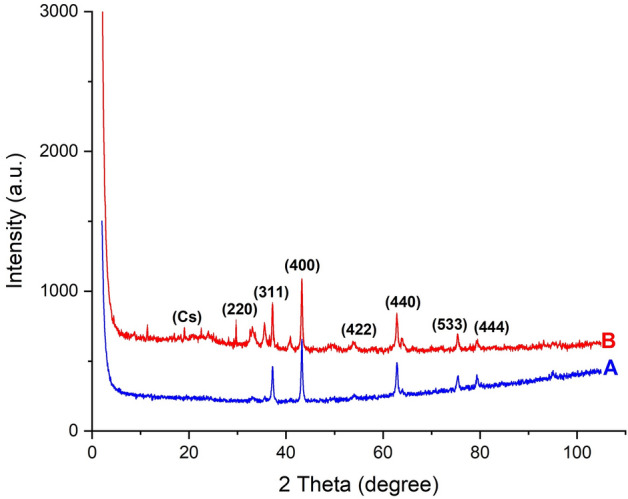
The XRD patterns of NiFe2O4 NPs (A) and Cs@NiFe2O4 NPs (B).
The peaks at 2θ = 30.12°, 37.23°, 43.26°, 54.32°, 63.85°, 75.40°, and 80.02°, respectively, indicate the crystal planes (222), (311), (400), (422), (440), (533), and (444) (Fig. 3A). NiFe2O4 nanoparticles' XRD pattern matches the XRD spectrum on JCPDS standard card no. 10-032553,54.
The XRD pattern of Cs@NiFe2O4 NPs also revealed distinctive NiFe2O4 NPs peaks (Fig. 3B). The retention of the same characteristic peaks and the unchanged intensity of the peaks after the activation of NiFe2O4 NPs coated by Cs composite implies an ideal compatibility and good interaction with the preservation of the crystal structure of nanoparticles at a high level.
Also there are peaks at 2θ = 20.50° and 10.32°, that are identical to pure chitosan in terms of strength and location50. The chitosan peaks in the XRD pattern of Cs@NiFe2O4 NPs also exhibit a low intensity. It can be explained by how interactions with different monomers cause chitosan's well-crystalline linear structure to be disrupted. These findings supported the effective coating of Cs on nanoparticles.
TGA analysis
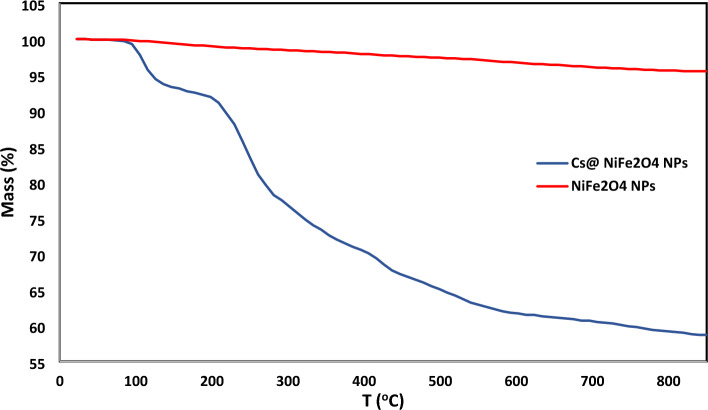
The sorbent's thermal stability was examined utilizing thermogravimetric analysis (Fig. 4). The graph illustrates the high stability of NiFe2O4 NPs up to 800 °C, with minimal degradation of approximately 5%. However, upon heating the sorbent (Cs@NiFe2O4 NPs), a decrease in mass is observed at 197 °C, attributed to the removal of water molecules, indicating that the weight percentage of moisture in the absorbent is approximately 8%. Subsequently, a sharp decline in the weight percentage of the sorbent is evident as the temperature increases to 800 °C, signifying the degradation of chitosan. This observation reveals a decrease in weight percentage of 29% at this stage, indicating the percentage of chitosan present in the sorbent.
Figure 4.
The TGA of NiFe2O4 NPs and Cs@NiFe2O4 NPs.
SEM analysis
The SEM pictures of uncoated and chitosan-coated nickel-ferrite nanoparticles are presented in Fig. 5. The NiFe2O4 NPs (Fig. 5A) demonstrated a high accumulation, relatively large holes, and heterogeneous surface structures. Chitosan-coated nickel ferrite (Fig. 5B) is composed of spherical particles. The average particle size is in the nanoscale, and the largest particles have a diameter of approximately 34 nm. The precipitation rate of the intermediate product is higher than the rate of surface agent arrangement on the particles. After the initial precipitation, chitosan is adsorbed on the particles and declines the surface tension, turning them into spheres with an appropriate surface-to-volume ratio, which leads to the formation of well-differentiated nanospheres with floatability. These findings indicate how chitosan works to keep particles from sticking together and confirm the coating of particles by chitosan. The results were consistent with others55,56.
Figure 5.
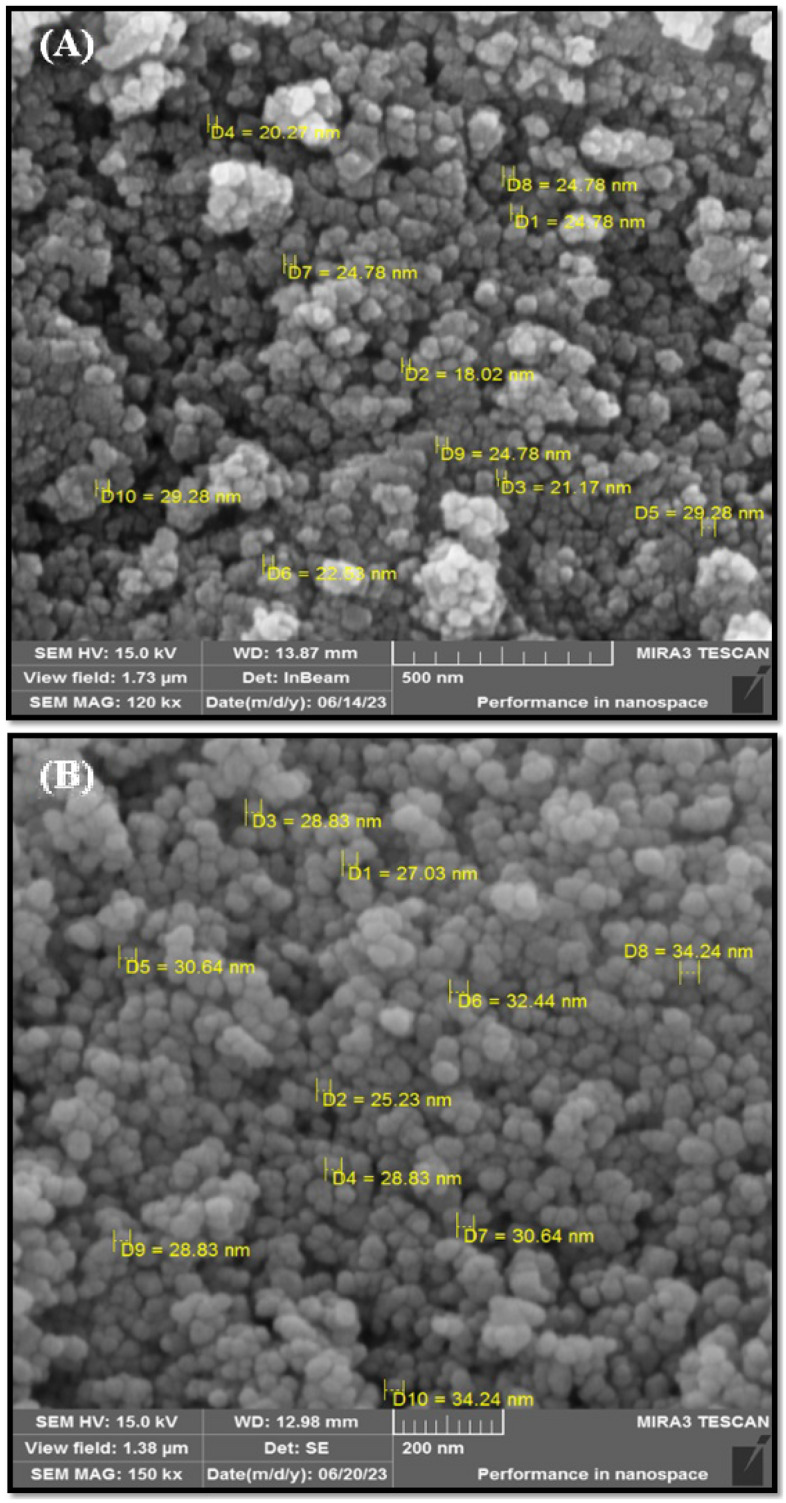
The SEM images of NiFe2O4 NPs (A) and Cs@NiFe2O4 NPs (B).
TEM analysis
The internal structure and microstructural characteristics of NiFe2O4 and Cs@NiFe2O4 NPs were analyzed by TEM (Fig. 6). The NiFe2O4 nanoparticles (Fig. 6A) showed spherical or elliptical shape with various sizes that aggregated due to strong magnetic dipole interactions.
Figure 6.
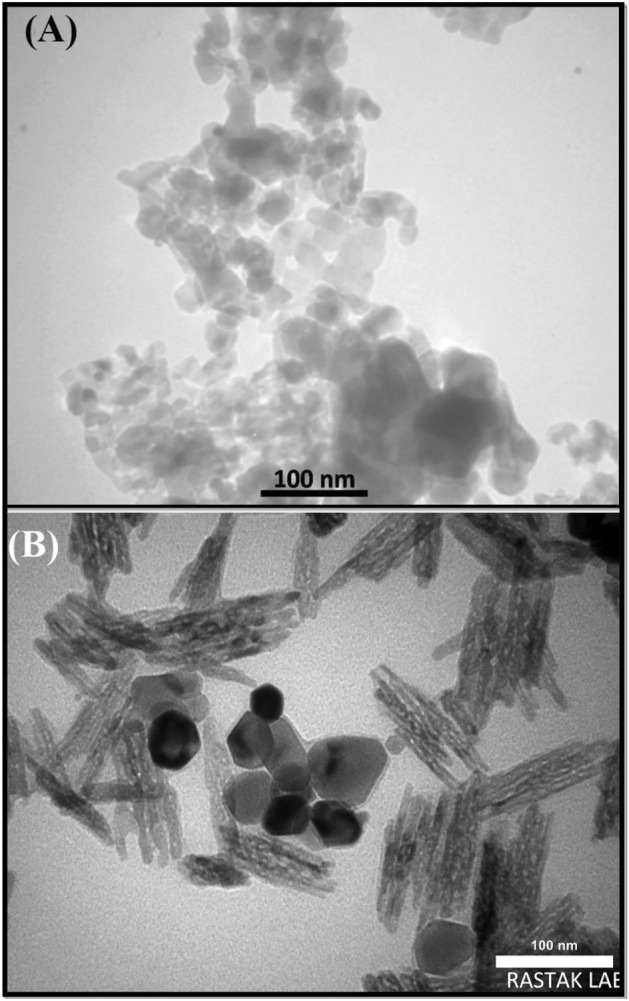
The TEM images of NiFe2O4 NPs (A) and Cs@NiFe2O4 NPs (B).
The incorporation of Cs into NiFe2O4 NPs changed the surface morphology and roughness. The TEM image (Fig. 6B) indicates that the rod-shaped particles are a result of the formation of chitosan nanoparticles within the sorbent structure. Additionally, a reduction in the aggregation of NiFe2O4 NPs is observed as they are dispersed within the chitosan solution during the synthesis of the sorbent. The image reveals that the structure of the sorbent is not uniform, with chitosan nanoparticles generally forming as rod-shaped particles positioned on the surface of NiFe2O4 NPs in certain areas. The TEM images indicated a uniform distribution of Cs@NiFe2O4 NPs with a typical size of 25 ± 5.05 nm. This finding confirms the potential of the developed composite material as an effective platform for a wide range of applications42,56.
BET analysis
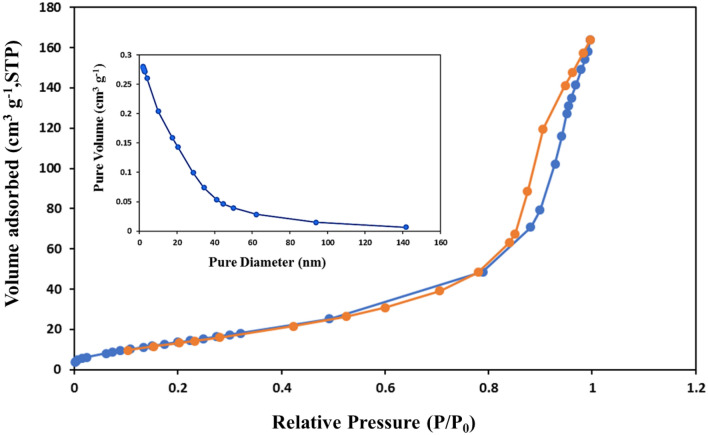
Accurate surface area and porosity measurement is essential for many applications, including catalysts, nano-sorbents, chemicals and additives, pharmaceuticals, and Food-related companies, as well as in nano-structures like metal nanoparticles, nano-tubes, nano-fibers, etc. Determination of the molecule's surface area helps to calculate the surface occupied by the molecule, the sorbent amount, and the total sample area. The surface area of the synthesized Cs@NiFe2O4 NPs was measured using the BET test57. Based on the results, the surface area of the particle was 59.134 m2 g−1, the medium pore diameter was 13.22 nm, the micropore volume was 0.279 cm3 g−1, and the porosity was meso-type (Fig. 7).
Figure 7.
The BET image of Cs@NiFe2O4 NPs.
The type IV isotherm was obtained for the nanocomposite. This type of isotherm is used for porous materials and industrial catalysts, indicating the porous structure of the nanocomposite. Moreover, it demonstrates that the composite has very narrow pores in the capillary form, significantly enhancing the adsorption and the condensing of the sorbent on the surface. The corresponding curve was utilized to determine the pore size distribution 57,58.
Modeling the sorption process
The impacts of several factors, including contact time, sorbent amount, pH, and dye concentration, were investigated on the removal efficiency of sunset yellow dye to maximize effectiveness of dye removal.
A two–level CCD comprising 30 runs of experiments on a block with a random run order was utilized to eliminate uncontrolled factors’ effects. Each experiment was carried out three times, and the average adsorption amount was utilized to calculate the removal efficiency. The designed experiments and the results are presented in Table 1.
The one-way ANOVA test with a confidence interval of 95% was used to evaluate the effect of each factor (Table 2). The analysis of variance demonstrated a high significance of the presented polynomial regression model to predict sunset yellow adsorption on Cs@NiFe2O4 NPs (P ˂ 0.05). Moreover, The p-value for lack of fit (LOF) indicates that the proposed model accurately describes experimental responses. The R-squared and adjusted R-squared (93.07 and 96.42, respectively) indicated a significant ability of the model to predict variations. Besides, the low standard deviation (4.22) and coefficient of variation (5.64%) represented a high accuracy and low error of the experiments.
Table 2.
The ANOVA test for sunset yellow adsorption on Cs@NiFe2O4 NPs.
| Source | DF | P-value |
|---|---|---|
| Model | 14 | 0.000 (significant) |
| Blocks | 1 | 0.000 |
| Linear | 4 | 0.000 |
| F1 | 1 | 0.047 |
| F2 | 1 | 0.010 |
| F3 | 1 | 0.000 |
| F4 | 1 | 0.000 |
| Square | 4 | 0.000 |
| F1* F1 | 1 | 0.014 |
| F2* F2 | 1 | 0.042 |
| F3* F3 | 1 | 0.912 |
| F4* F4 | 1 | 0.006 |
| 2-Way Interaction | 6 | 0.000 |
| F1* F2 | 1 | 0.011 |
| F1* F3 | 1 | 0.193 |
| F1* F4 | 1 | 0.328 |
| F2* F3 | 1 | 0.000 |
| F2* F4 | 1 | 0.022 |
| F3* F4 | 1 | 0.029 |
| Error | 14 | |
| LOF | 10 | 0.1018 (not significant) |
| Pure error | 5 | |
| Total | 29 |
Significant values are in [bold]
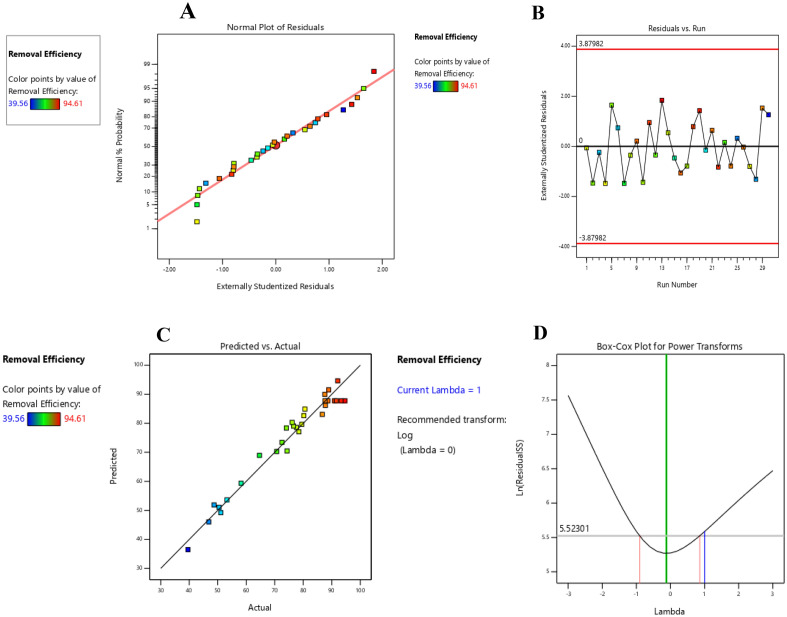
In the normal probability diagram, there are more points around the base line, which indicates that the curve follows the normal distribution (Fig. 8A).
Figure 8.
The normal probability (A), random distribution of residuals (B), predicted values versus experimental values (C), and Box-Cox (D) plots.
The error diagram of the residuals displayed the random distribution of the data around the baseline, indicating that the results do not follow a specific pattern, which reflects the adequacy of the proposed response surface model to remove the sunset yellow dye (Fig. 8B). The Fig. 8C exhibited the consistency of the predicted and experimental results. The Box-Cox diagram (Fig. 8D) indicated the normal distribution of the data, representing the adequacy of the proposed model in removing the dye.
Table 2 shows the significant effect of all the factors and the interactions F4*F4, F1*F1, and F2*F2 on the removal efficiency of sunset yellow dye, with F4*F4 as the most significant. Four two-way interactions between dye concentration and sorbent amount (F1*F2), sorbent amount and contact time (F2*F3), sorbent amount and pH (F2*F4), and pH and contact time (F3*F4) indicated a significant effect on sunset yellow removal and other two-way interactions were not considerable for dye removal.
Regression analysis can be calculated using the central composite design to express the relationship between significant variables and experimental responses. Based on the findings, a full quartic mathematical model is the most effective way to determine this relationship, as shown by the following Eqs. 3.
| 3 |
Effect pH
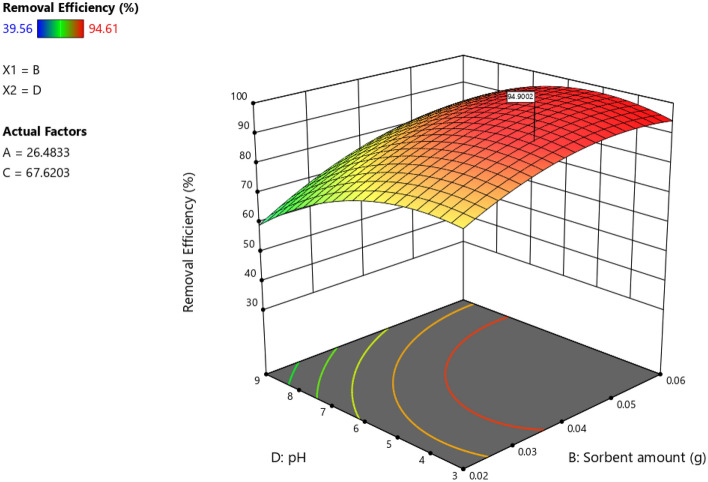
In this study, we looked into the effect of pH in the range of 3–9 on dye adsorption by Cs@NiFe2O4 NPs. Figure 9 shows the impact of pH and sorbent amount interaction about the adsorption of azo dye molecules by the synthesized nano-sorbent. The results indicated that decreasing pH led to a significant increase in adsorption capacity of the sorbent and efficiency of dye removal. Two processes may occur for adsorbing the anionic dye onto the sorbent. First, the sunset yellow dye penetrates the sorbent pores through physical adsorption. Therefore, the sorbent components chitosan and magnetic Fe2O4 significantly impact the process. Second, it is due to intermolecular links (O–H⋯N, O–H⋯π) and electrostatic interactions between the positive surface charge of Cs@NiFe2O4 NPs and the negative charge of the anionic dye.
Figure 9.
The interaction of sorbent and pH.
It has been indicated that raising the pH to ˃7 results in a negative charge on the sorbent surface, and at lower pHs, a positive surface charge will be created. The Sunset yellow is an anionic compound. Therefore, enhancing electrostatic attraction in the middle of the sorbent and the dye is the main factor in increasing adsorption capacity. At acidic pHs, the amine groups of chitosan will be protonated, increasing the electrostatic force between the negatively charged dye molecules and the positively charged sorbent active sites. Under alkaline conditions, the production of hydroxide functional groups in the environment leads to a negative charge on the sorbent surface, resulting in a weak interaction or even a repulsive electrostatic force between the anionic dye molecule and the sorbent, decreasing the adsorption amount. The results were consistent with those of Travolo et al.59 and Aliabadi et al.60.
Sorbent amount, dye concentration, and contact time
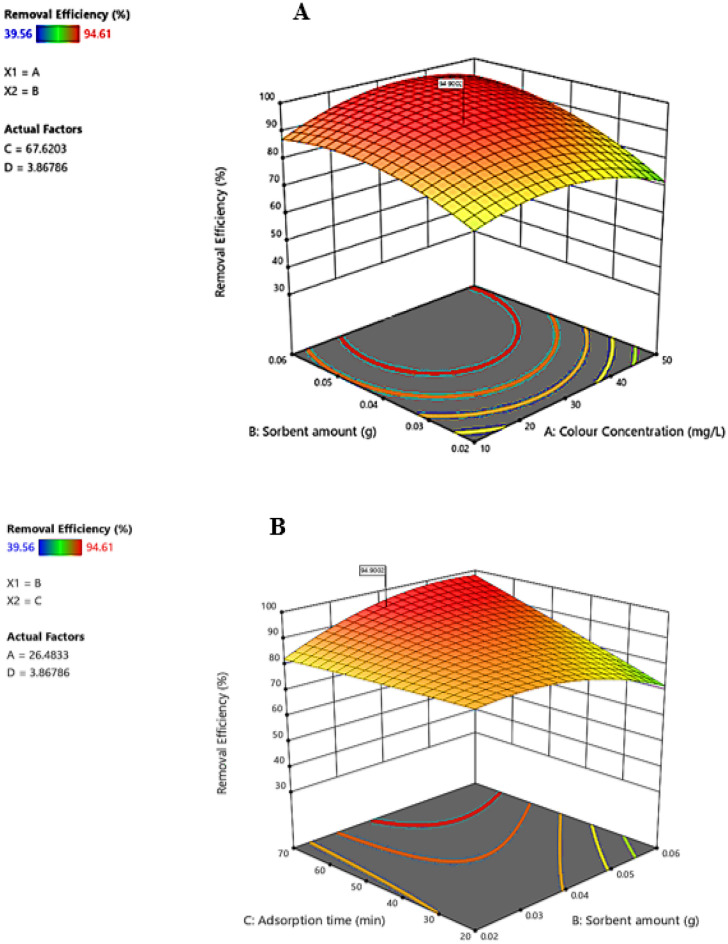
Increasing the dosage of sorbent and reducing the initial dye concentration resulted in a higher removal percentage (Fig. 10A). The explanation for this is that at low dye concentrations, and high sorbent dosage, more active sites are available to adsorb a higher dye percentage. Increasing initial dye concentration decreases the removal percentage due to filling adsorption sites at higher concentrations. Moreover, it resulted in a higher dye adsorption capacity by increasing the driving force for mass transfer on the sorbent surface.
Figure 10.
The interactions of sorbent dose and dye concentration (A) and sorbent dose and contact time (B).
Increasing the sorbent amount and contact time enhanced the dye removal efficiency (Fig. 10B). The color adsorption on the sorbent is maximum in the first minutes due to the high contact surface and accessibility of the sorbent sites. After equilibrium, it decreases by the saturation of surface active sites of the sorbent. Therefore, the sorbent is no longer available to remove the color. Results were in line with the studies of Roosta et al.61, Sadegh et al.62.
Adsorption isotherm
Adsorption isotherm is an important factor in the design of absorption systems and describes the interaction between the sorbent and the adsorbed material. Therefore, it is always considered substantial for determining the capacity for adsorption of a sorbent and optimizing the sorbent amount. The data on equilibrium obtained to aid in the absorption of sunset yellow in the concentration range of 10–150 mg L−1 on the sorbent (0.045 g L-1) by the Langmuir and Freundlich isotherms (Table 3) were used to match the experimental data, which represent information about the system and the capability for adsorption of the sorbent. The linear versions of the Langmuir and Freundlich equations (Eqs. 4 and 5, respectively) are as follows63–65.
| 4 |
| 5 |
Table 3.
Adsorption kinetics and isotherms for sunset yellow removal by Cs@NiFe2O4 NPs.
| Kinetic model | Equation | Parameters | R2 | |
|---|---|---|---|---|
| Pseudo- first- order model | qe (mg g-1) | 95.19 | 0.9594 | |
| K1 (min-1) | 0.011 | |||
| Pseudo- second- order model | qe (mg g-1) | 109.89 | 0.9895 | |
| K2 (g mg-1 min-1) | 0.000203 | |||
| Intra-particle diffusion model | Ki (mg g−1 min−1/2) | 8.76 | 0.9755 |
| Isotherm model | Equation | Parameters | R2 | |
|---|---|---|---|---|
| Langmuir model | qmax (mg g-1) | 212.766 | 0.9682 | |
| b (L mg-1) | 0.049 | |||
| Freundlich model | Kf (mg g-1) | 18.60 | 0.9888 | |
| n | 1.80 |
Where Ce and qe are the initial concentration of the dye in the sample solution and the equilibrium adsorption amount per sorbent mass (mg g−1), respectively. The qmax, b, kf, and n are the maximum monolayer adsorption capacity (mg g−1), Langmuir constant (mg L−1), maximum Freundlich adsorption capacity (mg g−1), and adsorption intensity, respectively.
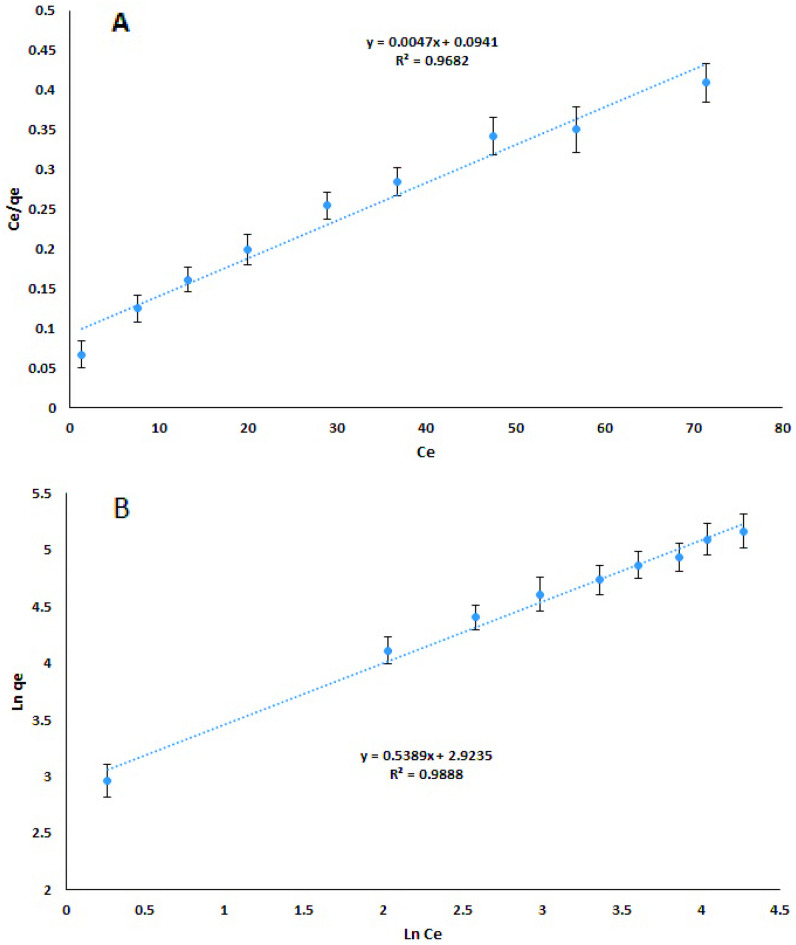
The graphs of Ce/qe versus Ce and ln qe versus ln Ce were drawn to determine the values of the parameters and determine the appropriate isotherm model using the regression coefficient (R2). According to the findings, Freundlich isotherm (Fig. 11B) can better predict dye adsorption by Cs@NiFe2O4 NPs than Langmuir isotherm (Fig. 11A). Therefore, it was concluded that the sorbent surface is heterogeneous, and adsorption is mainly performed in several layers. These outcomes matched up with what was seen in the sorbent's SEM photos.
Figure 11.
Langmuir (A) and Freundlich (B) sorption diagrams (n = 3).
According to the Freundlich equation, the adsorption intensity (n) is usually utilized to evaluate the desirability of the process of adsorption. Optimal adsorption happens when the value of n is in the range of 1 to 10. The attained value of n is 1.85, indicating the process of adsorption appropriateness. The highest adsorption capacity of sunset yellow dye on Cs@NiFe2O4 NPs (qmax) was determined using the Langmuir equation's slope as 212.766 mg g−1.
Adsorption of kinetics
Adsorption kinetics were looked into to understand the dynamics of dye adsorption on Cs@NiFe2O4 NPs due to the abundance of functional groups, such as an increased surface-to-volume ratio, oxygen, and to prepare a predictive model that allows estimating the amount of dye adsorbed during the process. This information can be used to design large systems. Therefore, model kinetics, including pseudo-first-order, pseudo-second-order, and intraparticle diffusion, were extensively used to examination of adsorption process kinetics and fitness of the data on adsorption versus time (Table 3). The linear forms of pseudo-first-order, pseudo-second-order, and intraparticle diffusion models (Eqs. 6, 7, and 8, respectively) for use in the kinetic study are as follows66.
| 6 |
| 7 |
| 8 |
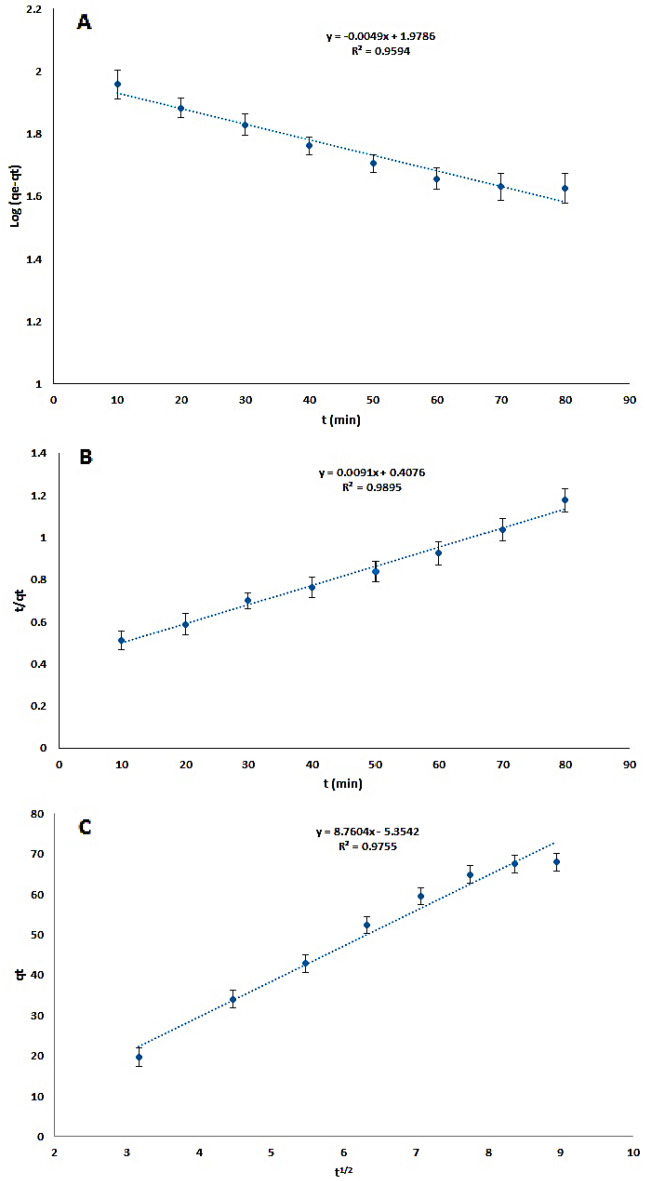
where k, qe (mg g−1), and qt (mg g−1) are the rate constant, the amount of dye adsorbed at equilibrium, and that adsorbed at time t (min), respectively. The impact of contact time in the range of 10–80 min under optimal conditions was investigated to evaluate the kinetic models’ capability to estimate the dye adsorption amount by Cs@NiFe2O4 NPs (Fig. 12).
Figure 12.
The effect of contact time on sunset yellow removal by the CS@ NiFe2O4 NPs (n = 3): The pseudo-first-order kinetic model (A), pseudo-second-order kinetic model (B), and intraparticle diffusion model (C).
The kinetic model of pseudo-first order states that the penetration occurs inside the monolayer, and the variations of the adsorption amount versus time are in proportion to quantity of vacant sorbent sites. The kinetic model of pseudo-first order expresses retarding chemical adsorption process that controls the adsorption, in which the square of the number of unoccupied sites in the sorbent is proportional to the occupation rate of the adsorbed sites.
A linear relationship is obtained by plotting log (qe-qt) versus t, and k1 and qe can be determined from the line slope and y-intercept, respectively. If the y-intercept is not equal to qe, the reaction does not resemble a first-order reaction, even if the diagram has a high correlation coefficient.
Experimental findings for the pseudo-first-order kinetic model (Fig. 12A) and intraparticle diffusion model (Fig. 12C) demonstrated a high degree of non-linearity and a low correlation coefficient.
The pseudo-second-order kinetic diagram (Fig. 12B) obtained by plotting the t/qt values versus t resulted in a straight line with a high correlation coefficient. The second-order kinetic velocity constant (k2) and equilibrium adsorption capacity (qe) were calculated from the y-intercept and the slope of the t/qt graph vs. t, respectively. R2 and qe values demonstrated that the model of kinetic pseudo-second order leads to better results.
The removal efficiency (%) increased up to 68 min and at higher times remaining practically constant. Consequently, the adsorption process is rapid and can achieve equilibrium in under 70 min. This process is mainly performed as a result of the interaction of the anionic dye with the functional groups on the sorbent surface. In addition, low values for the correlation coefficient for the intraparticle distillation model confirmed that the dye diffusion in the pores of the sorbent is notably low, and the sunset yellow adsorption is caused by physical or chemical interactions with CS@NiFe2O4 NPs (Fig. 12, Table 3).
Removal of dye from orange juice samples
The dye removal efficiency of 91.75% and 93.24% was obtained using the nanocomposites for industrial and traditional orange juices, respectively. The outcomes demonstrated that the nanoparticles have acceptable efficiency in the surface adsorption of sunset yellow from the fruit juice samples on a laboratory scale.
Recovery capability
The recoverability of the sorbent is economically significant, indicating the cost-effectiveness of using the sorbent in pollutant removal, the constancy of the adsorbed material on the sorbent surface, and the sorbent regeneration conditions. After the removal procedure, the sorbent was washed using distilled water and then separated using a magnet. An aqueous ammonium solution (0.2 M, 1.0 mL) was added to the sorbent and shaken for 10 min at 150 rpm. The sorbent was then washed with distilled water before reuse. The results in (Fig. 13A) demonstrated that the adsorption efficiency of sunset yellow dye by Cs@NiFe2O4 NPs did not significantly change up to 5 cycles and was above 86%. Any decline in the effectiveness of dye adsorption could be attributed to the inadequate separation of the dye from the sorbent, the slight loss of sorbent during its separation from the solution, and the degradation of the sorbent structure during the dye removal step. Consequently, the synthesized nanocomposite is an effective and enduring sorbent for sunset yellow dye removal, consistent with the findings of Ansari et al.56 and Habiba et al.67. To evaluate the change in the sorbent structure after the desorption process, the XRD pattern of the sorbent after five adsorption–desorption cycles is shown in Fig. 13B, indicating no significant change in the sorbent structure. Only a slight decrease in the intensity of the peaks in this pattern compared to the initial pattern of the sorbent was observed. The SEM image (Fig. 13C) clearly shows that pores remained on the surface of Cs@NiFe2O4 NPs, indicating that less pores may be saturated by the dye sunset yellow during the adsorption process.
Figure 13.
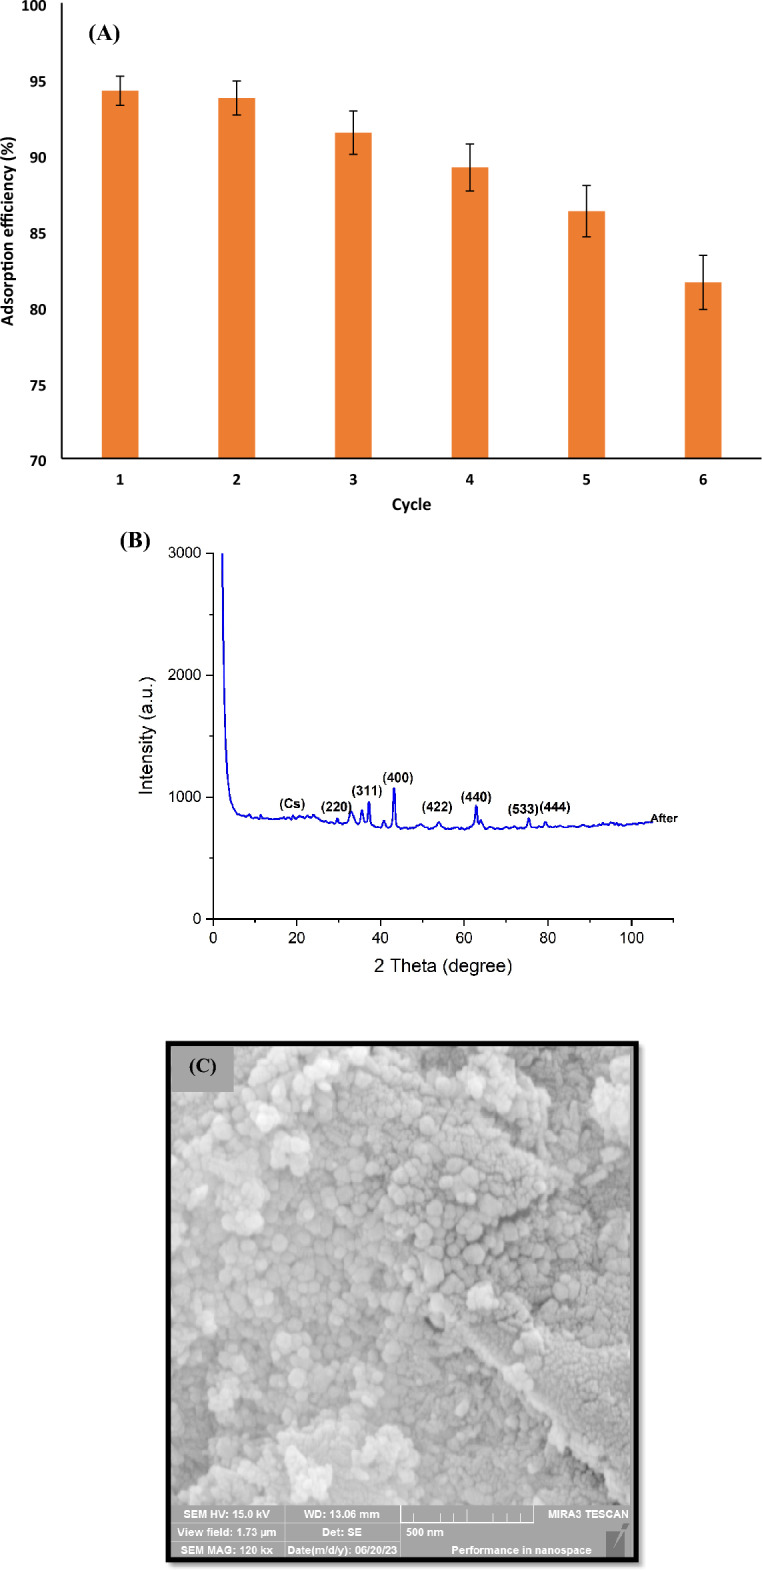
Reusability of Cs@NiFe2O4 NPs for sunset yellow removal (n = 3) (A), XRD pattern (B) and SEM image (C) of Cs@NiFe2O4 NPs after five adsorption–desorption cycles.
Comparison with other sorbents
Table 4 presents a comparison of the efficiency of the synthesized sorbent with other sorbents previously studied for the removal of sunset yellow dye. The data indicates that the developed sorbent demonstrates a favorable adsorption capacity, surpassing most of the prepared sorbents. While sorbent No. 2 (PDMAEMA grafted PS-DVB-VBC) exhibits a higher absorption capacity than the synthetic sorbent, it necessitates a relatively low acidic pH and a larger quantity of sorbent to achieve dye removal. Likewise, the use of sorbent No. 6 (Alligator weed activated carbon) and No. 8 (Thermally reduced graphene oxide) for sunset yellow dye removal requires a significantly longer contact time and a higher amount of sorbent compared to the sorbent prepared in this study, respectively.
Table 4.
Comparison of the various sorbents for sunset yellow removal.
| No | Sorbent | Qe (mg g−1) | pH | sorbent dosage (g L−1) | dye concentration (mg L−1) | Time (min) | Ref |
|---|---|---|---|---|---|---|---|
| 1 | Activated carbon | 44.9 | 1–2 | 0.1 | 150 | 90 | 68 |
| 2 | PDMAEMA grafted PS-DVB-VBC | 312.5 | 2 | 0.4 | 20 | 40 | 69 |
| 3 | OMC-2Nd | 285 | 6.5 | 0.1 | 50 | 240 | 70 |
| 4 | PPy/mw nanocomposite | 212.1 | 2 | 0.007 | 50 | 5 | 60 |
| 5 | MAGO/CTAB | 44.2 | 6 | 0.02 | 30 | 20 | 71 |
| 6 | Alligator weed activated carbon | 271 | 3 | 0.8 | 150 | 240 | 72 |
| 7 | Nickel ferrite | 107.1 | 3 | – | – | – | 73 |
| 8 | TRGO | 243.3 | 6 | 0.25 | 25 | 30 | 74 |
| 9 | m–CS–c–PAM | 359.71 | 2–10 | 1 | 20 | 60 | 58 |
| 10 | Cu; ZnS-NP-AC | 85.39 | 6 | 0.025 | 20 | 3 | 75 |
| 11 | ZnO NPs loaded on activated carbon | 142.8 | 2 | 0.015 | 20 | 10 | 76 |
| 12 | CS@NiFe2O4 | 212.76 | 3.87 | 0.038 | 26.48 | 67.62 | This work |
Study No. 9, the sorbent (Magnetic Fe3O4 embedded chitosan–crosslinked-polyacrylamide composites) demonstrates superior efficiency for dye removal compared to the prepared sorbent. However, it is noteworthy that the steps, reagents, and synthesis time required for preparing this sorbent are significantly greater than those for the sorbent in the study. Additionally, the use of synthetic polymer compounds in this sorbent, while enhancing its stability, could potentially lead to environmental concerns due to their persistence. Therefore, the synthesized sorbent exhibits the proper ability to remove sunset yellow dye with suitable reusability, adsorption capacity, and contact time, making it a promising candidn ate for the effective removal of this dye from food samples.
Conclusion
Cs@NiFe2O4 NPs, a new magnetic adsorbent, were created and characterized using various techniques. Cs@NiFe2O4 NPs is a green and efficient sorbent for the sunset yellow removal dye from food samples. The importance of Cs@NiFe2O4 NPs as a sorbent for removal of synthetic dyes lies in their high adsorption capacity, regeneration potential, environmental friendliness, and fast adsorption rate, making them a promising solution for addressing the challenges of synthetic dye removal in industrial settings. The process of adsorption's main contributing variables, such as pH, contact time, dye concentration, and sorbent amount, were carefully tuned using a design experiment methodology. The sunset yellow dye was adsorbed to the developed nanocomposite mainly by electrostatic interactions. Adsorption data were matched with Freundlich isotherm and models of pseudo-second-order kinetics. The produced sorbent showed excellent efficiency for the recovery of sunset yellow dye, which was greater than 86% after five cycles of adsorption and desorption. The recovery data for juice samples indicated that the synthesized nanocomposite could be an efficient sorbent for sunset yellow removal in food samples.
Acknowledgements
The authors acknowledge the financial and technical support of the Tehran University of Medical Sciences, Tehran, Iran (Grant Number: 62414; Ethics Code: IR.TUMS.SPH.REC.1401.157). This work is based upon research funded by Iran National Science Foundation (INSF) under project No.4025197.
Author contributions
S.SH: Writing- Original draft, Design of study, Methodology, Writing- Reviewing and Editing. N.S.: Conceptualization, Supervision, Design of study, Writing- Reviewing and Editing. E.M.-A.: Conceptualization, Supervision, Design of study, Writing- Reviewing and Editing. G.J.K. and P.S.: Visualization, Investigation, Methodology, Software, Validation, and M.A.F.: Methodology. Software, Validation, Data curation. All authors reviewed the manuscript.
Data availability
The datasets generated and analyzed during the current study were available from the corresponding author on reasonable request.
Competing interests
The authors declare no competing interests.
Footnotes
The original online version of this Article was revised: The Acknowledgements section in the original version of this Article was incomplete. It now reads: “The authors acknowledge the financial and technical support of the Tehran University of Medical Sciences, Tehran, Iran (Grant Number: 62414; Ethics Code: IR.TUMS.SPH.REC.1401.157). This work is based upon research funded by Iran National Science Foundation (INSF) under project No.4025197.”
Publisher's note
Springer Nature remains neutral with regard to jurisdictional claims in published maps and institutional affiliations.
Change history
2/27/2024
A Correction to this paper has been published: 10.1038/s41598-024-55343-8
Contributor Information
Nabi Shariatifar, Email: nshariatifar@alumni.ut.ac.ir.
Ebrahim Molaee-Aghaee, Email: emolaeeaghaee@sina.tums.ac.ir.
References
- 1.Avazpour M, Seifipour F, Abdi J, Nabavi T, Zamanian-Azodi M. Detection of dyes in confectionery products using thin-layer chromatography. Iran. J. Nutr. Sci. Food Technol. 2013;8:73–78. [Google Scholar]
- 2.Gholami Z, Marhamatizadeh MH, Mazloomi SM, Rashedinia M, Yousefinejad S. Identification of synthetic dyes in traditional juices and beverages in Shiraz, Iran. Int. J. Nutr. Sci. 2021;6:39–44. [Google Scholar]
- 3.Sadowska B, Gawinowska M, Sztormowska M, Chełmińska M. Hypersensitivity of azo dyes in urticaria patients based on a single-blind, placebo-controlled oral challenge. Adv. Dermatol. Allergol. 2021 doi: 10.5114/ada.2021.110263. [DOI] [PMC free article] [PubMed] [Google Scholar]
- 4.Martins N, Roriz CL, Morales P, Barros L, Ferreira IC. Food colorants: Challenges, opportunities and current desires of agro-industries to ensure consumer expectations and regulatory practices. Trends Food Sci. Technol. 2016;52:1–15. doi: 10.1016/j.tifs.2016.03.009. [DOI] [Google Scholar]
- 5.Chung K-T. Azo dyes and human health: A review. J. Environ. Sci. Health Part C. 2016;34:233–261. doi: 10.1080/10590501.2016.1236602. [DOI] [PubMed] [Google Scholar]
- 6.Weldegebrieal GK. Synthesis method, antibacterial and photocatalytic activity of ZnO nanoparticles for azo dyes in wastewater treatment: A review. Inorg. Chem. Commun. 2020;120:108140. doi: 10.1016/j.inoche.2020.108140. [DOI] [Google Scholar]
- 7.Moghadasi M, Rahimi A, Heshmati A. The prevalence of synthetic color in saffron and sweet products (yellow halvah, candy and crystallized sugar) supplied in store of Hamadan City using thin layer chromatography (TLC) Pajouhan Sci. J. 2019;17:31–36. doi: 10.21859/psj.17.2.31. [DOI] [Google Scholar]
- 8.Arnold LE, Lofthouse N, Hurt E. Artificial food colors and attention-deficit/hyperactivity symptoms: Conclusions to dye for. Neurotherapeutics. 2012;9:599–609. doi: 10.1007/s13311-012-0133-x. [DOI] [PMC free article] [PubMed] [Google Scholar]
- 9.Stevens LJ, et al. Mechanisms of behavioral, atopic, and other reactions to artificial food colors in children. Nutr. Rev. 2013;71:268–281. doi: 10.1111/nure.12023. [DOI] [PubMed] [Google Scholar]
- 10.Molaei Tavani S, Nobari S, Ghasemi R, Mazloomi S. Survey the authorized and unauthorized food colorings consumption in the food supply of Nazarabad township in 1395. J. Environ. Health Eng. 2017;4:299–306. [Google Scholar]
- 11.Choi H. Risk assessment of daily intakes of artificial colour additives in food commonly consumed in Korea. J. Food Nutr. Res. 2012;51:13–22. [Google Scholar]
- 12.Yoshioka N, Ichihashi K. Determination of 40 synthetic food colors in drinks and candies by high-performance liquid chromatography using a short column with photodiode array detection. Talanta. 2008;74:1408–1413. doi: 10.1016/j.talanta.2007.09.015. [DOI] [PubMed] [Google Scholar]
- 13.Rouhani S, Pirkarimi A. A review on analytical procedures azo dyes in the food industry. J Stud Color World. 2018;7:19–36. [Google Scholar]
- 14.Iranian National Standard. Permitted foodadditives - Food colors -List and general specifications. Numbers 740. 5th Revision. (2013)
- 15.EFSA Panel on Food Additives and Nutrient Sources added to Food (ANS) Reconsideration of the temporary ADI and refined exposure assessment for Sunset Yellow FCF (E 110) EFSA J. 2014;12:3765. doi: 10.2903/j.efsa.2014.3765. [DOI] [Google Scholar]
- 16.Mueller, U., DiNovi, M., Leblanc, J. & Vavasour, E. SUNSET yELLOW FCF (addendum). In Safety evaluation of certain food additives and contaminants, 141 (2012).
- 17.Tayyab, M. et al. Integration of redox cocatalysts for photocatalytic hydrogen evolution. In UV‐Visible Photocatalysis for Clean Energy Production and Pollution Remediation: Materials, Reaction Mechanisms, and Applications, 93–107 (2023).
- 18.Tayyab M, et al. A new breakthrough in photocatalytic hydrogen evolution by amorphous and chalcogenide enriched cocatalysts. Chem. Eng. J. 2023;455:140601. doi: 10.1016/j.cej.2022.140601. [DOI] [Google Scholar]
- 19.Gordi Z, Ghorbani M, Ahmadian Khakhiyani M. Adsorptive removal of enrofloxacin with magnetic functionalized graphene oxide@ Metal-organic frameworks employing D-optimal mixture design. Water Environ. Res. 2020;92:1935–1947. doi: 10.1002/wer.1346. [DOI] [PubMed] [Google Scholar]
- 20.Ghorbani M, Shams A, Seyedin O, Afshar Lahoori N. Magnetic ethylene diamine-functionalized graphene oxide as novel sorbent for removal of lead and cadmium ions from wastewater samples. Environ. Sci. Pollut. Res. 2017;25:5655–5667. doi: 10.1007/s11356-017-0929-7. [DOI] [PubMed] [Google Scholar]
- 21.Ghorbani M, Seyedin O, Aghamohammadhassan M. Adsorptive removal of lead (II) ion from water and wastewater media using carbon-based nanomaterials as unique sorbents: A review. J. Environ. Manag. 2020;254:109814. doi: 10.1016/j.jenvman.2019.109814. [DOI] [PubMed] [Google Scholar]
- 22.Ghorbani M, Ariavand S, Aghamohammadhasan M, Seyedin O. Synthesis and optimization of a green and efficient sorbent for removal of three heavy metal ions from wastewater samples: Kinetic, thermodynamic, and isotherm studies. J. Iran. Chem. Soc. 2021;18:1947–1963. doi: 10.1007/s13738-021-02161-8. [DOI] [Google Scholar]
- 23.Uddin MJ, Ampiaw RE, Lee W. Adsorptive removal of dyes from wastewater using a metal-organic framework: A review. Chemosphere. 2021;284:131314. doi: 10.1016/j.chemosphere.2021.131314. [DOI] [PubMed] [Google Scholar]
- 24.Dutta S, Gupta B, Srivastava SK, Gupta AK. Recent advances on the removal of dyes from wastewater using various adsorbents: A critical review. Mater. Adv. 2021;2:4497–4531. doi: 10.1039/D1MA00354B. [DOI] [Google Scholar]
- 25.Tayyab M, et al. One-pot in-situ hydrothermal synthesis of ternary In2S3/Nb2O5/Nb2C Schottky/S-scheme integrated heterojunction for efficient photocatalytic hydrogen production. J. Colloid Interface Sci. 2022;628:500–512. doi: 10.1016/j.jcis.2022.08.071. [DOI] [PubMed] [Google Scholar]
- 26.Tayyab M, et al. Simultaneous hydrogen production with the selective oxidation of benzyl alcohol to benzaldehyde by a noble-metal-free photocatalyst VC/CdS nanowires. Chin. J. Catal. 2022;43:1165–1175. doi: 10.1016/S1872-2067(21)63997-9. [DOI] [Google Scholar]
- 27.Liu Y, et al. Single-atom Pt loaded zinc vacancies ZnO–ZnS induced type-V electron transport for efficiency photocatalytic H2 evolution. Solar Rrl. 2021;5:2100536. doi: 10.1002/solr.202100536. [DOI] [Google Scholar]
- 28.Fallahizadeh S, et al. Enhanced photocatalytic degradation of amoxicillin using a spinning disc photocatalytic reactor (SDPR) with a novel Fe3O4@ void@ CuO/ZnO yolk-shell thin film nanostructure. Sci. Rep. 2023;13:16185. doi: 10.1038/s41598-023-43437-8. [DOI] [PMC free article] [PubMed] [Google Scholar]
- 29.Barzegar G, et al. Ciprofloxacin degradation by catalytic activation of monopersulfate using Mn–Fe oxides: Performance and mineralization. Water Sci. Technol. 2023;87:1029–1042. doi: 10.2166/wst.2023.059. [DOI] [PubMed] [Google Scholar]
- 30.Kamani M, Rahmati M, Vandani SAK, Fard GC. Investigation of “MCM-22”, “ZSM-12 & 35 COMPOSITE”, and “ZEOLITE AL-MORDENITE & ZSM-39 COMPOSITE” crystals by analysis of characterization techniques. J. Chil. Chem. Soc. 2021;66:5332–5338. doi: 10.4067/s0717-97072021000405332. [DOI] [Google Scholar]
- 31.Raina A, Kaul S, Dhar MK. Sniffing out adulteration in saffron-detection methods and health risks. Food Control. 2023;155:110042. doi: 10.1016/j.foodcont.2023.110042. [DOI] [Google Scholar]
- 32.Al-Najar B, Kamel AH, Albuflasa H, Hankins NP. Spinel ferrite nanoparticles as potential materials in chlorophenol removal from wastewater. Environ. Sci. Pollut. Res. 2023 doi: 10.1007/s11356-023-29809-7. [DOI] [PubMed] [Google Scholar]
- 33.Mahmoud ZH, et al. Functionalize and supercapacitor performance of magnetic oxide nanoparticles. Inorg. Chem. Commun. 2023;154:110884. doi: 10.1016/j.inoche.2023.110884. [DOI] [Google Scholar]
- 34.Gasser A, et al. Feasibility of superparamagnetic NiFe2O4 and GO-NiFe2O4 nanoparticles for magnetic hyperthermia. Mater. Sci. Eng. B. 2023;297:116721. doi: 10.1016/j.mseb.2023.116721. [DOI] [Google Scholar]
- 35.Dastjerdi OD, Shokrollahi H, Mirshekari S. A review of synthesis, characterization, and magnetic properties of soft spinel ferrites. Inorg. Chem. Commun. 2023;153:110797. doi: 10.1016/j.inoche.2023.110797. [DOI] [Google Scholar]
- 36.Sabie V, Constantin CP, Caltun OF. Applications of Nanostructured Ferrites. Elsevier; 2023. pp. 123–160. [Google Scholar]
- 37.Yousefi M, Farzadkia M, Mahvi A.H, Kermani M, Gholami M, Esrafili A. Photocatalytic degradation of ciprofloxacin using a novel carbohydrate-based nanocomposite from aqueous solutions. Chemosphere. 2024;349:140972. doi: 10.1016/j.chemosphere.2023.140972. [DOI] [PubMed] [Google Scholar]
- 38.Wani SUD, et al. A review on chitosan and alginate-based microcapsules: Mechanism and applications in drug delivery systems. Int. J. Biol. Macromol. 2023;248:125875. doi: 10.1016/j.ijbiomac.2023.125875. [DOI] [PubMed] [Google Scholar]
- 39.Akl MA, Mostafa AG, Abdelaal MY, Nour MAK. Surfactant supported chitosan for efficient removal of Cr (VI) and anionic food stuff dyes from aquatic solutions. Sci. Rep. 2023;13:15786. doi: 10.1038/s41598-023-43034-9. [DOI] [PMC free article] [PubMed] [Google Scholar]
- 40.Loulic FB, Shirazi RHSM, Miralinaghi M, Panahi HA, Moniri E. Highly efficient removal of toxic As (V), Cd (II), and Pb (II) ions from water samples using MnFe2O4@ SBA-15-(CH2)3-adenine as a recyclable bio-nanoadsorbent. Microporous Mesoporous Mater. 2023;356:112567. doi: 10.1016/j.micromeso.2023.112567. [DOI] [Google Scholar]
- 41.Ahmad MF, et al. Green approach to water purification: Investigating methyl orange dye adsorption using chitosan/polyethylene glycol composite membrane. J. Polym. Environ. 2023 doi: 10.1007/s10924-023-02994-9. [DOI] [Google Scholar]
- 42.Shokri S, et al. Synthesis and characterization of a novel magnetic chitosan–nickel ferrite nanocomposite for antibacterial and antioxidant properties. Sci. Rep. 2023;13:15777. doi: 10.1038/s41598-023-42974-6. [DOI] [PMC free article] [PubMed] [Google Scholar]
- 43.Rezagholizade-Shirvan A, Masrournia M, Fathi Najafi M, Behmadi H. Synthesis and characterization of nanoparticles based on chitosan-biopolymers systems as nanocarrier agents for curcumin: Study on pharmaceutical and environmental applications. Polym. Bull. 2023;80:1495–1517. doi: 10.1007/s00289-022-04095-4. [DOI] [Google Scholar]
- 44.Rezagholizade-shirvan A, Najafi MF, Behmadi H, Masrournia M. Preparation of nano-composites based on curcumin/chitosan-PVA-alginate to improve stability, antioxidant, antibacterial and anticancer activity of curcumin. Inorg. Chem. Commun. 2022;145:110022. doi: 10.1016/j.inoche.2022.110022. [DOI] [Google Scholar]
- 45.Vandani SAK, et al. Preparation of magnetic Fe3O4/MoO3/MCM-22 photocatalyst and its study on metronidazole adsorption, degradation, and process optimization. Russ. J. Phys. Chem. A. 2023;97:618–632. doi: 10.1134/S003602442304026X. [DOI] [Google Scholar]
- 46.Rose PK, Kumar R, Kumar R, Kumar M, Sharma P. Congo red dye adsorption onto cationic amino-modified walnut shell: Characterization, RSM optimization, isotherms, kinetics, and mechanism studies. Groundw. Sustain. Dev. 2023;21:100931. doi: 10.1016/j.gsd.2023.100931. [DOI] [Google Scholar]
- 47.Rahmati M, Fazaeli R, Saravani MG, Ghiasi R. Optimization and modeling of complete removal of N-compounds from oil cut using response surface methodology (RSM) by CuAlO2/ZSM-12&35 as a new photocatalyst. Phys. Chem. Res. 2020;8:585–608. [Google Scholar]
- 48.Çınar S, Kaynar ÜH, Aydemir T, Kaynar SÇ, Ayvacıklı M. An efficient removal of RB5 from aqueous solution by adsorption onto nano-ZnO/Chitosan composite beads. Int. J. Biol. Macromol. 2017;96:459–465. doi: 10.1016/j.ijbiomac.2016.12.021. [DOI] [PubMed] [Google Scholar]
- 49.Mustafa I. Methylene blue removal from water using H2SO4 crosslinked magnetic chitosan nanocomposite beads. Microchem. J. 2019;144:397–402. doi: 10.1016/j.microc.2018.09.032. [DOI] [Google Scholar]
- 50.Yuvaraja G, et al. Preparation of novel aminated chitosan schiff’s base derivative for the removal of methyl orange dye from aqueous environment and its biological applications. Int. J. Biol. Macromol. 2020;146:1100–1110. doi: 10.1016/j.ijbiomac.2019.09.236. [DOI] [PubMed] [Google Scholar]
- 51.Tsai F-C, et al. Adsorptive removal of methyl orange from aqueous solution with crosslinking chitosan microspheres. J. Water Process Eng. 2014;1:2–7. doi: 10.1016/j.jwpe.2014.02.001. [DOI] [Google Scholar]
- 52.Ahmad T, et al. Chitosan-coated nickel-ferrite nanoparticles as contrast agents in magnetic resonance imaging. J. Magn. Magn. Mater. 2015;381:151–157. doi: 10.1016/j.jmmm.2014.12.077. [DOI] [Google Scholar]
- 53.Mazrouaa AM, Mohamed MG, Fekry M. Physical and magnetic properties of iron oxide nanoparticles with a different molar ratio of ferrous and ferric. Egypt. J. Pet. 2019;28:165–171. doi: 10.1016/j.ejpe.2019.02.002. [DOI] [Google Scholar]
- 54.Liu J, Yang H, Xue X. Preparation of different shaped α-Fe2O3 nanoparticles with large particles of iron oxide red. CrystEngComm. 2019;21:1097–1101. doi: 10.1039/C8CE01920G. [DOI] [Google Scholar]
- 55.Ramezani S, Ghazitabar A, Sadrnezhaad SK. Synthesis and characterization of chitosan coating of NiFe2O4 nanoparticles for biomedical applications. J. Iran. Chem. Soc. 2016;13:2069–2076. doi: 10.1007/s13738-016-0924-9. [DOI] [Google Scholar]
- 56.Ansari MJ, et al. Preparation of new bio-based chitosan/Fe2O3/NiFe2O4 as an efficient removal of methyl green from aqueous solution. Int. J. Biol. Macromol. 2022;198:128–134. doi: 10.1016/j.ijbiomac.2021.12.082. [DOI] [PubMed] [Google Scholar]
- 57.Oymak T, Dural E. Determination of sunset yellow, allura red, and fast green using a novel magnetic nanoadsorbent modified with Elaeagnus angustifolia based on magnetic solid-phase extraction by HPLC. Braz. J. Pharm. Sci. 2023 doi: 10.1590/s2175-97902022e20884. [DOI] [Google Scholar]
- 58.Jiang R, et al. Magnetic Fe3O4 embedded chitosan–crosslinked-polyacrylamide composites with enhanced removal of food dye: Characterization, adsorption and mechanism. Int. J. Biol. Macromol. 2023;227:1234–1244. doi: 10.1016/j.ijbiomac.2022.11.310. [DOI] [PubMed] [Google Scholar]
- 59.Travlou NA, Kyzas GZ, Lazaridis NK, Deliyanni EA. Functionalization of graphite oxide with magnetic chitosan for the preparation of a nanocomposite dye adsorbent. Langmuir. 2013;29:1657–1668. doi: 10.1021/la304696y. [DOI] [PubMed] [Google Scholar]
- 60.Aliabadi RS, Mahmoodi NO. Synthesis and characterization of polypyrrole, polyaniline nanoparticles and their nanocomposite for removal of azo dyes; Sunset yellow and Congo red. J. Clean. Prod. 2018;179:235–245. doi: 10.1016/j.jclepro.2018.01.035. [DOI] [Google Scholar]
- 61.Roosta M, Ghaedi M, Sahraei R, Purkait M. Ultrasonic assisted removal of sunset yellow from aqueous solution by zinc hydroxide nanoparticle loaded activated carbon: Optimized experimental design. Mater. Sci. Eng. C. 2015;52:82–89. doi: 10.1016/j.msec.2015.03.036. [DOI] [PubMed] [Google Scholar]
- 62.Sadegh N, Haddadi H, Asfaram A. Synthesis of a green magnetic biopolymer derived from oak fruit hull tannin for the efficient and simultaneous adsorption of a mixture of Malachite Green and Sunset Yellow dyes from aqueous solutions. New J. Chem. 2022;46:11862–11876. doi: 10.1039/D2NJ00994C. [DOI] [Google Scholar]
- 63.Heydari R, Khavarpour M. Adsorption of malachite green from aqueous solution by nanozeolite clinoptilolite: Equilibrium, kinetic and thermodynamic studies. Int. J. Eng. 2018;31:1–11. [Google Scholar]
- 64.Ghorbani M, Shams A, Seyedin O, Afshar Lahoori N. Magnetic ethylene diamine-functionalized graphene oxide as novel sorbent for removal of lead and cadmium ions from wastewater samples. Environ. Sci. Pollut. Res. 2018;25:5655–5667. doi: 10.1007/s11356-017-0929-7. [DOI] [PubMed] [Google Scholar]
- 65.Mahmoudian MH, et al. Statistical modeling and optimization of dexamethasone adsorption from aqueous solution by Fe3O4@ NH2-MIL88B nanorods: Isotherm, kinetics, and thermodynamic. Environ. Res. 2023;236:116773. doi: 10.1016/j.envres.2023.116773. [DOI] [PubMed] [Google Scholar]
- 66.Yousefi M, Gholami M, Oskoei V, Mohammadi AA, et al. Comparison of LSSVM and RSM in simulating the removal of ciprofloxacin from aqueous solutions using magnetization of functionalized multi-walled carbon nanotubes: Process optimization using GA and RSM techniques. J. Environ. Chem. Eng. 2021;9:105677. doi: 10.1016/j.jece.2021.105677. [DOI] [Google Scholar]
- 67.Habiba U, Afifi AM, Salleh A, Ang BC. Chitosan/(polyvinyl alcohol)/zeolite electrospun composite nanofibrous membrane for adsorption of Cr6+, Fe3+ and Ni2+ J. Hazard. Mater. 2017;322:182–194. doi: 10.1016/j.jhazmat.2016.06.028. [DOI] [PubMed] [Google Scholar]
- 68.Chukwuemeka-Okorie HO, Ekuma FK, Akpomie KG, Nnaji JC, Okereafor AG. Adsorption of tartrazine and sunset yellow anionic dyes onto activated carbon derived from cassava sievate biomass. Appl. Water Sci. 2021;11:1–8. doi: 10.1007/s13201-021-01357-w. [DOI] [Google Scholar]
- 69.Yayayürük O, Yayayürük AE, Özmen P, Karagöz B. PDMAEMA grafted microspheres as an efficient adsorbent for the removal of Sunset yellow from pharmaceutical preparations, beverages and waste water. Eur. Polym. J. 2020;141:110089. doi: 10.1016/j.eurpolymj.2020.110089. [DOI] [Google Scholar]
- 70.Ahmad ZU, et al. Neodymium embedded ordered mesoporous carbon (OMC) for enhanced adsorption of sunset yellow: Characterizations, adsorption study and adsorption mechanism. Chem. Eng. J. 2019;359:814–826. doi: 10.1016/j.cej.2018.11.174. [DOI] [Google Scholar]
- 71.Yakout AA, Mahmoud ME. Fabrication of magnetite-functionalized-graphene oxide and hexadecyltrimethyl ammonium bromide nanocomposite for efficient nanosorption of sunset yellow. Mater. Sci. Eng. C. 2018;92:287–296. doi: 10.1016/j.msec.2018.06.060. [DOI] [PubMed] [Google Scholar]
- 72.Kong Q, et al. Kinetic and equilibrium studies of the biosorption of sunset yellow dye by alligator weed activated carbon. Desalin. Water Treat. 2017;66:281–290. doi: 10.5004/dwt.2017.20223. [DOI] [Google Scholar]
- 73.Zandipak R, Sobhanardakani S. Synthesis of NiFe2O4 nanoparticles for removal of anionic dyes from aqueous solution. Desalin. Water Treat. 2016;57:11348–11360. doi: 10.1080/19443994.2015.1050701. [DOI] [Google Scholar]
- 74.Coros M, et al. Thermally reduced graphene oxide as green and easily available adsorbent for sunset yellow decontamination. Environ. Res. 2020;182:109047. doi: 10.1016/j.envres.2019.109047. [DOI] [PubMed] [Google Scholar]
- 75.Agarwal S, et al. Ultrasound-assisted adsorption of Sunset Yellow CFC dye onto Cu doped ZnS nanoparticles loaded on activated carbon using response surface methodology based on central composite design. J. Mol. Liq. 2016;219:332–340. doi: 10.1016/j.molliq.2016.02.100. [DOI] [Google Scholar]
- 76.Maghsoudi M, Ghaedi M, Zinali A, Ghaedi A, Habibi M. Artificial neural network (ANN) method for modeling of sunset yellow dye adsorption using zinc oxide nanorods loaded on activated carbon: Kinetic and isotherm study. Spectrochim. Acta Part A Mol. Biomol. Spectrosc. 2015;134:1–9. doi: 10.1016/j.saa.2014.06.106. [DOI] [PubMed] [Google Scholar]
Associated Data
This section collects any data citations, data availability statements, or supplementary materials included in this article.
Data Availability Statement
The datasets generated and analyzed during the current study were available from the corresponding author on reasonable request.


