Change history
1/5/2024
Editor’s Note: Readers are alerted that the conclusions presented in this article are subject to criticisms that are being considered by the Editors. A further editorial response will follow the resolution of these issues.
Abstract
This paper reports the discovery that water can trigger a peculiar nuclear reaction and produce energy. Cavitation may induce unusual reactions through implosion of water vapor bubbles. Many of this research has been published formally or informally. We have conducted experiments using two reactor types made from multiple-pipe heat exchanger and found that the heat exchange process of water produces peculiar excess heat and abnormally high pressure leading to rupture of the reactor. Recently, we have tested another eight reactors. Interestingly, these reactors produce non-condensable gas. We suspected that they include 22Ne and CO2. We used a mass spectrometer (MS) to analyze 14 gas samples collected from 8 reactors, including ten samples showing a coefficient of performance COPx > 1.05 (with excess heat) and four having COPx < 1.05 (without excess heat). Several methods were adopted to identify the gas content. For CO2 identification, two methods are employed. For 22Ne identification, three methods are employed. All the results confirm that isotope 22Ne and regular CO2 really exist in the output gas from reactors determined to have excess heat. We conjecture a possible mechanism to produce 22Ne and CO2 and find out that 12C and isotope 17O are the intermediate. They finally form isotope gases containing 17O, including H2O-17 (heavy-oxygen water), isotope O2 (16O–17O), and isotope CO2 (12C–16O–17O). In the excess heat producing reactors, all these gasses were detected by MS in the absence of 20Ne and 21Ne. The observed isotope gases produced from reactors having excess heat verifies that water can trigger a peculiar nuclear reaction and produce energy.
Subject terms: Energy science and technology, Engineering
Review of peculiar phenomena observed in heat exchange process of water
Possible energy production via water cavitation has been noted for a long time. It was occasionally reported formally or informally that cavitation of water may induce some form of reaction by way of implosion of water vapor bubbles which produces excess energy1–10.
We have conducted experiments using two reactors made from concentric multiple-pipe heat exchanger and found that, when water is flowing through a tiny space and heated, it produces peculiar excess heat probably by cavitation and dynamic implosion of nanobubbles11. Water used in the experiments is the city water filtered by reverse osmosis (RO) filter.
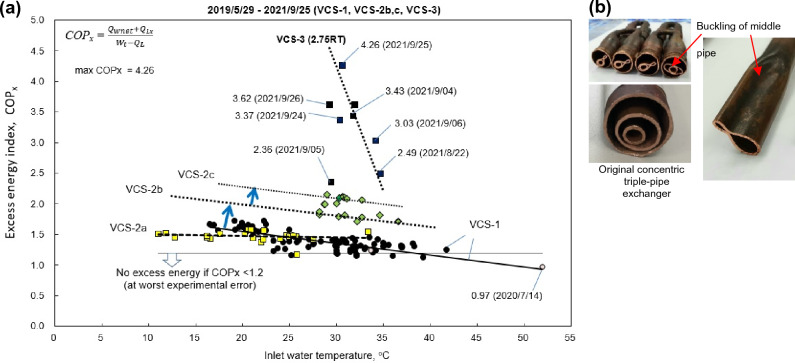
The first reactor (VCS)11 is a triple-pipe heat exchanger (THX) (about 30 meter long) using R22 vapor from a freon compressor (3 kW input) as the heat source to heat the pressurized water (about 21 bar) flowing through a tiny channel of THX, about 2 mm gap. The water flow can be controlled as a pulse flow, about 2 to 10 cycles per minute, through a control valve. VCS was developed for 2 years with several modifications11. The inlet water temperature varied between 10 and 55 °C at average flowrate around 1.2 liter/min. The compressor outlet temperature varied around 150–160 °C. Modification of VCS-1, VCS-2a, VCS-2b, VCS-2c, VCS-3 includes the change of pulse cycle period of water flow, the optimization of piping resistance in THX, and the change of lubrication oil of compressor which will alter the heating rate of water inside THX.
The coefficient of performance COPx is defined as the ratio of heat output to heat input across the reactor at steady state, (Qwnet + QLx)/(Wt − QL). The maximum COPx obtained in VCS was 4.26, Fig. 1a. Some peculiar phenomena were observed in VCS during the tests. Abnormally high pressure (greater than 720 bar) was observed which ruptured the pressure gauges and copper pipes, Fig. 1b. Possible nuclear transmutation was found by SEM/EDX inspection of ruptured copper pipe samples (C increases 200–500%, O 300–600%, Fe 400%, and new elements P, S, Ca appears).
Figure 1.
Test results of Reactor 1 (VCS). (a) Variation of reactor’s COPx during modifications [adding extended data of Ref.11]. (b) Buckling and deformation of pipes in VCS-1 when COPx > 2.0. [from Ref.11].
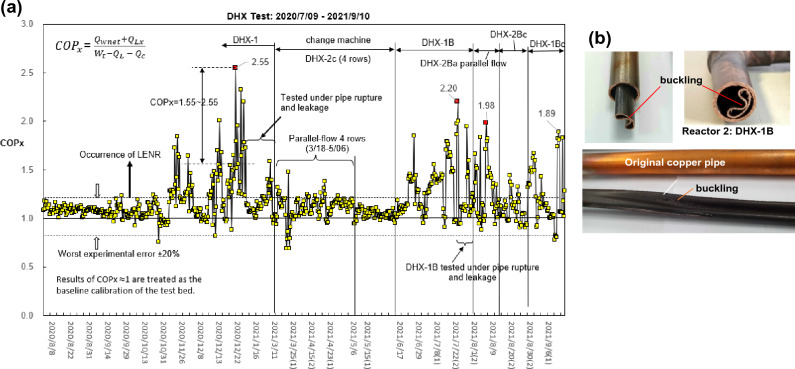
The second reactor (Reactor 2) is a double-pipe heat exchanger (DHX)11. The pulsed water flow is heated inside the DHX by hot steam from a boiler. Shown in Fig. 2a is the performance variation during the development11. The maximum COPx obtained was 2.55. Similar pipe rupture due to extreme high pressure (greater than 240 bar) takes place when COPx > 2.0. Possible nuclear transmutation in ruptured copper pipe was also observed, Fig. 2b. It was found that C increases 300%, O increases 700–800%, and Cl increases 63%.
Figure 2.
Test results of Reactor 2 (DHX). (a) Variation of reactor’s COPx during modifications [adding extended data of Ref.11]. (b) Pipe rupture in DHX-1B when COPx > 2.0 [from Ref.11].
Non-condensable gases found in new reactors and analyzed
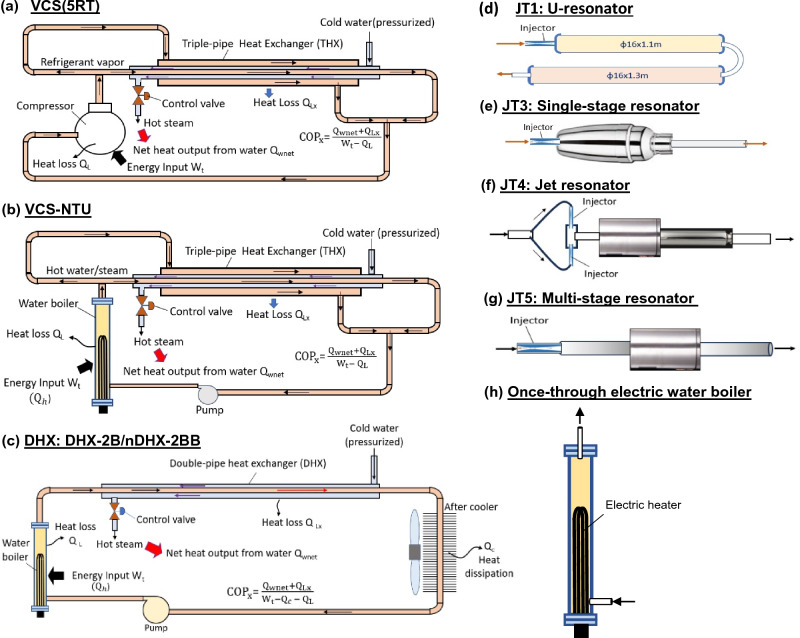
Recently, we continued to develop new reactors using thicker material and simpler structure for preventing rupture and easy scale-up. Figure 3 shows the schematic diagram of eight different new reactor designs. The new reactors are all heated by a compact once-through electric water boiler, Fig. 3h, except VCS(5RT) in which THX is heated by a hot freon vapor from compressor. The resonator-type reactors have a simple structure for easy scale-up and may create a fluid resonance to enhance the cavitation effect. The heat exchange process between two streams inside the THX or DHX does not appear in the resonator-type reactors.
Figure 3.
Reactors tested in the present study. (a) VCS(5RT): THX heated by freon from compressor; (b) VCS-NTU: THX heated by water boiler; (c) DHX: double-pipe heat exchanger heated by water boiler; (d) JT1: U-resonator; (e) JT3: single-stage resonator; (f) JT4: jet resonator; (g) JT5: multi-stage resonator; (h) once-through electric boiler to supply heat to reactors and act as a non-excess heat device. Reactors (d), (e), (f), (g) are connected to the water boiler (h) to run performance test.
The design of new reactors is briefly described as follows:
VCS(5RT): THX heated by 5 RT freon compressor and using stronger copper pipe.
VCS-NTU: THX heated by once-through water boiler and using stronger copper pipe.
DHX: same as Reactor 2 but having stronger copper pipe and with injector (nDHX).
JT1 (U-resonator): U-shape pipes with injector.
JT3 (Single-stage resonator): a single volume connected to injector.
JT4 (Jet-resonator): jet impinging by two opposite injectors connected to a resonator.
JT5 (Multi-stage resonator): multiple volumes connected in series.
We also developed a new test facility, Fig. 4a, which provides a maximum power input 10 kW to the boiler and supplies boiling water at maximum temperature 190 °C to the reactors. A RO equipment with 1000L storage tank is used to supply water.
Figure 4.
Test facility. (a) Performance test facility. (b) Gas collector and quadrupole mass spectrometer used.
Anomalous non-condensable gases were found during the test of the reactors. We designed a gas collecting unit to collect the output gas from the reactors for analysis. A mass spectrometer manufacturer (Mastek Co, Taiwan) and the experts team carried out the mass spectrometry. Two quadrupole mass spectrometers (model: Extorr XT200M and XT300M) were used interchangeably, as seen in Fig. 4b. The resolution of the mass spectrometer is better than 0.5 amu at 10% peak height and the minimum detectable partial pressure 5 × 10⁻¹⁴ Torr.
We collected gas samples from reactors running at steady state using the gas collector and then sent to manufacturer for spectrometry. The performance test was run at a steady state at least one hour to purge out the remaining impurities inside the reactor before collecting gas samples. The measuring of COPx and thermal performance is the same as in Ref.11.
Overall mass spectrum of sampled gases
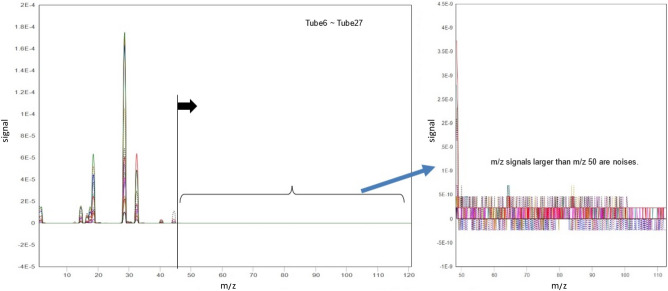
At the first batch, we collected 14 gas samples (named: Tube6-Tube27) from 8 reactors for mass spectrometry. It is very interesting that the overall mass spectrum of all the gas samples have no significant m/z signals at m/z higher than 50. This means that there are no high-mass compounds in the gas samples to produce interference on lower m/z signals. And all gas samples have similar mass spectrum except the signal intensity (Fig. 5). This makes the identification of gas content using mass spectrometry much easier.
Figure 5.
Overall mass spectrum of all the gas samples.
Identification of CO2 gas
Mass spectrometer (MS) was used to analyze 14 gas samples collected from 8 reactors, 10 samples having excess heat. Four gas samples (Tube9, 12, 17, 27) are from reactors without excess heat (COPx < 1.05, considering the most-probable experimental error11), including Tube9 directly from the boiler (no reactor) as the reference. Tube12 and Tube27 are from failure reactor. Tube17 gas was collected during the test bed calibration using the reactor VCS-NTU under the condition of no excess heat. Table 1 lists the identification tag (ID) of gas samples and reactors of the first batch.
Table 1.
Identification of CO2 presence using isotope ratio K44.
| Reactor ID | Tube6 | Tube7 | Tube8 | Tube9 (steam) | Tube10 | Tube12 failure product | Tube13 | Tube14 | Tube 16 | Tube17 baseline test | Tube 18 | Tube 23 | Tube 24 | Tube27 failure product |
|---|---|---|---|---|---|---|---|---|---|---|---|---|---|---|
| Gas source (Reactor) | VCS (5RT) | VCS (5RT) | VCS (5RT) | only boiler | VCS (5RT) | JT1-n3S | DHX-2B | JT4-BV | DHX-2B | VCS-NTU(c) | JT3-CV | nDHX-2B | VCS-NTU | JT5-A5 |
| m/z 44(gas) peak signal | 4.46E−07 | 3.605E−06 | 1.89E−06 | 1.68E−08 | 7.50E−08 | 2.00E−08 | 1.50E−07 | 7.15E−07 | 1.97E−07 | 1.19E−07 | 1.90E−07 | 3.34E−07 | 1.09E−05 | 1.90E−07 |
| m/z 44(air) peak signal | 2.77E−07 | 2.857E−07 | 2.70E−07 | 1.79E−08 | 4.00E−08 | 5.10E−08 | 6.00E−08 | 5.50E−08 | 1.10E−07 | 8.01E−08 | 1.10E−07 | 1.39E−07 | 1.39E−07 | 1.39E−07 |
| excess heat (COPx > 1.05) | Y | Y | Y | n | Y | n | Y | Y | Y | n | Y | Y | Y | n |
| Measured COPx | 1.53 | 1.61 | 1.61 | 1.0 | 1.51 | 1.02 | 1.17 | 1.10 | 1.20 | 1.02 | 1.05 | 1.20 | 1.57 | 1.03 |
| m/z 40(gas) peak signal | 2.60E−06 | 3.30E−06 | 2.41E−06 | 1.24E−07 | 3.49E−07 | 1.76E−07 | 5.89E−07 | 4.96E−07 | 8.73E−07 | 6.08E−07 | 2.85E−07 | 1.34E−06 | 1.39E−06 | 1.29E−06 |
| m/z 40(air) peak signal | 2.64E−06 | 2.57E−06 | 2.57E−06 | 1.36E−07 | 4.41E−07 | 4.40E−07 | 5.21E−07 | 4.89E−07 | 9.54E−07 | 1.34E−07 | 1.37E−07 | 1.26E−06 | 1.26E−06 | 1.26E−06 |
| I44(gas) = m/z 44(gas) ÷ m/z 40(gas) | 0.17 | 1.09 | 0.78 | 0.14 | 0.22 | 0.11 | 0.25 | 1.44 | 0.23 | 0.19 | 0.67 | 0.25 | 7.85 | 0.15 |
| I44(air) = m/z 44(air) ÷ m/z 40(air) | 0.10 | 0.11 | 0.10 | 0.13 | 0.09 | 0.12 | 0.12 | 0.11 | 0.12 | 0.13 | 0.12 | 0.11 | 0.11 | 0.11 |
| Internal standard ratio: K44 = I44(gas)/I44(air) | 1.63 | 9.84 | 7.47 | 1.03 | 2.37 | 0.98 | 2.21 | 12.8 | 1.96 | 1.46 | 5.56 | 2.26 | 71.0 | 1.33 |
| K44 > 1.5 (presence of CO2) | Y | Y | Y | n | Y | n | Y | Y | Y | n | Y | Y | Y | n |
Significant values are in bold.
Two methods were employed to identify the presence of CO2 in gas samples. First, using the isotope ratio K44 defined with respect to the background air and internal standard based on m/z 40, we can identify the presence of CO2. The definition of K44 is K44 = I44(gas)/I44(air), where I44(gas) = m/z 44(gas) ÷ m/z 40(gas); and I44(air) = m/z 44(air) ÷ m/z 40(air).
It is very interesting to note from Table 1 that K44 are all lower than 1.50 for gas samples from reactors without excess heat (COPx < 1.05). The high isotope ratio K44 (maximum 71.0 or > 5 mostly) in gases from reactors having excess heat strongly suggests the significant presence of CO2.
Another method to identify the CO2 existence in gas samples is to measure m/z 44 signal reduction of gas samples which has passed through a CO2 absorber Ca(OH)2 before entering the mass spectrometer. Pure CO2 gas, ambient air and MS blank were used as the reference. The rate of m/z 44 signal reduction, Ab44, for gas with (denoted as “Y”) and without (denoted as “n”) CO2 absorption is defined as: Ab44 = m/z 44(Y) ÷ m/z 44(n), and the reduction of CO2 (rd) is (1-Ab44)100%.
Each Ab44 is measured using the identical gas sample in a gas collector. It is seen from Table 2 that Ab44 of all the gases from reactors having excess heat is lower than 1.0 or m/z 44 signal reduction is between 36 and 80%. This is the direct proof of CO2 presence in gases from reactors having excess heat.
Table 2.
Identification of CO2 presence from the reduction of m/z 44 signal caused by CO2 absorption.
| Gas sample | Reactor | COPx | CO2 absorption by Ca(OH)2 | m/z 44 | Ab44 = m/z 44(Y) ÷ m/z 44(n) | Reduction ofm/z 44, rd = (1 − Ab44) |
|---|---|---|---|---|---|---|
| Pure CO2 | Reference gas | 1.0 (No excess heat) | n | 4.62E−04 | 0.019 (< 1) | 92% |
| Y | 8.93E−06 | |||||
| Atmosphere air | Reference gas | 1.0 (No excess heat) | n | 1.87E−06 | 1.14 | n |
| Y | 2.14E−06 | |||||
| MS blank | Reference gas | 1.0 (No excess heat) | n | 8.09E−06 | 0.98 (≈ 1.0) | n |
| Y | 7.96E−06 | |||||
| Tube16 | DHX-2B | 1.20 | n | 1.99E−07 | 0.37 (< 1) | 63% |
| Y | 7.47E−08 | |||||
| Tube39 | VCS-NTU | 1.54 | n | 4.42E−06 | 0.74 (< 1) | 36% |
| Y | 3.28E−06 | |||||
| Tube40 | VCS-NTU | 1.21 | n | 6.70E−06 | 0.52 (< 1) | 48% |
| Y | 3.51E−06 | |||||
| Tube42 | nDHX-2BB | 1.22 | n | 1.68E−05 | 0.20 (< 1) | 80% |
| Y | 3.40E−06 | |||||
| Tube44 | nDHX-2BB | 1.16 | n | 9.98E−06 | 0.46 (< 1) | 54% |
| Y | 4.62E−06 | |||||
| Tube46 | nDHX-2BB | 1.15 | n | 5.52E−06 | 0.58 (< 1) | 42% |
| Y | 3.20E−06 |
Identification of Neon gas 21Ne and 20Ne
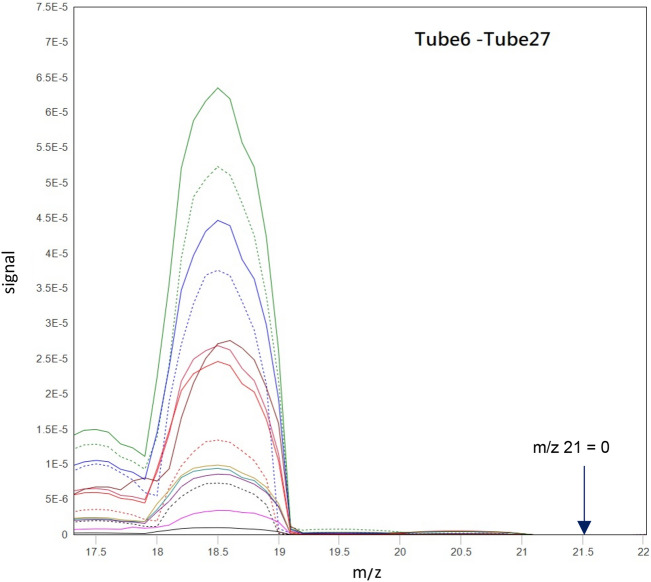
Bob Greenyer suggested that Ne (20Ne, 21Ne, or 22Ne) may be produced if excess heat takes place12. First, we checked the possibility of 21Ne presence from the m/z 21 signal. It is seen from the mass spectrum of all gas samples shown in Fig. 6 that, no m/z 21 signal is present and hence 21Ne does not exist.
Figure 6.
Mass spectrum of gas samples from m/z 17 to m/z 22 showing no m/z 21 signal at all.
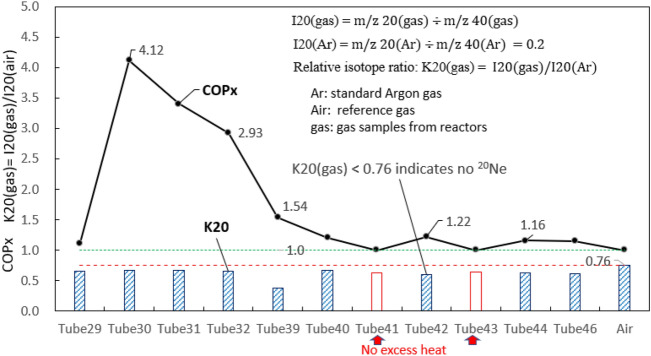
Since m/z 20 signal can be generated from natural abundance of Argon gas (m/z 40), the relative isotope ratio K20 (based on internal standard using m/z 40) is used to identify the presence of 20Ne by comparing with the background air. The definition of isotope ratio K20 is K20(gas) = I20(gas)/I20(Ar) where I20(gas) = m/z 20(gas) ÷ m/z 40(gas); I20(Ar) = m/z 20(Ar) ÷ m/z 40(Ar).
Pure Argon gas is used as the calibration gas whose K20(air) = 0.76. If K20(gas) < K20(air) = 0.76, it reveals that no 20Ne exists in gas sample. It is seen from Fig. 7 that K20 for all gas samples are smaller than 0.76. This confirms that no 20Ne is present in all gas samples, regardless of excess heat occurrence.
Figure 7.
Variation of K20 for gas from different reactors. K20 < 0.76 indicates no 20Ne presence.
Identification of Neon gas 22Ne
The presence of 22Ne in gases from reactors having excess heat were verified using three methods:
From isotope ratio K22 based on internal standard m/z 40.
From mathematics based on the observation of parameter G > 1 in gases from reactors having excess heat.
From isotope-ratio K24a and using CO2 absorber.
Proof of 22Ne presence from isotope ratio K22 based on internal standard m/z 40
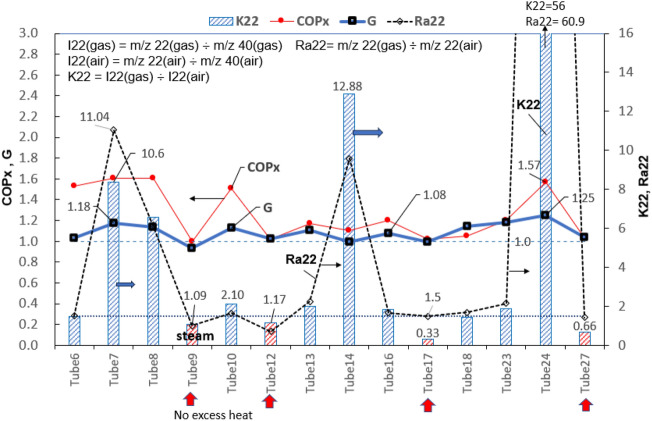
The m/z 22 signal is generated from 22Ne gas and CO2++ made by CO2 ionization in MS, while CO2 is the product of reactors having excess heat as described previously. The isotope ratio K22 is defined based on the internal standard m/z 40 as: K22 = I22(gas)/I22(air), where I22(gas) = m/z 22(gas) ÷ m/z 40(gas) and I22(air) = m/z 22(air) ÷ m/z 40(air).
Since the interference of CO2++ on m/z 22 signal is not very high, less than 2% of m/z 44 signal for pure CO213, the isotope ratio K22 > 1.5 is beyond CO2++ interference in all gases from reactors having excess heat. The results shown in Fig. 8 suggests that m/z 22 signal contains those generated from 22Ne. Very high K22 (mostly higher than 2.0, highest 56.0) confirms that 22Ne is present in gases from reactors having excess heat.
Figure 8.
Variation of K22 for gas from different reactors. K22 > 1.5 indicates 22Ne presence.
Proof of 22Ne presence from mathematics based on the observation of G > 1 in gases having excess heat
We found an interesting parameter G defined as G = R42(gas)/R42(air) where R42 = m/z 44 ÷ m/z 22, which is always greater than 1.0 in gases from reactors having excess heat (COPx > 1.05). G can be determined from the measurement of m/z 22 and m/z 44 of gas and background air using the definition.
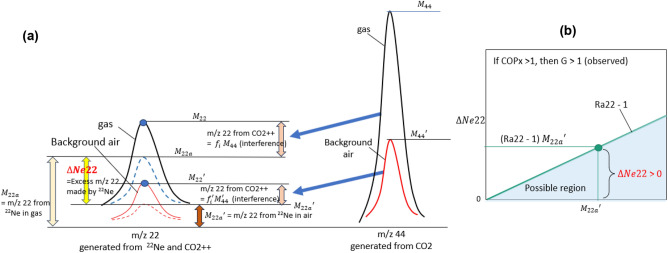
Since the m/z 22 signal is generated from 22Ne and CO2++ (ionization of CO2 in MS), the measured m/z 22 signal is the sum of those from 22Ne and those from CO2++ for gas sample and background air, which can be written as
| 1 |
where M22 : measured m/z 22 signal of gas, M22a : m/z 22 signal contributed from 22Ne, M44 : measured m/z 44 signal of gas, fi: ionization factor of MS, M22′ : measured m/z 22 signal of background air, M22a′ : m/z 22 signal of background air contributed from 22Ne, M44′ : measured m/z 44 signal of background air. We can define the excess m/z 22 signal made by 22Ne in gas sample as, referring to Fig. 9a,
| 2 |
Figure 9.
Graphical expression of . (a) Relation between m/z 22 and m/z 44. (b) The real is between 0 and for Ra22 > 1.
Combining Eqs. (1) and (2), and the observation of G > 1 in gases from reactors having excess heat, we obtain the following relation:
| 3 |
where Ra22 = m/z 22 (gas) ÷ m/z 22(air). From Eq. (3), we obtain M22a < M22a′ Ra22 and the following relations:
| 4 |
We finally obtain a relation for excess m/z 22 signal made by excess 22Ne in gas sample:
| 5 |
Since Ra22 is experimentally found to lie between 1.5 and 60.9 for gases from reactors having excess heat as shown in Fig. 8, > 0 always and is shown greater than zero. This proves the presence of 22Ne in gases from reactors having excess heat. The real lies between 0 and as shown in Fig. 9b.
Proof of 22Ne presence from isotope-ratio K24a and using CO2absorber
If CO2 in gas sample is absorbed first by Ca(OH)2 before entering MS, m/z 22 signal interference from CO2++ can be eliminated. 22Ne can be identified using the isotope ratio K24a defined as the ratio of R24 with (denoted as “Y”) and without (denoted as “n”) CO2 absorption: K24a = R24(Y)/R24(n) where R24(gas) = m/z 22(gas) ÷ m/z 44(gas).
For pure CO2 gas, the measured K24a(CO2) = 0.96. We can then identify the presence of 22Ne simply from K24a > 0.96. It is seen from Table 3 that K24a are greater than 0.96 (maximum 1.49) in all the gases from reactors having excess heat. This confirms the presence of 22Ne in gases from reactors having excess heat.
Table 3.
Using isotope ratios K24a and K22a to identify the presence of 22Ne.
| Internal standard method (ISM) based on m/z 40 | |||||||||||
|---|---|---|---|---|---|---|---|---|---|---|---|
| Gas sample | Reactor | COPx | CO2 absorption | m/z 22 | m/z 40 | m/z 44 | R24 = m/z 22 ÷ m/z 44 | K24a = R24(Y)/R24(n) | I22 = ratio 22/40 | I44 = ratio 44/40 | K22a = I22(Y)/I22(n) |
| Pure CO2 | Reference gas | 1.0 (no excess heat) | n | 4.44E−06 | 4.20E−07 | 4.62E−04 | 9.61E−03 | 0.96 | 10.6 | 1100.0 | 0.0060 |
| Y | 8.26E−08 | 1.31E−06 | 8.93E−06 | 9.25E−03 | 0.0631 | 6.817 | |||||
| Tube16 | DHX-2B | 1.20 | n | 2.33E−09 | 8.73E−07 | 1.99E−07 | 1.17E−02 | 1.07 | 0.0027 | 0.228 | 0.55 |
| Y | 9.33E−10 | 6.37E−07 | 7.47E−08 | 1.25E−02 | 0.0015 | 0.117 | |||||
| Tube39 | VCS-NTU | 1.54 | n | 2.94E−08 | 1.63E−05 | 4.42E−06 | 6.65E−03 | 1.49 | 0.0018 | 0.271 | 1.86 |
| Y | 4.93E−08 | 9.35E−06 | 4.97E−06 | 9.92E−03 | 0.0053 | 0.532 | |||||
| Tube42 | nDHX-2BB | 1.22 | n | 1.55E−07 | 9.78E−06 | 1.68E−05 | 9.21E−03 | 1.03 | 0.0158 | 1.717 | 0.21 |
| Y | 3.23E−08 | 9.92E−06 | 3.40E−06 | 9.49E−03 | 0.0033 | 0.343 | |||||
| Tube44 | nDHX-2BB | 1.16 | n | 7.75E−08 | 1.19E−05 | 9.98E−06 | 7.77E−03 | 1.14 | 0.0065 | 0.839 | 0.48 |
| Y | 4.10E−08 | 1.30E−05 | 4.62E−06 | 8.87E−03 | 0.0032 | 0.355 | |||||
| Tube46 | nDHX-2BB | 1.15 | n | 4.87E−08 | 1.02E−05 | 5.52E−06 | 8.82E−03 | 1.10 | 0.0048 | 0.541 | 0.65 |
| Y | 3.10E−08 | 9.93E−06 | 3.20E−06 | 9.69E−03 | 0.0031 | 0.322 | |||||
| K24a > 0.96 reveals 22Ne presence | K22a >> 0.006 reveals 22Ne presence | ||||||||||
Significant values are in bold.
We can also use another isotope ratio K22a defined as the ratio of I22 with (Y) to without (n) CO2 absorption: K22a = I22(Y)/I22(n) where I22 = m/z 22(gas) ÷ m/z 40(gas). The results in Table 3 shows that K22a in all gases is much larger than the pure CO2 reference (0.0060). This confirms the presence of 22Ne.
Discussions
In the present study, we have verified using mass spectrometry that 22Ne and CO2 are produced in water when COPx > 1.05 (having excess heat). The question remaining is how 22Ne and CO2 is produced. Since this is an unsettled area of science, we can only conjecture some possibilities based on the observed phenomena in various reactors. To find the pathway to 22Ne gas production, various possible nuclear reactions could be assumed. In our judgement however, the reaction starts with an interaction between 1H and 16O, producing 17O14,15. Two possible reactions for are proposed as follows:
| 6 |
| 7 |
where represents a proton (p), is the ultra-low energy anti-neutrino which can be produced from water cavitation16. The ‘black box’ in Eqs. (6) and (7) represents an unknown in detail mechanism15. The reaction of and then produces 22Ne and 12C14,15:
| 8 |
This is what we have detected, 22Ne in gases from reactors having excess heat.
Since 12C cannot exist in monoatomic form, it is converted into CO2 through chemical reaction with 16O atoms from water, as follows:
| 9 |
This is what we have detected, CO2 in gases from reactors having excess heat.
The difference between Eqs. (6) and (7) is the involvement of neutrino and anti-neutrino . In Eq. (6), acts over a wide area to allow the 4-particle reaction with . That is, the low-energy anti-neutrino is the cause of increased probability of the 4-particle reaction. In Eq. (7), is the product of the 3-particle reaction which may have high energy. Since Eq. (7) involves only three-particles merging, it might be more likely to take place from the point of view of the particle collision probability if there is some way to force these particles into a confined zone.
The reaction Eq. (6) is exothermic and emits no radiation. A Geiger–Müller counter (JD-3001) monitoring radiation near the reactors during test, never showed a significant emission level above background, measured at 0.4 μSv/h maximum which is about two times of background or 0.4% occurrence. This seems favor the reaction Eq. (6).
In Ref.15, it is proposed from nuclear physics that neutrinos and anti-neutrino pair at low energies can be formed during inelastic collisions of particles (electrons, ions, neutral atoms) during their thermal motion. Temperatures known to be produced in cavitation processes may exceed the calculated threshold in Ref.15 for low energy neutrino and anti-neutrino pair production. The question then arises as to how the 4 particles ( in Eq. (6) can merge simultaneously. However due to the large de Broglie wavelength of low energy neutrinos, they could probably interact over an area big enough to include all the particles necessary for reaction Eq. (6) to take place.
Since the mechanism of nuclear reactions is not the focus of our research, we can only put forward intuitive and vague speculations with respect to our experimental observations. The present conjecture, reaction (6) or (7), is just two possibilities.
Another question raised is that “are there extra 17O and 12C to produce other compounds ?” Both 17O and 12C does not exist in monoatomic form. They will form compounds with other elements. This means that 12C and isotope 17O may be the intermediate.
Nuclear transmutation in ruptured copper pipe with large increases of C and O contents is one of the possible outcomes and has been observed in SEM/EDS11. Besides this, we found that three isotopes may be the outcomes: H2O-17(heavy-oxygen water), isotope O2 (16O–17O), and isotope CO2 (12C–16O–17O). This can be identified from isotope ratio analyses in m/z 19, 33 and 45 signals.
Finding of H2O-17 (heavy-oxygen water)
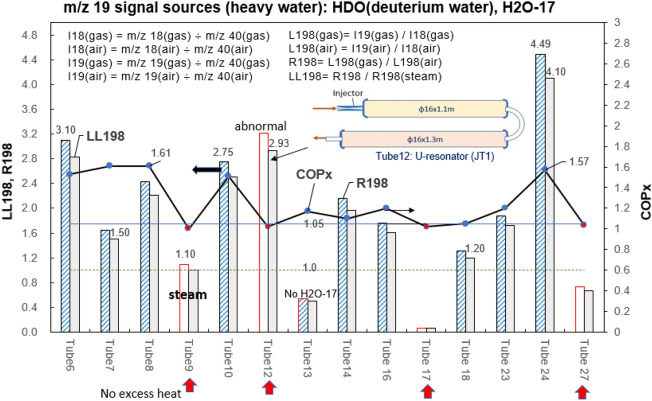
The isotope ratio R198 using internal standard m/z 40 is defined as R198 = L198(gas)/L198(air) where L198(gas) = I19(gas)/I18(gas), L198(air) = I19(air)/I18(air), and I18(gas) = m/z 18(gas) ÷ m/z 40(gas), I18(air) = m/z 18(air) ÷ m/z 40(air); I19(gas) = m/z 19(gas) ÷ m/z 40(gas), I19(air) = m/z 19(air) ÷ m/z 40(air).
The m/z 19 signal may be generated from HDO (deuterium water) and isotope H2O-17. Since steam (Tube9) has highest content of HDO (deuterium water), the measured R198(steam) = 1.10 is the maximum contribution of HDO to m/z 19. This is used to distinguish H2O-17 from HDO.
LL198 is further defined as LL198 = R198/R198(steam) to provide a criterion to identify the presence of H2O-17 when LL198 > 1.0. It is seen from Fig. 10 that LL198 >> 1 appearing in 9 out of 10 gases from reactors having excess heat. This strongly suggests significant contribution to m/z 19 from H2O-17, other than HDO. The presence of heavy-oxygen water H2O-17 is thus confirmed.
Figure 10.
Variation of R198 and LL198 for gas from different reactors. Using isotope ratios R198 and LL198 to distinguish H2O-17 from HDO.
Tube12 gas contains no 22Ne and CO2 (implying no excess heat), but produces isotope H2O-17 as seen from Fig. 10. Tube12 gas was collected from U-resonator (JT1) without excess heat (COPx < 1.05). However, we found that the reactor showed abnormal temperature variations. It involves some other peculiar phenomena and needs further studies.
Finding of isotope O2 (16O–17O)
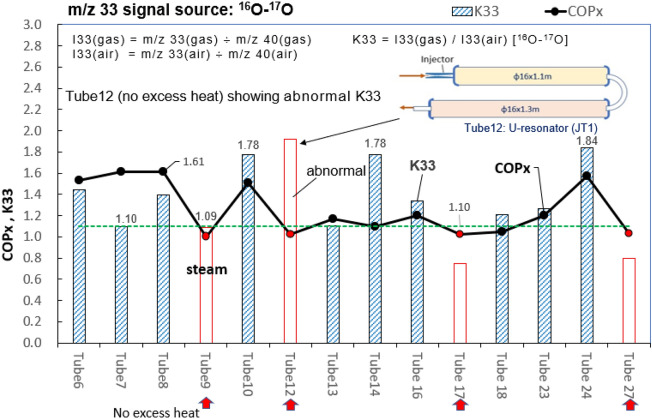
To trace isotope O2 (16O-17O), we define the isotope ratio K33 using internal standard m/z 40 as: K33 = I33(gas) / I33(air) where I33(gas) = m/z 33(gas) ÷ m/z 40(gas); I33(air) = m/z 33(air) ÷ m/z 40(air). It is seen from Fig. 11, K33 > 1.1 in all gases from reactors having excess heat. This strongly suggests the presence of isotope O2 (16O-17O). Again, Tube12 contains no 22Ne and CO2 gas but isotope O2 (16O-17O) is present as seen from Fig. 11. This implies that some other peculiar phenomena may take place in U-resonator (JT1) and is worth for further investigations.
Figure 11.
Variation of K33 for gas from different reactors. Using isotope ratio K33 to identify isotope O2 (16O–17O).
Finding of isotope O2 (16O–17O)
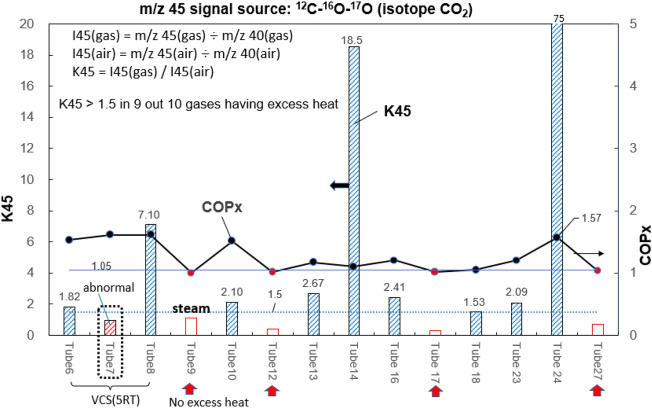
To trace isotope CO2 (12C-16O-17O), we define the isotope ratio K45 using internal standard m/z 40: K45 = I45(gas)/I45(air) where I45(gas) = m/z 45(gas) ÷ m/z 40(gas); I45(air) = m/z 45(air) ÷ m/z 40(air). It is seen from Fig. 12, K45 > 1.5 takes place in gases from reactors having excess heat. High value of K45 (2.1–75) strongly suggests the presence of isotope CO2 (12C–16O–17O).
Figure 12.
Variation of K45 for gas from different reactors. Using isotope ratio K45 to identify isotope CO2 (12C–16O–17O).
Conditions for presence of isotopes H2O-17 (heavy-oxygen water), CO2(12C–16 O–17O), O216O–17O)
The presence of isotopes O2 and CO2 relies on the extra quantities of 12C and 17O resulting from the main nuclear reactions. Sometimes they may not appear due to no extra 12C or 17O. Tube7 in Fig. 6 may be the case. Nevertheless, the above results cannot deny the possible presence of isotopes O2, CO2 and H2O-17 (heavy-oxygen water) in gases from reactors having excess heat.
Finally, it should be noted that the reactors tested in the present study were under early developing stage. Although their performance has not been optimized yet, the anomalous gas produced from reactors having excess heat is always present. The reactor is still being optimized to improve the performance. A higher concentration of non-condensable gases may be expected. This will make the MS analysis easier.
Conclusion
Cavitation may induce implosion of water vapor bubbles using various techniques1–10. In the previous study, we found that the heat exchange process in multiple-pipe heat exchanger produces anomalous excess heat and nuclear transmutation11. Recently, we have tested another 8 reactors and found that they also produce non-condensable gas. We suspected that 22Ne and CO2 may exist and is from nuclear reactions of water.
Fourteen gas samples were collected from eight reactors to perform mass spectrometry carefully using various methods. Two different methods for the identification of CO2 were employed, while three different methods are employed for 22Ne. All the results confirm that 22Ne and CO2 do exist in gas samples from reactors having excess heat.
In answering the question “how 22Ne and CO2 is produced in water”, we conjecture a possible mechanism and find out that 12C and isotope 17O may be the intermediate. They possibly produce some other isotope compounds in gas from reactors having excess heat. Using isotope ratio analysis, we find out that they are H2O-17 (heavy-oxygen water), isotope O2 (16O–17O), and isotope CO2 (12C–16O–17O).
We also find that the reactions Eqs. (6)–(8) are the most-probable reactions whose output gas contents coincide with our observations—detected CO2 and isotopes 22Ne, H2O-17, CO2 (12C–16O–17O) and O2 (16O–17O), although the detailed mechanism is not known. This needs further basic research. Since the chances of getting all the present conclusion is so remote, particularly the presence of 22Ne without 20Ne or 21Ne, this work may lead to a new research topic in nuclear science and energy technology if true.
Acknowledgements
This research was started about 10 years ago and supported by many people and organizations, including Ministry of Science and Technology (Taiwan), Joint Solar Energy Research Center of National Taiwan University and King Abdullah University of Science and Technology (KAUST), Saudi Arabia, Soundair Industrial Co., SunTech Solar Co., KongLin Group (Taiwan), Academia Sinica (Taiwan). Special thanks to all of them. We also appreciate many of whom, including the reviewers of Scientific Reports, provide valuable opinions to make this research go to a right direction.
Author contributions
B.J. supervised this research, organized the collaboration, carried out MS data analysis, summarized conclusions and wrote the manuscript. Y.H., P.H. and J.F. designed, built, and tested DHX and resonator-type reactors. M.L. and Y.H. designed, built, and tested VCS reactors. L.T. built the test system. C.K. carried out Neon gas detection. I.F. assisted in test system integration. C.H. helped LENR literature survey. T.R., F.W., and T.F. carried out MS experiment and analysis. K.C. carried out CIMS analysis. Y.T. assisted in reactor analysis. M.Y., L. and S.L. built a test bed and carried out design analysis of resonator reactors. R.W. supervised physical reaction mechanism and assisted the manuscript writing.
Data availability
All data generated or analyzed during this study are included in this published article and are available from the corresponding author on reasonable request.
Competing interests
The authors declare no competing interests.
Footnotes
Publisher's note
Springer Nature remains neutral with regard to jurisdictional claims in published maps and institutional affiliations.
References
- 1.Freire LO, de Andrade DA. Preliminary survey on cold fusion: It’s not pathological science and may require revision of nuclear theory. J. Electroanal. Chem. 2021;903:115871. doi: 10.1016/j.jelechem.2021.115871. [DOI] [Google Scholar]
- 2.Kladov, A. F. Method of obtaining energy. Russian Federation Patent No. 2054604 (1996).
- 3.Kladov, A. F. Cavitation destruction of matter. 1997–2002. http://roslo.narod.ru/rao/rao1.htm. Rough machine assisted translation by Bob Greenyer and Vladimir Balakirev, Valery Krymsky. A breakthrough in solving the problem of liquid radioactive waste. REGNUM, 11 April 2019. https://regnum.ru/article/2609964M
- 4.Kanarev, P. M. Energy balance of fusion processes of molecules of oxygen, hydrogen and water. Published 30.06.2003. http://guns.connect.fi/innoplaza/energy/story/Kanarev/water/index.html
- 5.Taleyarkhan R, West C, Cho J, Lahey R, Nigmatulin R, Block R. Evidence for nuclear emissions during acoustic cavitation. Science. 2002;295(5561):1868–1873. doi: 10.1126/science.1067589. [DOI] [PubMed] [Google Scholar]
- 6.Taleyarkhan R, Cho J, West J, Lahey R, Nigmatulin R, Block R. Additional evidence of nuclear emissions during acoustic cavitation. Phys. Rev. E. 2004;69(3):036109. doi: 10.1103/PhysRevE.69.036109. [DOI] [PubMed] [Google Scholar]
- 7.Geller S. Vortex liquid heaters. New Energy Technol. 2005;3(22):29–39. [Google Scholar]
- 8.Fomitchev-Zamilov MI. Cavitation-induced fusion: Proof of concept. Nat. Philos. Alliance. 2012;9:1–14. [Google Scholar]
- 9.Nigmatulin RI, Lahey RT, Taleyarkhan RP, Jr, West CD, Block RC. On thermonuclear processes in cavitation bubbles. Physics-Uspekhi. 2014;57(9):877–890. doi: 10.3367/UFNe.0184.201409b.0947. [DOI] [Google Scholar]
- 10.LeClair, M. L. Discovery of macro cationic crystalline H2O cavitation re-entrant jets & their role in cavitation zero point energy, fusion & the origin of life. In The Seventh Annual Conference on the Physics, Chemistry & Biology of Water, October 18–21 (2012). NanoSpire_LeClair.pdf—Google.
- 11.Huang BJ, Tso ML, Liu YH, Yeh JF, Wu LT, Chen IF, Pan YH, Huang CK, Liao MY, Chen YC, Wu PH. Excess energy from heat-exchange systems. J. Condens. Matter Nucl. Sci. 2022;36:247–265. doi: 10.0929/2023805843. [DOI] [Google Scholar]
- 12.Greenyer, R. W. A proposed explanation for Bin–Juine Huang’s cavitation driven excess heat system. Potential Hydrogen and Oxygen interactions during cavitation. 14 June 2021. https://youtu.be/UH76XaTz4qE
- 13.NIST Chemistry WebBook. NIST Standard Reference Database Number 69. Last update: 2023 10.18434/T4D303
- 14.Greenyer, R. W. & P.W. Power P.W. The Nanosoft Package. December 2021. https://www.nanosoft.co.nz/TheNanosoftPackage.pdf
- 15.Parkhomov AG. Multeity of nuclides arising in the process of cold nuclear transmutations. Int. J. Unconv. Sci. E. 2017;2:20–22. [Google Scholar]
- 16.Filho J, Assis M, Genovez A. Bacterial inactivation in artificially and naturally contaminated water using a cavitating jet apparatus. J. Hydro-Environ. Res. 2015;9:259–267. doi: 10.1016/j.jher.2015.03.001s. [DOI] [Google Scholar]
Associated Data
This section collects any data citations, data availability statements, or supplementary materials included in this article.
Data Availability Statement
All data generated or analyzed during this study are included in this published article and are available from the corresponding author on reasonable request.


