

Abstract
Objective
This work was designed to study 2,4-disubstituted 6-fluoroquinolines as antiplasmodial agents by using in silico techniques, to aid in the design of novel analogs with high potency against malaria and high inhibition of Plasmodium falciparum translation elongation factor 2 (PfeEF2), a novel drug target.
Methods
Quantitative structure-activity relationships (QSAR) of 2,4-disubstituted 6-fluoroquinolines were studied with the genetic function approximation technique in Material Studio software. The 3D structure of PfeEF2 was modeled in the SWISS-MODEL workspace through homology modeling. A molecular docking study of the modeled PfeEF2 and 2,4-disubstituted 6-fluoroquinolines was conducted with Autodock Vina in Pyrx software. Furthermore, the in silico pharmacokinetic properties of selected compounds were investigated.
Results
A robust, reliable and predictive QSAR model was developed that related the chemical structures of 2,4-disubstituted 6-fluoroquinolines to their antiplasmodium activities. The model had an internal squared correlation coefficient R2 of 0.921, adjusted squared correlation coefficient R2adj of 0.878, leave-one-out cross-validation coefficient Q2cv of 0.801 and predictive squared correlation coefficient R2pred of 0.901. The antiplasmodium activity of 6-fluoroquinolines was found to depend on the n5Ring, GGI9, TDB7u, TDB8u and RDF75i physicochemical properties: n5Ring, TDB8u and RDF75i were positively associated, whereas GGI9 and TDB7u were negatively associated, with the antiplasmodium activity of the compounds. Stable complexes formed between the compounds and modeled PfeEF2, with binding affinity ranging from −8.200 to −10.700 kcal/mol. Compounds 5, 11, 16, 22 and 24 had better binding affinities than quinoline-4-carboxamide (DDD107498), as well as good pharmacokinetic properties, and therefore may be better inhibitors of this novel target.
Conclusion
QSAR and docking studies provided insight into designing novel 2,4-disubstituted 6-fluoroquinolines with high antiplasmodial activity and good structural properties for inhibiting a novel antimalarial drug target.
Keywords: 6-fluoroquinolines, Antimalaria, Homology modeling, Molecular docking, QSAR, Translation elongation factor 2
الملخص
أهداف البحث
تم تصميم هذا العمل لدراسة 4،2-مزدوج الاستبدال 6-فلوروكينولين كعوامل مضادة للبلازموديات تستخدم في تقنيات السيليكو بهدف الكشف عن المعلومات التي يمكن استخدامها لتصميم نظائر جديدة ذات فاعلية عالية كمضاد للملاريا وقدرة تثبيط عالية تجاه عامل تطويل الترجمة2 لـ المتصورة المنجلية، هدف دوائي جديد.
طريقة البحث
تمت دراسة العلاقة الكمية بين البنية والنشاط لـ 4،2-مزدوج الاستبدال 6-فلوروكينولين باستخدام تقنية تقريب الوظيفة الجينية في برنامج استديو الأدوات. تم تصميم البنية ثلاثية الأبعاد لـ عامل تطويل الترجمة2 لـ المتصورة المنجلية من مساحة عمل النموذج السويسري استنادا إلى تقنية النمذجة المتماثلة. أجريت دراسة الالتحام الجزيئي ل عامل تطويل الترجمة2 النموذجي 4،2-مزدوج الاستبدال 6-فلوروكينولين غير المستبدل باستخدام "أوتودوك فينا" في برنامج "بايركس". علاوة على ذلك، تم دراسة الخصائص الدوائية لبعض المركبات المختارة في السيليكو.
النتائج
طور هذا البحث نموذجا قويا وموثوقا وتنبؤيا للعلاقة بين البنية والنشاط الكمي الذي يربط التركيبات الكيميائية لـ 4،2-مزدوج الاستبدال 6-فلوروكينولين مع أنشطتها المضادة للبلازموديوم. يحتوي النموذج على معامل الارتباط التربيعي الداخلي، "آر2" بقيمة 0.921، ومعامل الارتباط المربع المعدل، "آر2أدج" بقيمة 0.878، ومعامل التحقق من صحة الإجازة الواحدة، "كيو2سي في" بقيمة 0.801 ومعامل الارتباط التربيعي التنبؤي، "آر2بريد" بقيمة 0.901. يوضح أن الأنشطة المضادة للبلازموديوم لـ 6-فلوروكينولين تعتمد على الخواص الفيزيائية والكيميائية لـ "حلقة5ان"، "جي جي آي 9"، "تي دي بي 7 يو"، "تي دي بي 8 يو"، "آر دي اف 75 آي" مساهمة إيجابية بينما يكون لـ "جي جي آي 9" و "تي دي بي 7 يو" مساهمة سلبية في الأنشطة المضادة للبلازموديوم للمركبات. تم تشكيل مجمعات مستقرة بين المركبات ونموذج عامل تطويل الترجمة2 لـ المتصورة المنجلية مع تقارب ربط يتراوح من -8.200 إلى -10.700 كيلو كالوري/مول. يحتوي المركب 5 و11 و16 و22 و24 على ارتباطات ربط أفضل من الكينولين-4-كربوكساميد ويظهر خصائص حركية دوائية جيدة، وبالتالي يمكن أن يكون مثبطا أفضل لهذا الهدف الجديد.
الاستنتاجات: يمكن للمعلومات التي كشفت عنها العلاقة الكمية بين البنية والنشاط ودراسات الالتحام للمركبات أن تعطي نظرة ثاقبة لطريقة تصميم 4،2-مزدوج الاستبدال 6-فلوروكينولين مع أنشطة مضادة للبلازموديات عالية وخصائص هيكلية جيدة لتثبيط هدف الدواء المضاد للملاريا الجديد.
الكلمات المفتاحية: 6- الفلوروكينولين, مكافحة الملاريا, نمذجة التماثل, الالتحام الجزيئي, العلاقة الكمية بين الهيكل والنشاط, عامل تطويل الترجمة2
Introduction
Malaria poses a great danger to public health. This disease is caused by the Plasmodium parasite, which is transmitted between humans by female Anopheles mosquitoes. Five species of the parasite are pathogenic to humans, among which Plasmodium falciparum and Plasmodium vivax are the most threatening.1,2 Malaria caused an estimated 619,000 deaths in 2021, of which 76% (∼470,000) were in children younger than 5 years,3 amounting to a child dying from the disease nearly every minute. The highest malaria burden is in sub-Saharan Africa, which had an estimated 234 million cases and 593,000 deaths in 2021. Nigeria has 26.6% and 31.3% of the global malaria cases and deaths, respectively.3 Prevention of malaria through vector control is challenging, because of increasing mosquito resistance to the most commonly used insecticides (pyrethroids) in insecticide-treated nets, and increasing spread of an urban-adapted mosquito species (Anopheles stephensi).3
Treatment through chemotherapy is challenging because of rising resistance to many antimalarial drugs and artemisinin-based combination therapy, a recommended therapy for P. falciparum (the most deadly parasite).3 Therefore, new potent antiplasmodial drugs with novel mechanisms of action must be developed.4 Quinoline-4-carboxamide (DDD107498) was discovered as a potent antimalarial compound active against multiple life-cycle stages of the parasite. The molecular target of this compound is translation elongation factor 2 (eEF2). However, the interaction of DDD107498 with the target (PfeEF2) is not well understood.4 Hochegger et al. (2019) synthesized new analogs of quinoline-4-carboxamide to improve the antiplasmodial activity (in vitro and in vivo) and to understand the structure-activity-relationships of these analogs.4 In silico techniques are computer-aided modeling methods used in screening chemical databases to identify novel drug candidate.5 This work was aimed at conducting a quantitative structure-activity relationships (QSAR) study of quinoline-4-carboxamide analogs (6-fluoroquinolines) to build a model relating the antiplasmodium activity to the physicochemical properties of 6-fluoroquinolines, to increase understanding of the structure-activity-relationships of the compounds. We additionally performed a molecular docking study of 6-fluoroquinolines with homology modeled P. falciparum translation elongation factor 2 (PfeEF2) as the molecular target, to understand the modes of interaction of the compounds with the potential target. This information may be used to design better inhibitors of the novel target as antimalarial drug candidates.
Materials and Methods
Data collection
A dataset of 28 compounds of 6-fluoroquinoline derivatives and their in vitro activities against the chloroquine-sensitive strain NF54 of P. falciparum was obtained from the literature.4 The antiplasmodial activities of the 6-fluoroquinolines were obtained as IC50 (nM) and converted to pIC50 {−logIC50 (M)} to normalize the distribution of the values for QSAR building.5 The structures and names of the 6-fluoroquinolines and their respective activities (pIC50) are presented in Table 1.
Table 1.
Antiplasmodial activity and leverage of the 6-fluoroquinolines.
| C/N | Compound | Experimental pIC50 | Theoretical pIC50 | Residual | Leverage |
|---|---|---|---|---|---|
| 1a | 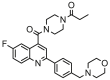 |
5.132 | 5.403 | −0.271 | 0.720 |
| 2 | 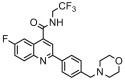 |
5.057 | 5.254 | −0.197 | 0.281 |
| 3 |  |
5.223 | 5.111 | 0.111 | 0.190 |
| 4a | 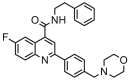 |
5.335 | 4.649 | 0.687 | 0.419 |
| 5 | 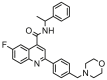 |
5.252 | 4.887 | 0.365 | 0.205 |
| 6a | 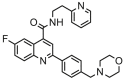 |
4.827 | 5.808 | −0.980 | 0.679 |
| 7 |  |
4.424 | 4.370 | 0.053 | 0.511 |
| 8a | 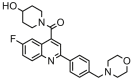 |
4.194 | 4.014 | 0.179 | 0.586 |
| 9 | 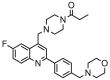 |
4.996 | 5.360 | −0.364 | 0.120 |
| 10 | 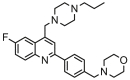 |
5.712 | 5.782 | −0.070 | 0.107 |
| 11a | 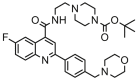 |
9.678 | 9.294 | 0.384 | 0.786 |
| 12 | 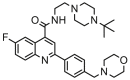 |
5.507 | 5.978 | −0.471 | 0.292 |
| 13 | 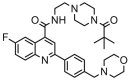 |
8.301 | 8.275 | 0.026 | 0.528 |
| 14 | 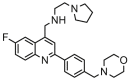 |
8.959 | 8.720 | 0.239 | 0.336 |
| 15a |  |
7.699 | 7.176 | 0.523 | 0.563 |
| 16 |  |
7.745 | 7.858 | −0.114 | 0.658 |
| 17 | 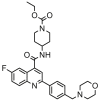 |
5.147 | 5.504 | −0.357 | 0.137 |
| 18a | 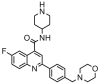 |
6.004 | 5.676 | 0.329 | 0.432 |
| 19a | 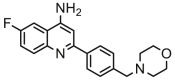 |
6.638 | 6.181 | 0.457 | 0.815 |
| 20 | 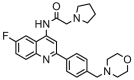 |
5.983 | 7.138 | −1.155 | 0.365 |
| 21 |  |
5.123 | 5.017 | 0.106 | 0.410 |
| 22 |  |
5.019 | 4.620 | 0.399 | 0.462 |
| 23 | 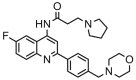 |
8.398 | 8.244 | 0.154 | 0.282 |
| 24 | 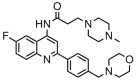 |
6.215 | 5.570 | 0.645 | 0.367 |
| 25 | 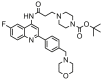 |
6.585 | 6.505 | 0.080 | 0.125 |
| 26 | 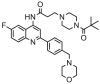 |
6.276 | 6.489 | −0.214 | 0.356 |
| 27a |  |
7.056 | 7.172 | −0.117 | 1.000 |
| 28 |  |
8.699 | 7.936 | 0.763 | 0.267 |
Test set, C/N = compound number.
Generation of molecular descriptors and pretreatment
The molecular structures of the 6-fluoroquinolines (Table 1) were drawn with Chemdraw version 12.0.2 software, and their equilibrium geometries were obtained in Spartan 14 software by optimization with the parametric semi-empirical (PM6) quantum mechanics method.6,7 The molecular descriptors of the optimized 6-fluoroquinolines were generated with PaDEL-Descriptor software version 2.20.8 After redundant and highly correlated descriptors were removed, normalization with Eq. (1) was performed to give each descriptor an equal chance of appearing in the model.9 These steps were achieved with Drug Theoretical and Cheminformatics Laboratory (DTC Lab) pretreatment and normalization software and the following equation:
| (1) |
where Xni and Xi are the normalized and unnormalized descriptor values for molecule i for a particular descriptor, and Xmin and Xmax are the minimum and maximum values for the descriptor.
Model building and validation
The Kennard-Stone algorithm in DTC Lab Data Division software was used to divide the data into two sets.10 This algorithm selects training set compounds from the data set by first selecting two compounds separate from each, other on the basis of Euclidean distance, and including them in the training set. Sequentially, the algorithm removes compounds from the dataset and includes them in the training set to maximize the Euclidean distance between the x-vectors of the already selected compound and the remaining compounds in the dataset. This process is repeated until the specified number of training set compounds is selected.11 This algorithm has the advantages of selecting training set compounds that are uniformly distributed along the data space and test set compounds that fall within the measured space.10
A total of 70% of the data (training set) was used in building the model, and 30% of the data (test set) was used to validate the model. The activities (pIC50) of the training set compounds were used as the dependent variable and their descriptors served as independent variables in regression analysis to build the model with the genetic function approximation (GFA) technique in Material Studio software version 8.0.12 GFA uses a genetic algorithm to identify the best model among possible QSAR models. It automatically selects group of descriptors at random, according to the user-specified number, and uses them to build regression models, then assesses the models with the Friedman function (LOF), a measure of model fitness expressed in Eq. (2).13 Many models are built on the basis of the user-specified number of generations, and the best model is the one with the lowest LOF score14 calculated as follows:
| (2) |
where p is the total number of descriptors in the model, c is the number of terms in the model, M is the number of compounds in the training set, d is the user-defined smoothing parameter, and SEE is the standard error of estimation, which is the same as the standard deviation of the model, defined as;
| (3) |
The built model was validated with the squared correlation coefficient R2; adjusted correlation coefficient R2adj; cross-validation coefficient Q2cv; and external validation coefficient R2pred, defined by Eqs. (4), (5), (6), (7), respectively.15
| (4) |
| (5) |
| (6) |
| (7) |
Yexp and Yprd are the experimental and predicted activity of the training set compounds, respectively, in Eqs. (4), (6), and the experimental and predicted activity of the test set compounds in Eq. (7). ӯprd is the mean experimental activity of the training set compounds. N and p in Eqs. (3), (5) are the number of molecules in the training set and number of descriptors in the model, respectively.
To validate the reliability of the developed model, we computed the randomization parameters R2r, Q2r and cR2p, which were robust and not obtained by chance. The training set was used to generate random multi-linear regression models through random shuffling of the activity of the compounds (dependent variables) while keeping their descriptors (independent variables) stable. R2r and Q2r were computed as the average of the squared correlation coefficient and cross-validation coefficient of the random models. The coefficient of determination cR2p was computed with Eq. (8):16
| (8) |
where R2 is the squared correlation coefficient for the nonrandomized model, and R2r is the average of the squared correlation coefficients of the random models.
Descriptor analyses
Inter-correlation among the descriptors in the built model was verified by correlation analysis of the descriptors. The variance inflation factor (VIF) for each descriptor was computed with Eq. (9) to further confirm their inter-correlation:17
| (9) |
where VIFi is the variance inflation factor for a descriptor i in the model, and R2ij is the correlation coefficient of the multiple regression between descriptor i and the remaining j descriptors in the model.
The mean effect (ME) for each descriptor in the model was computed with Eq. (10) to evaluate the relative influence of the descriptors in the model:18
| (10) |
where MEj is the mean effect for descriptor j in a model, dij is the value of descriptor j in the descriptor matrix for each molecule in the training set, βj is the coefficient of descriptor j in the model, m is the number of descriptors in the model, and n is the number of molecules in the training set.
Applicability domain of the model
The applicability domain, described by Williams's plot of the built model, was generated with the leverage method (Eq. (11)) to identify outliers and influential compounds in the dataset.19
| (11) |
where X is the descriptor matrix, and XT is the transpose matrix of X. The leverages of the compounds are the diagonal of the matrix h. The warning leverage h∗ is the maximum value above which a compound is considered to be influential, and is expressed as:
| (12) |
where n is the number of compounds in the training set, and p is the number of descriptors in the model.
Homology modeling
The crystal structure of PfeEF2 has not been elucidated. Therefore, we used comparative modeling to build the 3D structure of PfeEF2 and subsequently performed a docking study. The protein sequence of eEF2 for P. falciparum (isolate NF54), obtained from UniProtKB (http://www.uniprot.org) accession code W7JNW7, comprised 832 amino acids.20 The code was submitted to the SWISS-MODEL workspace (https://www.swissmodel.expasy.org) to search for evolutionarily related structures matching the target sequence.21 Suitable target-template alignments were identified with the Basic Local Alignment Search Tool (BLAST) and hidden Markov models (HMMs) with an HMM-HMM–based lightning-fast iterative sequence search (HHblits).22,23 The 3D structure of PfeEF2 was built with the highest ranked target-template alignment in ProMod3 version 3.2.1.24 The built structure was assessed with the qualitative model energy analysis (QMEAN) scoring function and global model quality estimation.24,25
Molecular docking
The modeled PfeEF2 was saved as a PDB file and used as receptor for docking with 6-fluoroquinolines as ligands. The ligands were prepared by saving their structures as PDB files from Spartan software, and the receptor was prepared by removal of co-crystallized ligands and hetero-atoms in Discovery Studio software.26 Both the ligands and the receptor were converted to PDBQT files and docked with Autodock Vina in Pyrx software with a grid box dimension of 75.7994 Å × 100.6790 Å × 118.096 Å, and centers of 75.9456, 38.8172 and −1.2721 (X, Y and Z coordinates, respectively), to cover the complete surface of the protein.27,28 The interactions in docked structures were visualized with Discovery Studio Visualizer.29
In silico drug-likeness and ADMET prediction
In silico prediction of drug-likeness, and adsorption, distribution, metabolism, excretion and toxicity (ADMET) of compounds with excellent binding affinity toward PfeEF2 was conducted with the SwissADME and ADMETlab 2.0 online platforms.30,31 These predictions are essential for evaluating the potential of a potent molecule to have effective pharmacokinetics and toxicity.32
Results
The best QSAR model developed on the basis of GFA that related the chemical structures of the 6-fluoroquinolines to their antiplasmodial activities is presented below:
| pIC50 = 2.428645705n5Ring − 4.587432351GGI9 − 7.127111879TDB7u + 7.951073945TDB8u + 0.078997316RDF75i − 8.731499618 |
Discussion
GFA was deployed to generate QSAR models relating the physicochemical properties of 6-fluoroquinolines with substitutions at ring positions 2 and 4 to their antiplasmodial activities. The model that best predicted the antiplasmodial activity of the compounds is reported herein. The model surpassed all validation parameters (Table 2) for good prediction, as indicated by the low residual (difference between experimental and theoretical activity) values of the compounds (Table 1). The linearity of the plots of the model's predicted and experimental activity (Figure 1a), and the difference in R2 and Q2cv of <0.3, further supported the model's predictive ability.26 The R2 values for the random models generated were all below the minimum value (0.6) for an acceptable model, thus indicating that the main model was not a product of chance. This finding was further confirmed by the average values of R2r, Q2r and cR2p (Table 3).15,16 Hence, the built model was considered robust, reliable and stable. The distribution of the compounds on opposite sides of the line 0 standardized residual (Figure 1b) indicated the absence of systematic error in model building.
Table 2.
Validation parameters of the model.
| Parameter | Threshold | Model value | RemarkR |
|---|---|---|---|
| R2 | R2 > 0.6 | 0.912 | Passed5 |
| R2adj | R2adj > 0.5 | 0.878 | Passed5 |
| F | Large | 27.001 | Passed5 |
| Q2cv | Q2cv > 0.5 | 0.801 | Passed5 |
| |R2 − Q2cv| | |R2 − Q2cv| < 0.3 | 0.111 | Passed33 |
| SEE | Low | 0.505 | Passed34 |
| R2pred | R2pred > 0.5 | 0.901 | Passed5 |
| r2 | r2 > 0.6 | 0.908 | Passed35 |
| r02 | 0.908 | ||
| r′02 | 0.898 | ||
| |r02 − −r'02| | |r02 − −r'02| < 0.3 | 0.010 | Passed35 |
| K | 0.85 < k < 1.15 | 1.022 | Passed35 |
| (r2 − −r02)/r2 | (r2 − −r02)/r2 < 0.1 | 0.000 | Passed35 |
RNote: r2 and r02 are the squared correlation coefficients of the plot of the experimental versus predicted pIC50 of the test set compounds with and without intercepts, respectively, and k is the gradient of the plot with intercept. r'02 is the reverse of r02.
Figure 1.

(a) Plot of predicted versus experimental pIC50 of the compounds. (b) Plot of standardized residual activity against experimental pIC50 of the compounds. (c) Plot of standardized residual activity against leverage of the compounds (Williams plot).
Table 3.
Results for random models.
| Model | R2 | Q2 |
|---|---|---|
| Original | 0.912 | 0.802 |
| Random 1 | 0.197 | −0.779 |
| Random 2 | 0.212 | −1.077 |
| Random 3 | 0.199 | −1.108 |
| Random 4 | 0.282 | −0.515 |
| Random 5 | 0.271 | −0.388 |
| Random 6 | 0.104 | −1.029 |
| Random 7 | 0.250 | −1.413 |
| Random 8 | 0.399 | −0.031 |
| Random 9 | 0.359 | −0.213 |
| Random 10 | 0.510 | −0.046 |
| Random model parameters | ||
| Average R2: | 0.336 | |
| Average Q2: | −0.527 | |
| Average cRp2: | 0.767 | |
The five descriptors best relating the structural features of the studied compounds to their antiplasmodial activities, as demonstrated in the model, were ring count (n5Ring), topological charge index (GGI9), 3D topological distance based autocorrelation (TDB7u and TDB8u) and 3D radial distribution function (RDF75i) descriptors. Pearson's correlation analysis was performed on the descriptors to verify their inter-correlation; further verification was performed with evaluation of VIF. The test results (Table 4) indicated no significant inter-correlation among the descriptors, on the basis of VIF values below 10. Therefore, the combination of descriptors significantly related the antiplasmodial activities of the studied compounds to their structures. The mean effects (Table 4) of the descriptors indicated their relative strength in influencing the pIC50 of the 6-fluoroquinolines.
Table 4.
Pearson's correlation, VIF and ME of the descriptors in the model.
| Descriptors | Inter-correlations |
VIF | ME | ||||
|---|---|---|---|---|---|---|---|
| n5Ring | GGI9 | TDB7u | TDB8u | RDF75i | |||
| n5Ring | 1.000 | −0.329 | 0.351 | 0.186 | −0.121 | 1.309 | 0.034 |
| GGI9 | −0.329 | 1.000 | −0.430 | −0.281 | 0.651 | 2.107 | −0.090 |
| TDB7u | 0.351 | −0.430 | 1.000 | 0.862 | −0.566 | 5.036 | −3.119 |
| TDB8u | 0.186 | −0.281 | 0.862 | 1.000 | −0.545 | 4.523 | 3.973 |
| RDF75i | −0.121 | 0.651 | −0.566 | −0.545 | 1.000 | 2.414 | 0.202 |
The first descriptor in the model was n5Ring, defined as the 5-membered ring count. This descriptor relates the present of 5-membered rings in the structures of 6-fluoroquinolines to their pIC50. The positive coefficient of this descriptor in the model indicated that the presence of 5-membered rings in the structures of 6-fluoroquinolines positively contributes to antiplasmodial activity. The second descriptor in the model was GGI9, defined as the 9-ordered raw topological charge index descriptor. This descriptor estimates the charge transfers between pairs of atoms that are nine bonds apart.36 The negative coefficient for this descriptor in the model indicated that the presence of two atoms that are nine bonds apart and have a high electronegativity difference contributes negatively to 6-fluoroquinoline antiplasmodial activity. The third and fourth descriptors in the model, TDB7u and TDB8u, describe topological distance, on the basis of autocorrelation of lag 7 (TDB7u) and 8 (TDB8u), all unweighted. This class of descriptors was calculated on the basis of the average Euclidean distance between all atoms located at a given topological distance (distance between two atoms in molecular graph representation).37 For the TDB7u and TDB8u descriptors, the topological distances considered were those between two atoms seven and eight bonds apart, respectively. All atoms were treated equally, because they were unweighted. An increase in TDB7u was associated with a decrease in antiplasmodial activity of 6-fluoroquinolines, because of its negative coefficient in the model. In contrast, an increase in TDB8u was associated with an increase in antiplasmodial activity, because of its positive coefficient in the model. The fifth descriptor in the model, RDF75i, is the radial distribution function 075/weighted by the first ionization potential.38 The descriptor measures the first ionization potential of an atom or group of atoms at a radius 4.5 Å from the geometrical center of the molecules. The positive coefficient for this descriptor in the model indicated that an increase in its value was associated with increased antiplasmodial activity of 6-fluoroquinolines.
The domain of applicability for the model was presented by a Williams plot (Figure 1c), as the area within ±3 standardized residuals, and leverage 0–0.950. The applicability domain showed no outliers, and all compounds were within ±3 standardized residuals. However, the leverage of one influential compound (compound 27) exceeded 0.950, the warning leverage for the model. The structure of this influential compound slightly differs from that of the other compounds in the dataset (Table 1) and therefore should not be considered the template when the model is used to design novel 6-fluoroquinolines.
DDD107498, the template for designing the dataset used in this work, has been reported to inhibit PfeEF2 as a molecular target.4 PfeEF2 is crucial for protein synthesis and is responsible for the GTP-dependent ribosomal translocation along mRNA; therefore, its discovery may open new avenues for antimalarial drug discovery.39 However, its crystal structure is not available, and its interaction with DDD107498 is unclear. Therefore, we designed a homology model for use in our docking study. The crystal structure of the closet template was searched with the protein sequence of eEF2 in P. falciparum (isolate NF54). ADP-ribosylated ribosomal translocase from Saccharomyces cerevisiae (PDB: 1U2R) was identified as the closest template, with 61.300% identity, 0.480 similarity, 1.000 coverage and 2.600 Å resolution, as determined by X-ray crystallography.40 Figure 2a shows the single sequence alignment of modeled PfeEF2 (Figure 2c) with the 1U2R (Figure 2b) amino acid sequence; amino acids of the 1U2R that aligned with the model are indicated in bold. The modeled PfeEF2 had a global model quality estimation score of 0.790 and QMEAN score of 0.770. The former scoring function estimates the accuracy of the modeled structure, whereas the latter assesses the quality of the model.24,25 The closer the values of the scoring functions are to 1, the better the built model. Therefore, the modeled PfeEF2 was considered good and reliable.
Figure 2.

(a) Single sequence alignment of modeled PfeEF2 (model-01) with 1U2R (1u2r.1.A) amino acid sequences. (b) 3D structure of 1U2R. (c) 3D structure modeled PfeEF2.
The plot in Figure 3a, shows the modeled PfeEF2 local quality estimate. The plot indicated a good local quality estimate, because most of the residue scores were close to 1, and the average was 0.770. Figure 3b compares the structure of the modeled PfeEF2 with the non-redundant aligned PDB structures, on the basis of a plot of normalized QMEAN scores (Z-scores) against protein sizes (residues). The plot indicated that the score of the structure of modeled PfeEF2 (red star) was within that of experimentally determined structures, on the basis of the number of residues. The model had a Z-score of −1.200, thus indicating good agreement with an experimental structure of similar size.41 Figure 3c shows the Ramachandran plot of modeled PfeEF2 for all non-glycine/proline residues. This plot provided insight into the backbone dihedral angles of amino acid residues in PfeEF2 against energetically favored regions of dihedrals of protein residues in general. In the plot, the green contour indicates the favored regions; 95.410% of residues were Ramachandran favored, and the MolProbity score was 1.88.
Figure 3.

(a) Local quality estimate of the residue graph. (b) Comparison of the modeled PfeEF2 structure with a non-redundant set of PDB structures. (c) Ramachandran plot of the modeled PfeEF2 for all non-glycine/proline residues.
All 28 compounds in our dataset were docked with the modeled pfeEF2, and their binding affinities ranged from −8.200 to −10.700 kcal/mol, thereby indicating strong interaction of the compounds with the amino acids of PfeEF2. DDD107498, which was experimentally suggested to form a stable complex with PfeEF2, was docked and found to have a binding affinity of −9.900 kcal/mol.39 This binding affinity was greater than that of five compounds in the dataset (Table 5), thus indicating that the compounds formed more stable complexes with the target than DDD107498, and consequently may be better inhibitors. Compound 5 had the best binding affinity (−10.700 kcal/mol), possibly because of its better interaction with the target. Figure 4 shows the structures of the interactions of compound 5 with PfeEF2. The interactions involved the following: (1) Three conventional hydrogen bonds: one of bond length 2.480 Å from a hydrogen on THR323 to fluorine in the quinoline moiety of the compound; one of bond length 2.190 Å from the nitrogen of the quinoline moiety of the compound to oxygen in TRP317; and one of bond length 2.06 Å from the nitrogen of the carboxamide group of the compound to oxygen in the ASP322 residue. (2) A carbon hydrogen bond of bond length 3.139 Å from the methyl carbon of the 2-{4-[(morpholin-4-yl)methyl]phenyl} substituent of the compound to oxygen in the GLY294 residue. (3) A halogen interaction between the carbon of the ASP322 residue and fluorine in the quinoline moiety. (4) Three electrostatic interactions: one of π-cation type between the amino group of ARG221 and the π-orbital of the N-benzyl substituent in the carboxamide group, and two of π-anion type from oxygen in the ASP322 residue to two rings of the quinoline moiety. (5) Six hydrophobic interactions: one of π-sigma type from carbon in the THR218 residue to the phenyl ring of the quinoline moiety; two of π-π type between the π-orbital in the PHE79 and HIS81 residues, and the π-orbital of the N-benzyl substituent in the carboxamide group; one of alkyl–alkyl type between the alkyl carbon in LEU316 and the morpholin carbon of the 2-{4-[(morpholin-4-yl)methyl]phenyl} substituent; and two π-alkyl type between PRO319 and the two rings of the quinoline moiety.
Table 5.
Docking results between modeled pfeEF2 and selected 6-fluoroquinolines.
| Ligand | Binding affinity (kcal/mol) | Hydrogen bonding |
Hydrophobic interaction |
Electrostatic interaction |
|---|---|---|---|---|
| Amino acid (bond length, Å) | Amino acidbond type | Amino acidbond type | ||
| 5 | −10.700 | THR323 (2.48)a, TRP317 (2.19)a, ASP322 (2.06)a, GLY294 (3.13)b | THR218c, PHE79d, HIS81d, LEU316e, PRO319f, PRO319f | ASP322g, ARG221h, ASP322i, ASP322i |
| 11 | −10.200 | SER107 (2.62)a, SER107 (2.04)a, HIS527 (2.97)a, THR771 (2.98)a, GLY780 (1.79)a, GLU143 (3.71)b | TYR473c, PHE783d, SER106j, TYR473f, ARG775f, MET471f | GLU525g |
| 16 | −10.000 | SER474 (2.79)a, THR771 (2.84)a, GLY780 (1.98)a | TYR473c, LEU507e, ARG775f, MET471f | GLU525g |
| 22 | −10.200 | LYS455 (1.80)a, TYR473 (2.46)a, SER474 (2.38)a, GLU525 (2.85)a, PHE783 (3.66)b, PRO784 (3.28)b | TYR473c, LEU526e, LEU526e, HIS102f, TYR473f, ARG775f, LEU526f | ALA782g, ASP104i, GLU525i |
| 24 | −10.100 | ARG114 (2.65)a, GLN781 (2.73)a, TYR186 (2.23)a, GLY142 (3.53)b, GLU143 (3.25)b, ASP188 (3.57)b | TYR186d | THR185g, ASP728i, ASP728i |
| Q4C | −9.900 | SER107 (2.10)a, SER107 (2.07)a, ARG775 (3.33)b, GLY780 (3.24)b, ASP104 (3.47)b | TYR473d, TYR473d, CYS523f, GLY524j, ARG775f, CYS523f | PHE105g |
Q4C = Quinoline-4-carboxamide. aConventional hydrogen bond. bCarbon hydrogen bond. cπ- sigma. dπ-π. eAlkyl-alkyl. fπ-alkyl. gHalogen. hπ-cation. iπ-anion. jAmide-π.
Figure 4.

3D and 2D structures of compound 5 and PfeEF2 interactions.
No correlation was observed between the binding affinities of the docked compounds and their antiplasmodial activity against a chloroquine-sensitive strain (PfNF54), thus indicating the possibility of multiple targets for the compounds. However, the results provide insight into the binding nature of PfeEF2 and may be used in designing good inhibitors.
Table 6 presents the predicted ADMET and drug-likeness properties of the five compounds with the best binding affinity. The partition coefficient (logP ≤ 5), molecular weight (<500 g/mol), H-bond acceptors (≤10) and H-bond donors (≤5), on the basis of Lipinski's rule, were predicted for the compounds.42 The results indicated that compounds 5 and 24 had no violations, whereas compounds 11, 16 and 22 each had one violation of Lipinski's rule (Table 6). The compounds satisfying Lipinski's rule (fewer than two violations) therefore were considered orally active.42 The water solubility (log mol/L) of the compounds indicated that compounds 5 and 11 were moderately soluble (−6 log mol/L < −4), and compounds 16, 22 and 24 were soluble (−4 log mol/L < −2). Therefore, the compounds are not expected to have poor oral absorption.43 The polar surface areas (Å2) of the compounds were within the satisfactory range and hence were considered orally bioavailable. Similarly, zero pan assay interference compounds (PAINS) alerts were obtained for all compounds, thus indicating that they may serve as lead compounds.44
Table 6.
In silico drug-likeness and ADMET properties of the most inhibitory compounds.
| Drug-likeness | Compounds |
||||
|---|---|---|---|---|---|
| 5 | 11 | 16 | 22 | 24 | |
| Partition coefficient (logP) | 4.700 | 3.770 | 3.990 | 3.520 | 3.100 |
| Molecular weight | 469.550 | 577.690 | 563.710 | 547.660 | 491.060 |
| Number of H-bond acceptors | 5 | 8 | 8 | 7 | 7 |
| Number of H-bond donors | 1 | 1 | 1 | 1 | 1 |
| Number of rotatable bonds | 7 | 11 | 11 | 9 | 8 |
| Lipinski's violations | 0 | 1 | 1 | 1 | 0 |
| Water solubility (log mol/L) | −5.193 | −4.159 | −3.440 | −2.849 | −2.563 |
| Polar surface area (Å2) | 54.460 | 87.240 | 70.170 | 78.010 | 60.940 |
| PAINS alert | 0 | 0 | 0 | 0 | 0 |
| Absorption | |||||
| Caco-2 permeability (log cm/s) | −4.935 | −4.989 | −5.197 | −5.134 | −4.899 |
| Human intestinal absorption (%) | 99.700 | 99.900 | 99.900 | 99.800 | 99.300 |
| Distribution | |||||
| Volume distribution (L/kg) | 2.328 | 1.830 | 2.109 | 2.319 | 2.357 |
| BBB penetration (log cm/s) | −0.188 | −0.072 | −0.038 | −0.041 | −0.010 |
| Metabolism | |||||
| CYP1A2 inhibitor | No | No | No | No | No |
| CYP2C19 inhibitor | No | Yes | Yes | Yes | No |
| CYP2C9 inhibitor | Yes | Yes | No | No | No |
| CYP2D6 inhibitor | Yes | Yes | Yes | Yes | Yes |
| CYP3A4 inhibitor | Yes | Yes | Yes | Yes | Yes |
| Excretion | |||||
| Half-life | 0.015 | 0.017 | 0.017 | 0.072 | 0.029 |
| Toxicity | |||||
| Ames toxicity | 0.833 | 0.289 | 0.046 | 0.030 | 0.144 |
| Rat oral acute toxicity | 0.436 | 0.426 | 0.326 | 0.786 | 0.429 |
| Carcinogenicity | 0.092 | 0.388 | 0.088 | 0.125 | 0.088 |
The Caco-2 permeability (>−5.15 log cm/s) of all compounds except compound 16 (<−5.15 log cm/s), and the intestinal absorption (>30%) of all compounds, indicated good absorption potential. The volume distribution (0.04 < VD < 20 L/kg) of the compounds indicated good distribution characteristics, and the blood–brain barrier (logBBB cm/s > −1) of the compounds indicated their ability to cross the barrier and thus not cause any problems with the central nervous system.32 Metabolism of the compounds was predicted on the basis of their interaction with cytochrome P450 (CYP) (Table 6). All compounds were found to be inhibitors of CYP2D6 and CYP3A4, but not CYP1A2. Compounds 5 and 11 were found to be inhibitors of CYP2C9, whereas compounds 16, 22 and 24 were not. Compounds 11, 16 and 22 were found to be inhibitors of CYP2C19, whereas compounds 5 and 24 were not. Investigation of the interactions of molecules with CYP isoforms is key to understanding drug metabolism.6 The excretion of the compounds was verified by prediction of their half-lives in terms of the probability (from 0 to 1) of having a long half-life. The half-lives of the compounds (Table 6) indicated high clearance. The toxicity prediction is given as the probability (from 0 to 1) of being toxic. The results (Table 6) indicated that the compounds had low probabilities of being toxic, except for compounds 5 and 22, which had high probabilities of Ames and rat oral acute toxicity, respectively. Therefore, only compound 5 might be mutagenic, and compound 22 might have toxicity to mammals.32 The ADMET results indicated good pharmacokinetic properties; therefore, the studied compounds may be considered for drug development.
Conclusion
This work developed a robust and reliable QSAR model that relates the structures of 2,4-disubstituted 6-fluoroquinolines to their antiplasmodium activity, on the basis of GFA. The model had R2, R2adj, Q2cv, and R2pred values of 0.921, 0.878, 0.801 and 0.901, respectively. Our findings indicated that the n5Ring, GGI9, TDB7u, TDB8u and RDF75i descriptors were the physicochemical properties most strongly associated with 6-fluoroquinoline antiplasmodium activity. n5Ring, TDB8u and RDF75i were positively associated, whereas GGI9 and TDB7u were negatively associated, with the antiplasmodium activities of the compounds. A docking study indicated formation of stable complexes between the compounds and modeled PfeEF2, with binding affinities ranging from −8.200 to −10.700 kcal/mol. Compounds 5, 11, 16, 22 and 24 had better binding affinity than DDD107498 and good pharmacokinetic properties; therefore, these compounds may serve as better inhibitors of this novel target. Our findings may be used to design novel 2,4-disubstituted 6-fluoroquinolines with high antiplasmodial potency and good structural properties of inhibiting the novel antimalarial drug target PfeEF2.
Source of funding
This research did not receive any specific grant from funding agencies in the public, commercial or not-for-profit sectors.
Conflict of interest
The authors have no conflict of interest to declare.
Ethical approval
No ethical issues are reported.
Authors contributions
GAS, AWM and AU conceived and designed the study. GAS and AWM obtained the data. AWM drew and optimized the structures. AWM calculated descriptors, generated the model and performed statistical analysis. GAS conducted homology modeling and molecular docking. GAS, AWM and AU interpreted the results. MTI performed pharmacokinetic predictions. AMW wrote the paper. All authors have critically reviewed and approved the final draft and are responsible for the content and similarity index of the manuscript.
Acknowledgment
The authors wish to acknowledge the support of the computer laboratory, Chemistry Department, Ahmadu Bello University Zaria, Nigeria.
Footnotes
Peer review under responsibility of Taibah University.
References
- 1.Cohen J.M., Smith D.L., Cotter C., Ward A., Yamey G., Sabot O.J., et al. Malaria resurgence: a systematic review and assessment of its causes. Malar J. 2012;11:122. doi: 10.1186/1475-2875-11-122. [DOI] [PMC free article] [PubMed] [Google Scholar]
- 2.Mahmud A.W., Shallangwa G.A., Uzairu A. In Silico studies of 2,5-disubstituted furans as active antimalarial drug candidates. Bull Natl Res Cent. 2020;44(1):77. doi: 10.1186/s42269-020-00333-9. [DOI] [Google Scholar]
- 3.World Health Organization . 2022. World malaria report.https://www.who.int/teams/global-malaria-programme/reports/world-malaria-report-2022 [Google Scholar]
- 4.Hochegger P., Faist J., Seebacher W., Safb R., Maser P., Kaiser M., et al. Synthesis and structure-activity relationships for new 6-fluoroquinoline derivatives with antiplasmodial activity. Bioorg Med Chem. 2019;27:2052–2065. doi: 10.1016/j.bmc.2019.03.061. [DOI] [PubMed] [Google Scholar]
- 5.Tropsha A. Best practices for QSAR model development, validation, and exploitation. Mol Inform. 2010;29:476–488. doi: 10.1002/minf.201000061. [DOI] [PubMed] [Google Scholar]
- 6.Li Z., Wan H., Shi Y., Ouyang P. Personal experience with four kinds of chemical structure drawing software: review on ChemDraw, ChemWindow, ISIS/Draw, and ChemSketch. J Chem Inf Comput Sci. 2004;44:1886–1890. doi: 10.1021/ci049794h. [DOI] [PubMed] [Google Scholar]
- 7.Shao Y., Molnar L.F., Jung Y., Kussmann J., Ochsenfeld C., Brown S.T. Advances in methods and algorithms in a modern quantum chemistry program package. Phys Chem Chem Phys. 2006;8:3172–3191. doi: 10.1039/b517914a. [DOI] [PubMed] [Google Scholar]
- 8.Yap C.W. PaDEL-descriptor: an open source software to calculate molecular descriptors and fingerprints. J Comput Chem. 2011;32:1466–1474. doi: 10.1002/jcc.21707. [DOI] [PubMed] [Google Scholar]
- 9.Singh P. Quantitative structure-activity relationship study of substituted-[1, 2, 4] oxadiazoles as S1P1 agonists. J Curr Chem Pharm Sci. 2013:3. [Google Scholar]
- 10.Kenard R.W., Stone L.A. Computer aided design of experiments. Technometrics. 1969;11(1):137–148. doi: 10.1080/00401706.1969.10490666. [DOI] [Google Scholar]
- 11.Saptoro A., Tadé M.O., Vuthaluru H. A modified Kennard-Stone algorithm for optimal division of data for developing artificial neural network models. Chem Prod Process Model. 2012;7(1) doi: 10.1515/1934-2659.1645. [DOI] [Google Scholar]
- 12.Rogers D., Hopfinger A.J. Application of genetic function approximation to quantitative structure-activity relationships and quantitative structure-property relationships. J Chem Inf Comput Sci. 1994;34:854–866. [Google Scholar]
- 13.Friedman J.H. Multivariate adaptive regression splines. Ann Stat. 1991:1–67. doi: 10.1177/096228029500400303. [DOI] [PubMed] [Google Scholar]
- 14.Rogers D., Hopfinger A.J. Application of genetic function approximation to quantitative structure-activity relationships and quantitative structure-property relationships. J Chem Znf Comput Sci. 1994:34854–34866. [Google Scholar]
- 15.Tropsha A., Gramatica P., Gombar V.K. The importance of being earnest: validation is the absolute essential for successful application and interpretation of QSPR models. Mol Inform. 2003;22:69–77. [Google Scholar]
- 16.Roy K. On some aspects of validation of predictive quantitative structure-activity relationship models. Expert Opin Drug Discov. 2007;2:1567–1577. doi: 10.1517/17460441.2.12.1567. [DOI] [PubMed] [Google Scholar]
- 17.Beheshti A., Pourbasheer E., Nekoei M., Vahdani S. QSAR modeling of antimalarial activity of urea derivatives using genetic algorithm-multiple linear regressions. J Saudi Chem Soc. 2016;20:282–290. [Google Scholar]
- 18.Habibi-Yangjeh A., Danandeh-Jenagharad M. Application of a genetic algorithm and an artificial neural network for global prediction of the toxicity of phenols to Tetrahymena pyriformis. Monatsh Chem Chem Mon. 2009;140:1279–1288. doi: 10.1007/s00706-009-0185-8. [DOI] [PMC free article] [PubMed] [Google Scholar]
- 19.Veerasamy R., Rajak H., Jain A., Sivadasan S., Varghese C.P., Agrawal R.K. Validation of QSAR models-strategies and importance. Int J Drug Discov. 2011;3:511–519. [Google Scholar]
- 20.Consortium T.U. UniProt: a worldwide hub of protein knowledge. Nucleic Acids Res. 2019;47(1):506–515. doi: 10.1093/nar/gky1049. [DOI] [PMC free article] [PubMed] [Google Scholar]
- 21.Waterhouse A., Bertoni M., Bienert S., Studer G., Tauriello G., Gumienny R. SWISS-MODEL: homology modelling of protein structures and complexes. Nucleic Acids Res. 2018;46(1):296–303. doi: 10.1093/nar/gky427. [DOI] [PMC free article] [PubMed] [Google Scholar]
- 22.Camacho C., Coulouris G., Avagyan V., Ma N., Papadopoulos J., Bealer K., et al. BLAST+: architecture and applications. BMC Bioinf. 2009;10:421–430. doi: 10.1186/1471-2105-10-421. [DOI] [PMC free article] [PubMed] [Google Scholar]
- 23.Steinegger M., Meier M., Mirdita M., Vöhringer H., Haunsberger S.J., Söding J. HH-suite3 for fast remote homology detection and deep protein annotation. BMC Bioinf. 2019;20:473. doi: 10.1186/s12859-019-3019-7. [DOI] [PMC free article] [PubMed] [Google Scholar]
- 24.Studer G., Rempfer C., Waterhouse A.M., Gumienny G., Haas J., Schwede T. QMEANDisCo - distance constraints applied on model quality estimation. Bioinformatics. 2020;36:1765–1771. doi: 10.1093/bioinformatics/btz828. [DOI] [PMC free article] [PubMed] [Google Scholar]
- 25.Bertoni M., Kiefer F., Biasini M., Bordoli L., Schwede T. Modeling protein quaternary structure of homo- and hetero-oligomers beyond binary interactions by homology. Sci Rep. 2017;7 doi: 10.1038/s41598-017-09654-8. [DOI] [PMC free article] [PubMed] [Google Scholar]
- 26.Belhassan A., Chtita S., Zaki H., Alaqarbeh M., Alsakhen N., Almohtaseb F., et al. In silico detection of potential inhibitors from vitamins and their derivatives compounds against SARS-CoV-2 main protease by using molecular dynamic simulation and ADMET profiling. J Mol Struct. 2022;1258 doi: 10.1016/j.molstruc.2022.132652. [DOI] [PMC free article] [PubMed] [Google Scholar]
- 27.Trott O., Olson A.J. AutoDock Vina: improving the speed and accuracy of docking with a new scoring function, efficient optimization and multithreading. J Comput Chem. 2010;31:455–461. doi: 10.1002/jcc.21334. [DOI] [PMC free article] [PubMed] [Google Scholar]
- 28.Grasso G., Gregorio A.D., Mavkov B., Piga D., Labate G.F.D., Danani A., et al. Fragmented blind docking: a novel protein–ligand binding prediction protocol. J Biomol Struct Dyn. 2022;40(24):13472–13481. doi: 10.1080/07391102.2021.1988709. [DOI] [PubMed] [Google Scholar]
- 29.Aanouz I., Belhassan A., El Khatabi K., Lakhlifi T., El Idrissi M., Bouachrine M. Moroccan medicinal plants as inhibitors of COVID-19: computational investigations. J Biomol Struct Dyn. 2020:1–12. doi: 10.1080/07391102.2020.1758790. [DOI] [PMC free article] [PubMed] [Google Scholar]
- 30.Daina A., Michielin O., Zoete V. SwissADME: a free web tool to evaluate pharmacokinetics, drug-likeness and medicinal chemistry friendliness of small molecules. Nat Publ Group. 2017:1–13. doi: 10.1038/srep42717. [DOI] [PMC free article] [PubMed] [Google Scholar]
- 31.Xiong G., Wu Z., Yi J., Fu L., Yang Z., Hsieh C., et al. ADMETlab 2.0: an integrated online platform for accurate and comprehensive predictions of ADMET properties. Nucleic Acids Res. 2021;49(W1):W5–W14. doi: 10.1093/nar/gkab255. PMID:33893803. [DOI] [PMC free article] [PubMed] [Google Scholar]
- 32.Aouidate A., Ghaleb A., Ghamali M., Chtita S., Ousaa A., Choukrad M., et al. Furanone derivatives as new inhibitors of CDC7 kinase: development of structure activity relationship model using 3D QSAR, molecular docking, and in silico ADMET. Struct Chem. 2018;29(4):1–13. doi: 10.1007/s11224-018-1086-4. [DOI] [Google Scholar]
- 33.Eriksson L., Jaworska J., Worth A.P., Cronin M.T., McDowell R.M., Gramatica P. Methods for reliability and uncertainty assessment and for applicability evaluations of classification-and regression-based QSARs. Environ Health Perspect. 2003;111:1361. doi: 10.1289/ehp.5758. [DOI] [PMC free article] [PubMed] [Google Scholar]
- 34.Damme S.V., Bultinck P. A new computer program for QSAR-analysis: ARTEQSAR. J Comput Chem. 2007;28:1924–1928. doi: 10.1002/jcc.20664. [DOI] [PubMed] [Google Scholar]
- 35.Golbraikh A., Tropsha A. Beware of q 2! J Mol Graph Model. 2002;20:269–276. doi: 10.1016/s1093-3263(01)00123-1. [DOI] [PubMed] [Google Scholar]
- 36.Gilvez J., Garcia R., Salabert M.T., Soler R. Charge indexes. New topological descriptors. J Chem Inf Comput Sci. 1994;34:520–525. [Google Scholar]
- 37.Christian T.K., Dominik K., Gerhard E. Topological distance based 3D descriptors for use in QSAR and diversity analysis. J Chem Inf Comput Sci. 2004;44:200–209. doi: 10.1021/ci0256236. [DOI] [PubMed] [Google Scholar]
- 38.Hemmer M.C., Steinhauer V., Gasteiger J. Deriving the 3D structure of organic molecules from their infrared spectra. Vib Spectrosc. 1999;19(1):151–164. [Google Scholar]
- 39.Baragana B., Hallyburton I., Lee M.C., Norcross N.R., Grimaldi R., Otto T.D., et al. A novel multiple-stage antimalarial agent that inhibits protein synthesis. Nature. 2015;315:315–320. doi: 10.1038/nature14451. [DOI] [PMC free article] [PubMed] [Google Scholar]
- 40.Jorgensen R., Yates S.P., Nilsson J., Prentice G.A., Teal D.J., Merrill A.R., et al. Crystal structure of ADP-ribosylated ribosomal translocase from Saccharomyces cerevisiae. J Biol Chem. 2004;279:45919–45925. doi: 10.1074/jbc.M406218200. [DOI] [PubMed] [Google Scholar]
- 41.Abdullahi M., Adeniji S.E., Arthur D.E., Haruna A. Homology modeling and molecular docking simulation of some novel imidazo[1,2-a]pyridine-3-carboxamide (IPA) series as inhibitors of Mycobacterium tuberculosis. J Genet Eng Biotechnol. 2021;19:12. doi: 10.1186/s43141-020-00102-1. [DOI] [PMC free article] [PubMed] [Google Scholar]
- 42.Lipinski C.A., Lombardo F., Dominy B.W., Feeney P.J. Experimental and computational approaches to estimate solubility and permeability in drug discovery and development settings. Adv Drug Deliv Rev. 2001;46:3–26. doi: 10.1016/s0169-409x(00)00129-0. [DOI] [PubMed] [Google Scholar]
- 43.Ouassaf M., Belaidi S., Al Mogren M.M., Chtita S., Khan S.U., Htar T.T. Combined docking methods and molecular dynamics to identify effective antiviral 2, 5-diaminobenzophenonederivatives against SARS-CoV-2. J King Saud Univ Sci. 2021;33(2) doi: 10.1016/j.jksus.2021.101352. [DOI] [PMC free article] [PubMed] [Google Scholar]
- 44.Daoui O., Mazoir N., Bakhouch M., Salah M., Benharref A., Gonzalez-Coloma A., et al. 3D-QSAR, ADME-Tox, and molecular docking of semisynthetic triterpene derivatives as antibacterial and insecticide agents. Struct Chem. 2022;33:1063–1084. doi: 10.1007/s11224-022-01912-4. [DOI] [PMC free article] [PubMed] [Google Scholar]