

SUMMARY
Organ regeneration requires dynamic cell interactions to reestablish cell numbers and tissue architecture. While we know the identity of progenitor cells that replace lost tissue, the transient states they give rise to and their role in repair remain elusive. Here, using multiple injury models we find that alveolar fibroblasts acquire distinct states marked by Sfrp1 and Runx1 that influence tissue remodeling and reorganization. Unexpectedly, ablation of alveolar epithelial type-1 (AT1) cells alone is sufficient to induce tissue remodeling and transitional states. Integrated scRNA-seq followed by genetic interrogation reveals RUNX1 is a key driver of fibroblast states. Importantly, the ectopic induction or accumulation of epithelial transitional states induce rapid formation of transient alveolar fibroblasts, leading to organ-wide fibrosis. Conversely, the elimination of epithelial or fibroblast transitional states or RUNX1 loss, leads to tissue simplification resembling emphysema. This work uncovered a key role for transitional states in orchestrating tissue topologies during regeneration.
Keywords: Transitional states, tissue topology, lung regeneration, remodeling, extracellular matrix organization, fibrosis, emphysema, RUNX1, alveolar fibroblasts, alveolar epithelial cells
eTOC blurb:
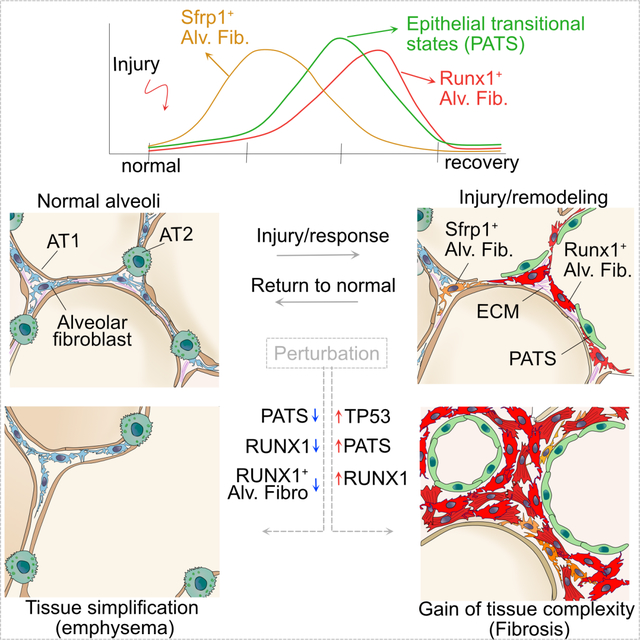
Tata and colleagues described a critical role for repair-associated transitional states that emerge from progenitors in alveolar remodeling and reorganization. Impaired crosstalk or imbalance in epithelial and fibroblast transitional states can alter extracellular matrix abundance and organization, and lead to topologically distinct phenotypes similar to human lung fibrosis and emphysema.
Graphical Abstarct
INTRODUCTION
Organ remodeling is a hallmark of many diseases in which tissues deviate from their normal composition in terms of both cellular and acellular components1–8. In some cases, remodeling can lead to gain of tissue complexity, as seen in fibrosis, whereas in other cases tissues undergo cellular atrophy and simplification4,9–12. Therefore, tissues must be able to monitor and maintain the appropriate density and organization of different cell types and extracellular matrix (ECM) at homeostasis and repair after injury. Significantly, the underlying cellular and molecular mechanisms that balance normal versus defective regeneration remain elusive.
The distal lung is composed of millions of saccular alveolar units separated by delicate and thin-walled structures called septa13–15. Each septum consists of an epithelial layer composed of thin alveolar type-1 cells (AT1) and cuboidal alveolar type-2 cells (AT2s) facing the lumen and a shared interstitium in the middle. The interstitium contains few cells drawn from multiple lineages, including fibroblasts, pericytes, endothelial cells of micro-capillary tubes, and immune cells16–22. Importantly, the interstitium also contains ECM proteins organized into a three-dimensional continuum that forms the fibroelastic “scaffold” of the lung13,23,24. The ECM is composed primarily of collagens and elastin, which provide high tensile strength and extensibility, respectively. Significantly, certain genetic risk variants and environmental agents can disrupt this matrix leading to loss of tensile strength and enlargement of airspaces, a clinical manifestation known as emphysema25. In contrast, fibrotic lung diseases deposit excess ECM, leading to interstitial thickening, decrease in surface area, and progressive respiratory dysfunction26–28. Multiple studies using clinical specimens and animal models have demonstrated the contribution of various cell populations to tissue remodeling9,20,29. Nevertheless, we currently lack a unified framework for explaining the mechanisms that lead to the two contrasting phenotypes of human diseased alveolar tissue – namely, emphysema and fibrosis. Specifically, we need to understand the cellular circuits that control the production and deposition of ECM in spatially organized alveolar niches, and the cellular trajectories during regeneration. Recent studies have uncovered molecularly unique epithelial cell states in pathological lung, which resemble those of transitional states that emerge during AT2 to AT1 differentiation after injury30–32. Further, Tsukui and colleagues have identified a distinct alveolar fibroblast population marked by Cthrc1 after bleomycin-induced alveolar injury33. However, a direct role for these transitional states in tissue organization and their crosstalk during regeneration is poorly understood.
Here, we use multiple lung injury models, including cell type-specific ablation coupled with single cell transcriptome (scRNA-seq) profiling, to uncover cellular trajectories that accompany injury-repair processes in the alveolar region. We uncover co-emergence of transitional states in both the epithelium and fibroblasts and show how they influence each other to regulate repair. Integrated data analyses from different injury models identify key molecular mechanisms driving cellular trajectories. Our data also uncover fibroblast states that synthesize and assemble ECM proteins to re-establish structural organization of the 3D fibroelastic continuum during regeneration. Ectopic induction, accumulation, or reduction of epithelial transitional states leads to significant defects in repair, causing either tissue simplification or fibrosis. Similarly, experimental disruption of the transcriptional programs controlling fibroblast states lead to dysregulation of alveolar cell fates, repair processes, and alveolar organization.
RESULTS
Alveolar repair involves partial remodeling and emergence of transitional states
To understand cellular dynamics associated with lung injury-repair, we used butylated hydroxytoluene (BHT; 3,5-di-tert-4-butylhydroxytoluene); an antioxidant known to cause damage to AT1s and endothelial cells34–37. First, we administered tamoxifen to Sftpc-creER;R26R-tdTomato (hereafter referred to Sftpc-tdT) mice to label AT2s with tdTomato followed by BHT injury and tissue collection at different time points (Figure 1A). Immunostaining for tdTomato and the AT1s marker (LEL, Lycopersicon Esculentum lectin) on lung sections from days 6, 10, and 30 revealed the early loss of AT1s followed by a gradual differentiation of AT2s into AT1 (Figure S1). Interestingly, this repair is accompanied by a dramatic change in tissue organization as revealed by hydrazide staining, which marks elastin bundles. Specifically, we observed both enlargement and narrowing of alveolar spaces in injured lungs (Figures 1B, S1A and S1B). These changes were quantified using Cellpose38, a semi-automated image processing tool (Figures 1C and S1C). Of note, we observed near complete recovery of tissue reorganization by day-30 post BHT administration. Unlike patchy injury observed in commonly used lung injury model (intranasally administered bleomycin), BHT elicits injury-repair throughout the lung lobes as assessed by ACTA2 and trichrome staining (Figure S1D, E). Further, pulmonary function measurements (forced oscillometry) on lungs from BHT treated mice at day-6 displayed significantly increased airway resistance and elastance as well as decreased compliance and inspiratory capacity compared to uninjured controls (Figure S1F). Of note, pulmonary functions were recovered to normal by day-20 post injury (Figure S1F). These data revealed that alveolar tissue undergoes extensive but reversible topological changes during BHT induced injury-repair.
Figure 1. Alveolar repair accompanies partial remodeling and emergence of transitional states following BHT injury.

A, Schematic of lineage-labeling of Sftpc-tdT mice followed by BHT administration and tissue collection. B, Staining for Sftpc-tdT and hydrazide in control lungs and after BHT injury. Scale bar: 50μm. Images are presented as a z-projection over approximately 40μm. C, Quantification of alveolar size in controls and BHT injury. Datapoints represent individual alveoli, compiled from n=3 mice. One-way ANOVA, Tukey’s test *p=0.04, ns-not significant. D, Schematic of workflow for cell isolation, sorting, and scRNA-seq after BHT injury. E, UMAP visualization of major cell classes profiled by scRNA-seq, and after integration with control dataset, with control (blue) and BHT (red) cells. F, UMAPs show alveolar mesenchymal cell populations in control and BHT day-6, with the expression of indicated genes on right. G, Dot plot showing mesenchymal cell population specific markers, corresponding to cell populations in Figure 1F. H, Immunostaining for SFRP1, ACTA2, and ITGA8 (upper panel) and CTHRC1, ACTA2, and TIMP1 in control, day-3 and day-6 following BHT injury. Scale bar: 50μm. I. Quantification of SFRP1+ and TIMP1+ cells in field of view (FOV) and percentage of ACTA2+ cells per area. One-way ANOVA, Tukey’s test, **p=0.04, ***p<0.001. 20x images were used for quantification. J, UMAPs show alveolar epithelial cell populations in control and day-6 after BHT, with expression of indicated genes in AT2s, AT1s, proliferating AT2s, and PATS. K, Dot plot showing alveolar epithelial cell-specific markers corresponding to cell populations in Figure 1J. L, Immunostaining for SFN, Sftpc-tdT, and LEL in control and following BHT injury. Scale bar: 50μm. M. Quantification of SFN+ cells in field of view (FOV). One-way ANOVA, Tukey’s test, ***p<0.001. In all graphs data are presented as mean±SEM. 20x images were used for quantification. DAPI stains nuclei in all panels. Insets: individual channels of regions indicated by white dashed boxes. See also Figures S1 and S2.
To ascertain cellular and molecular changes associated with alveolar injury-repair, we performed scRNA-seq of lung tissues collected on day-6 post BHT treatment. To enrich epithelial and mesenchymal cells, we depleted endothelial and immune cells prior to single cell capture (Figure 1D). We recovered a total of 15,486 cells from BHT treated lungs and integrated them with previously described controls39. As expected, 88% of the recovered cells were from epithelial (Epcam) and mesenchymal (Col1a1), and the remaining minor cell populations belong to mesothelial (Wt1), and immune cell (Ptprc) lineages (Figures 1E and S2A).
Among the mesenchymal cells, marker analyses revealed all previously described cell populations including alveolar fibroblasts (Tcf21, Mettl7a1, Slc7a10), adventitial fibroblasts (Pi16, Fbln1, Dcn), smooth muscle cells (Slc11a1, Timp4, Acta2, Myh11), pericytes (Pde5a, Cspg4, Pdgfrb), peri-bronchiolar fibroblasts (Fgf18, Wnt5a, P2ry14) and mesothelial cells (Wt1) both in controls and BHT injury (Figures 1F and S2B). Of these, alveolar fibroblasts showed significant differences between controls and BHT treated lungs. Specifically, the latter contained alveolar fibroblasts marked by Mt2, Plac8, Saa3, Gas6, Lif, Ptgs2, Sfrp1, Cthrc1, Timp1, Spp1, Piezo2, and Acta2. We refer to these as transitional alveolar fibroblasts. Of note, some of these markers including ACTA2 have been previously described as markers of myofibroblasts in bleomycin-induced lung fibrosis models (Figures 1G and S2B)33,40. However, we found distinct gene expression patterns within transitional alveolar fibroblasts, suggestive of subpopulations (Figures 1F and S2B). For example, Sfrp1, Chl1 showed opposing expression patterns to that of Acta2 and Spp1, while Timp1 expression overlapped with all these markers within transitional alveolar fibroblasts. Immunostaining for SFRP1, TIMP1, LGALS1, CTHRC1 or in situ RNA detection for Gas6 and Saa3 further confirmed the emergence of transitional alveolar fibroblasts in BHT-treated lungs but not in controls (Figures 1H–I, and S2C–E). Quantification revealed SFRP1 expression peaked between day-3 and day-6 whereas TIMP1 and ACTA2 were high on day-6. Expression levels of these markers were either reduced or completely absent by day-15, consistent with the model that transitional alveolar fibroblasts emerge transiently during injury-repair (Figures 1H–I and S2C–E).
In epithelial cells, we found all known major cell types, including ciliated (Foxj1), club (Chad), AT2 (Lyz2, Etv5, Lamp3, Sftpc), and AT1 cells (Rtkn2, Ager, Cav1, Spock2) in both control and BHT injury (Figures 1E and 1J–K). Furthermore, we found recently described alveolar epithelial transitional states (Cldn4, Sfn, Clu, Krt19, Krt8) (PATS/DATP/ADI, here after referred to as PATS) and proliferating-AT2s (Birc5, Top2a) specifically in BHT-injured lungs, consistent with previous findings in other injury models30–32 (Figures 1J–K). Immunostaining for SFN and LGALS3 further confirmed the presence of PATS (Figures 1L, S2F and S2G). Similar to transitional alveolar fibroblasts, these markers peaked on day-6 and disappeared by day-10 post BHT injury (Figures 1M, S2F and S2G). Together, our data suggest that epithelial and alveolar fibroblast transitional states co-emerge during tissue remodeling.
AT1 cell ablation alone induces transient and reversible tissue remodeling and repair associated transitional states
The above data revealed that AT2s replace AT1s that are lost after BHT injury. We then asked whether AT1s loss alone can induce the tissue remodeling and transitional states that emerged in response to BHT injury. To specifically ablate AT1s, we utilized Ager-creER;R26R-DTR mice (hereafter referred to as Ager-DTR) and sequentially administered tamoxifen (to induce expression of diphtheria toxin receptor (DTR)) and diphtheria toxin (DT) (Figure 2A). Immunostaining revealed DTR expression specifically in AT1s in control mice (−DT), but not in mice that recovered post DT administration (Figures 2B and S2A). These data indicate that DTR-expressing cells are killed following DT administration and are subsequently replaced by AT2s differentiation (Figure 2B). Quantification of mean linear intercept (MLI) in controls, day-6, and day-60 following AT1 ablation revealed a significant increase in MLI on day-6, with the tissue returning to near normal by day-60 (Figure 2C and Figure S3B). This suggests that AT1s loss leads to transient and reversible alveolar remodeling during repair.
Figure 2. AT1 cell ablation alone induces tissue remodeling and repair associated transitional states.

A, Schematic depicting AT1 cell ablation using Ager-CreER;R26R-DTR mouse model. Sequential administration of tamoxifen (TMX) and diphtheria toxin (DT) followed by tissue collection for scRNA-seq and immunofluorescence analysis. B, Immunostaining for DTR and LEL in tamoxifen-induced Ager-CreER;R26R-DTR mice without DT and 28-days after DT administration. Scale bar: 20μm. A single z-stack image is shown. C, Quantification of MLI in control mice and AT1 ablation day-6 and day-60. n=3 mice per condition. One-way ANOVA, Tukey’s test ****p<0.0001. D, UMAP visualization of major cell classes profiled by scRNA-seq (center). Mesenchymal (left) and alveolar (right) are split by time point in control and after AT1 ablation. Split views from different time points are shown at the bottom. E, Feature plots show expression of indicated genes in alveolar, transitional fibroblasts, adventitial, peri-bronchiolar fibroblasts, pericytes, and smooth muscle. F, Dot plot showing mesenchymal cell population specific markers, corresponding to cell populations in 2E. G, Feature plots show expression of indicated genes for PATS, AT1s, AT2s, proliferating-AT2s, and activated-AT2s. H, Dot plot showing alveolar epithelial cell-specific markers corresponding to cell populations in Figure 2G. I, Immunostaining for SFN, ACTA2, and LEL in control and AT1 ablation day-6. Scale bar: 50μm. J, Quantification of % of ACTA2 coverage per area and number of SFN+ cells in FOV in control and AT1 ablation. n=3 mice. ***p<0.001, one-way ANOVA, followed by Tukey’s multiple comparison’s test. 20x images were used for quantification. K, Immunostaining for SFRP1, ACTA2, and TIMP1 in control and AT1 ablation day-6. Scale bar: 50μm. DAPI stains nuclei in all panels. Scale bar: 50μm. L, Quantification of SFRP1+ and TIMP1+ cells in FOV in control and indicated time points following AT1 ablation. n=3 mice. ***p<0.001, **p=0.002 (right graph), **p=0.001 (left graph), one-way ANOVA, Tukey’s test. 20x images were used for quantification. In all graphs data are presented as mean±SEM. See also Figure S3.
To determine cell states associated with repair after AT1s ablation, we performed scRNA-seq analyses on samples from control (−DT) and DT administered mice on days 3, 6, and 10. We enriched epithelial and mesenchymal cells prior to single cell capture (Figure 2D). We recovered airway (742 cells), alveolar (2291 cells), and mesenchymal (5114 cells) from control and AT1 ablated lungs. Among mesenchymal cells, we recovered alveolar, adventitial and peri-bronchiolar fibroblasts, smooth muscle cells, pericytes, and mesothelial cells, both in control and AT1 ablated lungs (Figures 2D and S3C). Similar to BHT model, alveolar fibroblasts showed significant differences in AT1 ablated lungs. Unsupervised clustering and marker analyses revealed that alveolar fibroblasts from day-3 and day-6 were segregated into unique and overlapping clusters. Significantly, cells from day-10 closely resembled controls but still showed differences in expression levels of marker genes, suggesting that they are returning to homeostatic states (Figure 2D). Furthermore, marker analyses revealed resemblance between transitional alveolar fibroblast cell states in AT1 ablation and BHT injury, including Mt1, Mt2, Sfrp1, Saa3, Lcn2, Plac8, Acta2, and Timp1 (Figures 1F–1G, 2E–2F and S3C). Moreover, expression of some of these markers coincides with specific times after AT1 ablation (Figures 2D, 2E and S3D). Among epithelial cell populations, we found known cell types, including ciliated, club, AT2, and AT1 cells, in both control and AT1 ablated lungs (Figures 2D and S3C). Alveolar epithelial cell populations in AT1 ablated lungs showed enrichment of activated-AT2s (Lrg1, Lcn2, Retnla) and PATS on day-3 and day-6, respectively. In contrast, day-10 cells closely resembled that of control lungs (Figures 2D, 2G, 2H and S3E). These data suggest that upon AT1s ablation, AT2s gradually transition through activated-AT2s and PATS to regenerate lost AT1s.
Immunostaining or in situ RNA expression analysis of both transitional alveolar fibroblasts (ACTA2, SFRP1, TIMP1, Saa3, Gas6) and PATS (SFN, LGALS3) markers on sections collected from control, and AT1 ablation (day-6, 10, 60) further confirmed scRNA-seq findings (Figures 2I–L and S3F–J). Quantification of markers revealed transitional state numbers peaked between day-3 and day-6 and they were either decreased or completely lost at later times (Figures 1J, L and S3H). Trichrome staining on control and AT1 ablated lungs showed strong ECM deposition on day-6 but resolved by day-28, indicating transient and reversible fibrosis after AT1 ablation (Figure S3I). These findings were further validated using another AT1-specific creER mouse line (Hopx-creER;R26R-DTR) (Figure S3K).
Integrated single cell transcriptome analyses reveal pathways and temporal dynamics of transitional states.
Above data suggest striking similarities in cellular responses and structural remodeling of alveolar sacs after BHT injury and AT1 ablation. To uncover molecular underpinnings of the cellular responses, we integrated scRNA-seq data from BHT injury, AT1 ablation and previously described bleomycin induced lung injury (Figure 3A)33. Integration of mesenchymal cells revealed all known cell types and identified transitional alveolar fibroblasts. Significantly, marker expression and gene set enrichment analyses revealed that transitional alveolar fibroblasts are specifically found in injured but not control lungs across all datasets (Figures 3B, 3C and S4A). Interestingly, we found three distinct gene expression patterns within transitional alveolar fibroblasts, which correlated with temporal dynamics associated with scRNA-seq data obtained from days 3, 6, and 10 following AT1 ablation. Specifically, cells collected at day-3 after AT1 ablation showed enrichment of Plac8, Sfrp1, Gas6, and Lcn2. By contrast, Runx1, Spp1, Timp1, Acta2, Cthrc1, and Piezo2 transcripts were enriched in cells collected on day-6, at which time tissues undergo significant remodeling (Figures 3B–E, S4A, and Table S1). Immunostaining for RUNX1 and ACTA2 on sections from day-6 post AT1 ablation and BHT-induced injury validated these findings (Figure 3F). To assess the dynamics of fibroblasts, purified alveolar fibroblasts were cultured in serum-free medium with and without TGFβ1 and analyzed at different times (Figure 4G). Immunostaining revealed dynamic changes in RUNX1, SFRP1, ACTA2, TIMP1, and LIF expression in cultured cells (Figures 4H and S4B). Specifically, LIF and SFRP1 showed high expression in serum-free conditions but were downregulated after TGFβ treatment, whereas ACTA2 showed an opposing pattern. Interestingly, RUNX1 expression was low in controls but significantly increased upon TGFβ treatment (Figures 4H and S4B). None of these markers, except PDGFRA were found in freshly isolated alveolar fibroblasts. Further, cells from AT1 ablation day-10 resembled that of control alveolar fibroblasts, suggesting their return to normal. To test this, we traced the fates of Acta2+/Runx1+ fibroblasts, we administered tamoxifen to BHT injured Acta2-creER;R26R-tdTomato mice at a time window that expresses high levels of ACTA2 (Figure S4C). Lungs harvested on BHT day-7 revealed tdT-expression specifically in ACTA2+/RUNX1+ but not in LIF+ cells, indicating that our strategy labeled ACTA2+/RUNX1+ cells (Figure S4D–G). Immunostaining and quantification for ACTA2 and RUNX1 on BHT day-20 revealed that lineage-labeled cells lost ACTA2 and RUNX1 but retained PDGFRA expression (Figure S4E–G). These data indicates that ACTA2/RUNX1+ fibroblasts returned to normal alveolar fibroblasts. These findings are consistent with previous studies41. Based on the temporal cellular trajectories of alveolar fibroblast subsets, we classified them as Sfrp1+, Runx1+ and returning alveolar fibroblasts (Figures 3A–H, S4A–G, and Table S1).
Figure 3. Integrated single cell transcriptome analyses from different lung injury models reveal pathways and temporal dynamics of transitional states.

A, Schematic showing integration of mesenchymal cells after BHT injury (Figure 1F), AT1 ablation (Figure 2D), and bleomycin injury from Tsukui et al. 2020. B, UMAPs of mesenchymal cells after integration and re-clustering. Individual time points from respective data sets depicted on right. C, Dot plot showing mesenchymal cell population specific markers, corresponding to cell populations in 3B. D, Violin plots show Runx1 expression in indicated populations. E, UMAP shows Runx1 enrichment in mesenchymal cell populations. F, Immunostaining for RUNX1, ACTA2, and LEL in control, day-6 AT1 ablation, and BHT injury. Scale bars: 50μm. G, Schematic shows timeline for alveolar fibroblast culture and TGFβ treatment. H, Immunostaining for LIF, ACTA2, and RUNX1 in fibroblast culture collected at indicated days following TGFβ treatmant. Scale bars: 100μm. I, Violin plot shows ECM enrichment score in indicated cell populations. ***p <2.2e-14, ANOVA. J, Immunostaining for pro-COL1A1 and ACTA2 in controls, day-6 BHT and AT1 ablation. Scale bars: 50μm. K, Percentage of pro-COL1A1 co-expression in ACTA2+ cells. n=3 mice. Data are presented as mean±SEM. **p=0.003 (left graph) and **p=0.004, unpaired two-tailed t-test. L, Integration of epithelial cells from BHT injury and AT1 ablation. UMAPs show epithelial cells from different conditions. M, Dot plot shows genes enriched in epithelial cells corresponding to cell populations shown in 3L. In all panels single channel images are from boxed regions. See also Figure S4 and S5.
Figure 4. Ectopic induction or accumulation of PATS leads to organ-wide fibrosis.

A, Experimental schematic of pneumonectomy (PNX) followed by AT1 ablation. B, Immunostaining for SFN, ACTA2, and LEL in PNX alone or PNX+AT1 ablation. Scale bars: 50μm. C, Quantification of SFN+ cell numbers in PNX and PNX+AT1 ablated mice. n=3 mice. **p=0.002, unpaired two-tailed t-test. 40x images were used for quantification. D, Immunostaining for PECAM-1, ACTA2, and SCGB1A1 in PNX or PNX+AT1 ablation. Scale bar: 100μm. E, Immunostaining for SFRP1, ACTA2, and TIMP1 in PNX+AT1 model. Scale bar: 50μm. F, Representative breathing waveforms from whole body plethysmography in control and AT1 ablation. Red asterisk (*) denotes an example of a breath. G, Whole-body plethysmography of PNX and PNX+AT1 ablation mice at room air or under hypoxic/hypercapnic challenge. n=8 mice baseline, n=4 challenge. **p=0.0021. two way-ANOVA followed by Sidak’s comparison test. H, Schematic of Mdm2 deletion in AT2s with tamoxifen administration in a Sftpc-CreER;Mdm2fl/fl mice followed by tissue analysis. I, UMAPs show alveolar epithelial populations in integrated data from Sftpc-CreER;R26R-tdTomato;Mdm2fl/fl day-8, BHT and control mice. Feature plots show enrichment of indicated genes on right. J, Dot plot showing genes enriched in epithelial cell populations. K, Immunostaining for ACTA2, Sftpc-tdT, and SFN in control and AT2-specific Mdm2 deleted mice. Scale bars: 100μm. L, Immunostaining for SFRP1, ACTA2, and TIMP1 in indicated mouse models. Scale bar: 50μm. M, Immunostaining for ACTA2 and RUNX1 highlighting individual stellate fibroblasts (left) and fibrotic foci (right). Scale bars: 50μm. In all graphs data are presented as mean±SEM. In all panels single channel images are from boxed regions. See also Figure S6A–N.
Pathway enrichment analysis revealed enrichment of TGFβ, interleukin, ECM organization and β1-integrin signaling in transitional alveolar fibroblasts (Figure S4H and S4I). Quantitative analyses of ECM related transcripts (ECM score) revealed enrichment of multiple structural components, affiliated proteins, and regulators of ECM organization in Runx1+ alveolar fibroblasts compared to other subsets and alveolar fibroblasts11 (Figures 3I and S4J). Immunostaining and quantification for pro-COL1A1 further confirmed these findings (Figures 3J and 3K). Transcription factor regulatory activity analysis (TF regulon) using SCENIC, revealed distinct transcriptional programs in different alveolar fibroblasts42 (Figure S4K). For example, RUNX1, CREB3, EZH2, FOXP1, and NFATc1 showed high regulon activity in Runx1+ alveolar fibroblasts compared to other fibroblasts (Figure S4K).
Next, integrative analysis of scRNA-seq from BHT injury and AT1 ablation models revealed distinct cell state transitions in alveolar epithelial cells that also correlated with temporal dynamics observed at different times after AT1 ablation (Figures 3L–M, S4A, and Table S2). Specifically, cells from AT1 ablation day-3 showed significant enrichment of activated and proliferating-AT2s, while day-6 cells showed enrichment of activated, proliferating-AT2s, and PATS. Finally, cells collected on day-10 closely resembled that of AT1 and AT2s from control lungs, suggesting that epithelial cells had reached homeostatic states by this time (Figures 3L–M and S5A). Moreover, TF regulon predicted distinct transcriptional programs in PATS compared to other epithelial cell states (Figure S5B).
Further, to predict cell-cell communication between epithelial and mesenchymal cells we used CellChat and uncovered strong sending and receiving activity between epithelial and fibroblasts including transitional states43. Of these, Runx1+ alveolar fibroblasts and AT2s showed highest sending and receiving activity, respectively (Figures S5C and S5D). Of note, Runx1+ alveolar fibroblasts showed second highest receiving activity next to AT2s, indicating a two-way communication from and to Runx1+ alveolar fibroblasts (Figure S5C and S5D). Together, epithelial and alveolar fibroblast transitional states showed distinct TF regulons and cell-cell communication through multiple signaling pathways.
Ectopic induction or accumulation of PATS leads to organ-wide fibrosis
Data from different injury models point to a unified model in which PATS that emerge after injury is a source for paracrine signals that control alveolar fibroblast states. To test this, we modulated the abundance of PATS or ectopically induced them in alveolar niches. First, to increase the abundance of PATS, we used a sequential double injury model. Specifically, we performed pneumonectomy (PNX), to induce neo-alveologenesis, followed by AT1 ablation as described above. We timed these two models such that each induced PATS in a narrow time window with the intent to accumulate many of these cells in alveolar niches (Figure 4A). Mice that underwent PNX alone served as controls (Figure S6A). Immunostaining for SFN revealed a significant accumulation of PATS in double injury compared to PNX alone (Figure 4B and 4C). Significantly, we found numerous alveolar fibroblasts expressing SFRP1, TIMP1, and ACTA2 throughout the lung (Figure 4B–E). In contrast, we detected very few peripherally located PATS and ACTA2+ fibroblasts in PNX alone (Figures 4B–D, and S6B). Trichrome staining revealed extensive collagen deposition, disorganization of alveolar tissue, and extensive fibrosis in double injury model (Figure S6C). Consistent with these findings, whole body plethysmography revealed the inability to increase tidal volume in double injury model, indicative of pulmonary fibrosis (Figure 4F and 4G).
Second, to ectopically induce PATS, we activated TP53 signaling that is known to emerge transiently during alveolar epithelial repair30,32. We used Sftpc-creER;Mdm2fl/fl;R26R-tdTomato (hereafter referred to as Sftpc-Mdm2-tdT) mice, in which administration of tamoxifen concomitantly induces expression of tdTomato and deletes Mdm2, a known negative regulator of TP53 protein levels. Sftpc-creER;R26R-tdTomato mice served as controls (Figures 4H and S6D). As expected, immunostaining revealed a significant number of tdT+ TP53+ cells in Sftpc-Mdm2-tdT mice but not in controls (Figure S6E and S6F). To map cellular dynamics following Mdm2 deletion, we performed scRNA-seq on cells from Sftpc-Mdm2-tdT mice collected on day-8 post tamoxifen administration (Figure S6D). ScRNA-seq revealed cell clusters similar to activated-AT2s, proliferating-AT2s, and PATS found in BHT injured lungs (Figure 4I–4J, S6G, and Table S3). Similarly, we found cells resembling alveolar fibroblasts in Sftpc-Mdm2-tdT mice (Figure S6H and Table S4). Immunostaining and quantification revealed the presence SFN and CLDN4 expressing PATS, as early as day-6 after Mdm2 deletion (Figures 4K, and S6I–J). Of note, we observed a significant decrease in tdT+ cells in Sftpc-Mdm2-tdT mice compared to controls (Figure S6K). TUNNEL staining revealed no co-expression of TUNNEL and tdT suggesting elimination of cells via other mechanisms such as live cell extrusion. Indeed, we found lineage labeled (tdT+) cells in the alveolar lumen suggesting their elimination from the epithelium (Figure S6L). Immunostaining for SFRP1, TIMP1, RUNX1, and ACTA2 revealed numerous cells expressing these markers in Sftpc-Mdm2-tdT mice (Figures 4K–M, S6M and S6N). These mice developed extensive pan-lobular fibrosis by day-10 post tamoxifen administration. Despite the loss of PATS, ACTA2+ fibroblasts remain in these regions, suggesting that PATS are sufficient for ACTA2+ alveolar fibroblasts induction but not necessary for their maintenance (Figures 4H–M and S6D–N).
Loss of epithelial and alveolar fibroblast transitional states lead to tissue simplification and emphysema
Above data indicated that accumulation or ectopic emergence of PATS is sufficient to induce fibrosis and alveolar remodeling. To test the consequences of blocking PATS-mediated epithelial repair, we devised a repeat AT1 ablation strategy by sequential tamoxifen and DT administration to Ager-DTR mice in two successive rounds within a 5-day time window (Figures 5A and S6O). We chose this time window to target PATS that emerge and begin to express Ager after first round of ablation. Quantification of SFN+ cells on sections collected a day after second round of ablation revealed significant decrease in PATS numbers (Figure S6O). Immunostaining for SFN and ACTA2 revealed fewer transitional states in epithelium and alveolar fibroblasts in day-6 post second round of ablated lungs compared to single AT1 ablated lungs (Figure S6P). Since Ager is expressed in both late PATS and AT1s, the above repeat AT1 ablation model also ablates AT1s along with PATS. Therefore, a second strategy was devised in which, we used adeno-associated virus (AAV) mediated PATS ablation in Ager-DTR mice. Briefly, we first ablated AT1s followed by administration of AAV5 that specifically targets AT2s to express DTR44. Since PATS arise from AT2s, our strategy would lead to loss of PATS (and AT2s) but not AT1s after a second round of DT administration (Figure 5C). Following AAV5-GFP (control) or AAV5-DTR virus administration to Ager-DTR mice on day-4 post DT treatment, we assessed the specificity of AAV-mediated transgene expression in AAV5-GFP administered lungs by immunostaining for GFP, SFTPC, LEL, DC-LAMP, and SFN (Figures 5C and S6Q–S). Our data revealed transgene expression specifically in PATS and AT2s but not in AT1s on day-2 post AAV5-GFP virus administration (Figure S6R). As expected, we observed loss of PATS on day-2 following second round of DT administration in Ager-DTR mice that received AAV5-DTR (Figure S6T). Further, on day-11 we found defective alveolar repair in AAV5-DTR administered lungs compared to controls (Figure 5D). Significantly, we found an increase in air spaces, as revealed by MLI analyses, in both ablation models compared to their respective controls (Figures 5E and 5F). Consistent with air space enlargement, whole body plethysmography revealed increased expiratory time (Te) and an overall “obstructive” pattern, characteristic of emphysema in repeat AT1 ablation model (Figures 5G and 5H).
Figure 5. Loss of transitional alveolar epithelial or fibroblasts leads to tissue simplification and emphysema.

A, Schematic shows repeat AT1 ablation. B, Immunostaining for AGER, ACTA2, and hydrazide in control and after repeated AT1 ablation Scale bars: 100μm. C, Experimental design for AT1 ablation followed by intranasal administration of AAV5-DTR or AAV5-GFP (control) virus, DT injection and tissue collection. D, Immunostaining for LEL and ACTA2 in AT1 ablated mice infected with AAV5-GFP (control) or AAV5-DTR (ablation) followed by DT administration. Scale bars: 100μm. E, Quantification of MLI in control and repeat AT1 ablation. n=3 mice. ***p=0.007 unpaired two-tailed t-test. F, Quantification of MLI in AT1 ablation + AAV5-GFP (control) or AT1 ablation + AAV5-DTR virus infected lungs. n=3 mice. ***p<0.001, unpaired two-tailed t-test. G, Representative breathing waveforms from whole body plethysmography in control (top) and repeat AT1 ablation (bottom). Asterisk indicates an inspiration in individual breaths. Arrows indicate prolonged expiratory phase in mice with repeated AT1 ablation. H, Whole-body plethysmography of control and repeated AT1 ablation mice at room air or under hypoxic/hypercapnic challenge. n=6 mice baseline, n=3 challenge. ****p<0.0001, two way-ANOVA followed by Sidak’s comparison test. I, Experimental design for ablation of transitional alveolar fibroblasts in Acta2-creER;R26-DTA mice after BHT-induced injury. J, Immunostaining for LEL, ACTA2, and hydrazide in controls and following ablation of transitional alveolar fibroblasts. Scale bars: 50μm. K, Quantification of MLI in indicated conditions. n=3 mice. **p=0.006, unpaired two-tailed t-test. DAPI stains nuclei in all panel. In all graphs data are presented as mean±SEM. See also Figure S6O–T.
Next, to test the requirement of Runx1+ alveolar fibroblasts, we sequentially administered BHT and tamoxifen to Acta2-creER;R26R-DTA mice (here after referred to as Acta2-DTA) to induce lung injury followed by Acta2+Runx1+ fibroblasts ablation (Figures 5I and S4E). Mice that did not receive tamoxifen served as controls. Immunostaining and MLI measurements of lungs collected on BHT day-20 revealed significant enlargement of alveolar spaces in ablated lungs compared to controls, suggesting defective alveolar repair (Figure 5J and 5K). Together, our data suggest that epithelial and alveolar fibroblast transitional states are required during repair and that their loss leads to alveolar simplification.
RUNX1 is essential and sufficient to drive alveolar fibroblasts conversion to Runx1+ alveolar fibroblasts
Above data revealed RUNX1 is dynamically expressed in transitional alveolar fibroblasts in response to injury in vivo and TGFβ treated alveolar fibroblasts ex vivo. To test its role in fibroblast transitions, we performed genetic deletion and pharmacological inhibition of RUNX1 ex vivo. For genetic modulation, alveolar fibroblasts purified from Runx1fl/fl mice were cultured in serum-free conditions, infected with control (Ad5-GFP) or cre (Ad5-cre-GFP) virus and treated with TGFβ (Figure 6A). Co-immunostaining for RUNX1 and ACTA2 revealed high expressed in control cells, whereas ACTA2 expression is absent in RUNX1 deleted cells treated with TGFβ (Figure 6B). Furthermore, RUNX1 inhibitor (Ro5–3335) treatment blocked ACTA2 expression in alveolar fibroblasts in the presence of TGFβ (Figure 6C and 6D). These data were further corroborated by qRT-PCR analyses for Runx1+ alveolar fibroblast markers including Timp1, Vcan, and Spp1. In contrast, Lif and Sfrp1 expression was significantly increased after RUNX1 deletion, indicating that RUNX1 regulates distinct transitional alveolar fibroblasts (Figure 6E). Moreover, ectopic expression of RUNX1 was sufficient to induce expression of ACTA2 in alveolar fibroblasts even in the absence of TGFβ (Figure 6F and 6G).
Figure 6. RUNX1 is essential and sufficient to drive transitional alveolar fibroblasts ex vivo.

A, Schematic shows culture of fibroblasts from Runx1fl/fl mice, followed by administration of Adenoviral GFP (control) or Cre-GFP, and TGFβ treatment. B, Immunostaining for GFP, ACTA2, and RUNX1.. Scale bar: 100μm. C, Experimental design for TGFβ treatment alone or with Ro5535. D, Immunostaining for RUNX1, ACTA2, and PDGFRA on TGFβ treated fibroblasts with or without Ro5535 inhibitor. Scale bars: 100μm. E, qPCR for indicated genes in control and Runx1-deleted fibroblasts after TGFβ treatment. Data are presented as mean ± SEM. n=3 mice/condition and average of 2 technical replicates, ns-not significant, *p<0.05, **p<0.01, ****p<0.0001, two-tailed unpaired Student’s t-test. F, Experimental schematic shows alveolar fibroblasts treated with AAV5-Runx1-FLAG virus. G, Immunostaining for PDGFRA, ACTA2, and FLAG-tag. Scale bars: 100μm. B, D, G- single channel images are from boxed regions.
Genetic or pharmacological disruption of RUNX1 blocks lung fibrosis and leads to ECM reorganization and tissue simplification
To assess whether RUNX1 is essential for fibroblast transition and alveolar repair in vivo, we deleted RUNX1 in Pdgfra-expressing fibroblasts. For this, we administered tamoxifen to Pdgfra-creER;Runx1fl/fl mice (hereafter referred to as Pdgfra-RUNX1) followed by BHT injury, tissue collection, and analyses on day-6 and day-15 (Figures 7A and S7A). Runx1fl/fl mice that received tamoxifen and BHT served as controls. Co-immunostaining and quantification of cell numbers revealed a decrease in the number of Runx1+ (ACTA2, RUNX1, LGALS1, TIMP1) but not Sfrp1+ (SFRP1, LIF) alveolar fibroblasts in Pdgfra-RUNX1 mice compared to controls on day-6 post BHT injury (Figures 7B and 7C and S7B–F). Interestingly, immunostaining for SFN revealed PATS presence in both control and RUNX1 deleted lungs, suggesting that RUNX1 blockade abrogates PATS driven transition of alveolar fibroblasts (from Sfrp1+ to Runx1+) (Figure S7G). Significantly, staining for LEL, hydrazide and ELN, and MLI measurements revealed enlargement of alveolar sac in Pdgfra-RUNX1 mice compared to controls on day-15 post injury (Figure 7D and 7E and S7H). Such change was not apparent on day-6, suggesting that loss of RUNX1, TIMP1 and ACTA2 preceded structural remodeling of alveoli (S7A–F). In addition, pharmacological inhibition of RUNX1 abrogated ACTA2 expression in AT1 ablated lungs compared to controls even in the presence of SFN-expressing PATS (Figure 7F and 7G, and S7I). Furthermore, lungs treated with RUNX1 inhibitor after AT1 ablation leads to a slight enlargement, albeit statistically insignificant, of alveolar sacs (Figure 7H).
Figure 7. Loss of RUNX1 blocks lung fibrosis and leads to ECM disorganization and tissue simplification.

A, Experimental schematic of Runx1 deletion followed by BHT administration in Runx1fl/fl and Pdgfra-CreER/Runx1fl/fl mice. B, Immunostaining for SFRP1, ACTA2 and TIMP1 on BHT day-6 injured controls and Pdgfra-CreER/Runx1fl/fl mice. Insets represent individual channels indicated by white dashed boxes. Scale bar: 50μm. C, Quantification of SFRP1+ and TIMP1+ cells in field of view in control and Pdgfra-CreER;Runx1fl/fl mice on day-6 post BHT injury. n=3 mice **p=0.003, unpaired two-tailed t-test. 40x images were used for quantification. D, Immunostaining for LEL, ACTA2, and hydrazide (left side), and ELN and hydrazide (right) on controls and Runx1 deleted lung collected 15-days after BHT injury. Scale bar: 50μm. Images on right are presented as a z-projection over approximately 25μm. E, Quantification of MLI in Runx1fl/fl and Pdgfra-CreER/Runx1fl/fl mice on BHT day-15. n=3 mice, *p=0.0269, unpaired two-tailed t-test. F, Workflow of Ro5–335 intranasal administration to AT1 ablated lungs and tissue collection at day-6. G, Immunostaining for AGER, ACTA2, and SFN in control or Ro5–335 treated mice after AT1 ablation. Scale bar: 50μm. H, Quantification of MLI in control or Ro5–335 treated mice after AT1 ablation. n=3 mice/condition. I, Schematic representation of LOX (lysyl oxidase) secretion and ECM crosslinking. J, LOX activity in wild-type and Runx1fl/fl cultured fibroblasts, treated with TGFβ, Adeno-GFP, Adeno-Cre-GFP, or Ro5–335. n=3 mice, average of 3 technical replicates, ns-not significant, *p<0.05, **p<0.01, ****p<0.0001, two-tailed unpaired Student’s t-test. DAPI stains nuclei in all panels. Single channel images are from boxed regions. In all graphs are presented as mean ± SEM. See also Figure S7A–I.
Above integrated scRNA-seq data revealed significant enrichment of Runx1, numerous ECM components, their regulators including Lox (Lysyl oxidase) and other ECM cross-linking genes in Runx1+ alveolar fibroblasts. This led us to test whether blockade of Runx1+ alveolar fibroblasts induction observed in RUNX1 deleted fibroblasts influenced ECM cross-linking activity (Figure 7I). We measured LOX activity in cell lysates collected from RUNX1 deleted or inhibited cells cultured with or without TGFβ. We found a significant decrease in LOX activity in RUNX1 deleted or inhibitor treated cells compared to controls even in the presence of TGFβ (Figure 7J). No change in LOX activity was seen in control conditions lacking TGFβ, irrespective of RUNX1 modulation. Significantly, above data indicate that fibroblasts cultured in the absence of TGFβ resemble the Sfrp1+ alveolar fibroblasts seen in vivo (assessed by presence of SFRP1 and LIF and lack of ACTA2). This suggests that it is the Runx1+, but not Sfrp1+ alveolar fibroblasts that possesses the ECM crosslinking activity.
DISCUSSION
Restoration of cell types, cell numbers, and their organization following repair after injury is essential for maintaining organ physiology1,4. Here, we show that lung repair-injury involves emergence of molecularly distinct alveolar fibroblast transitional states that coincide with previously identified epithelial transitional states30–32. Moreover, the outcome of repair depends on coordinated activity of these transitional states. Our data show that imbalance in repair-associated transitional states have significant consequences, leading to tissue disorganization and diminished organ function. Time series scRNA-seq data from AT1 ablated lungs allowed us to stratify cellular trajectories during injury-repair and led us to identify distinct transitional alveolar fibroblasts. Specifically, we identified stage-specific molecularly distinct transitional alveolar fibroblasts that signal to overlaying epithelium and control tissue topology by orchestrating ECM composition and organization. Recent work using scRNA-seq from bleomycin injured lungs have suggested emergence of distinct fibroblast states40,45. Future work will focus on comparing these fibroblast states with Sfrp1+ and Runx1+ alveolar fibroblasts that we describe in this study40,45. Interestingly, loss of AT1s alone is sufficient to induce all subsets of alveolar fibroblasts. This model points to a tissue monitoring mechanism in which AT1 loss is sensed by the normal alveolar fibroblasts, which convert to transitional alveolar fibroblasts. Future studies will focus on identifying the molecular triggers that induce alveolar fibroblasts conversion to Sfrp1+ alveolar fibroblasts following AT1s loss. Further, CellChat analyses predicts both autocrine and paracrine communication between epithelial and alveolar fibroblast transitional states. Thus, the molecularly distinct subsets of transitional states identified here illustrate the spatial and temporal orchestration of cellular trajectories and associated signaling cascades that control tissue repair.
It is generally assumed that the Acta2-expressing fibroblasts (commonly referred to as myofibroblasts) that appear during alveolar injury-repair are pathological, in part because of their abnormal accumulation in fibrotic diseases. Based on this assumption, many translational studies are focused on eliminating Acta2-expressing cells to treat fibrotic lung diseases. However, our data show that blocking the transition of Sfrp1+ to Runx1+ alveolar fibroblasts during injury-repair leads to alveolar simplification. Furthermore, loss of Runx1 blocks the induction of Runx1+ alveolar fibroblasts, ultimately leading to a decrease in the level of ECM components and their assembly, as revealed by a reduction in ECM cross-linking activity. This suggests that while the abnormal accumulation of Acta2+/Runx1+ alveolar fibroblasts, as seen in pulmonary fibrosis, is pathological, these transient cell states are in fact, essential for reconstructing the fibroelastic “scaffold” of the lung and for proper repair of damaged tissues. Therefore, future therapeutic studies need to focus on blocking the mechanisms that drive the uncontrolled proliferation or accumulation of Acta2+/Runx1+ alveolar fibroblasts, rather than inhibiting their formation altogether. Molecularly, we currently do not know the mechanisms by which RUNX1 controls the expression of ECM components in Runx1+ alveolar fibroblasts. Previous studies in cartilage, kidney, skin, and cancers have revealed that RUNX1 partners with SMAD proteins to directly bind promoters and enhancers of multiple cell state specific genes related to cell proliferation and migration46–48. Future studies need to focus on testing whether RUNX1 directly or indirectly controls the expression of genes associated with transitional alveolar fibroblasts dynamics and/or ECM formation and assembly.
Significantly, our findings have direct relevance to the pathogenesis of emphysema and fibrosis in the human lung. Although emphysema and fibrosis are considered two distinct types of lung diseases, they share common etiological factors, such as smoking and other environmental exposures, all known to cause lung injury. Additionally, genetic predispositions in genes expressed in Runx1+ alveolar fibroblasts have been shown to cause emphysema49. Further, increasing clinical evidence indicates that these two diseases co-exist in a human lung syndrome known as combined pulmonary fibrosis and emphysema (CPFE), which may comprise about 35% of all pulmonary fibrosis cases25,50–52. Our data show that during experimental lung injury-repair, when tissues undergo transient and reversible remodeling, both alveolar sac enlargement and interstitial thickening are seen in regions neighboring each other. Significantly, we observed these two types of transient tissue remodeling in multiple injury models, including the loss of a single epithelial cell type (AT1s ablation). This suggests that partial and reversible remodeling is inherent to the repair process. It is possible that these transient events make tissues susceptible to chronic diseases when combined with environmental and/or genetic perturbations. Thus, our work provides a common cellular and molecular framework for explaining the emergence of distinct pathologies of lung fibrosis and emphysema following chronic injuries. We speculate that similar states exist in other tissues and may open therapeutic avenues for treating diseases in other organs.
Limitations of this study
Our time series scRNA-seq data from AT1 ablation allowed us to identify temporal dynamics of fibroblasts transition during alveolar repair. Our current study used Acta2-lineage tracing mouse model to trace and ablate Runx1+ alveolar fibroblasts. Future studies will need to focus on tracing and ablating Sfrp1+ alveolar fibroblasts. Further, using Runx1 knockout mice our study points to a key role for Runx1+ alveolar fibroblasts in alveolar remodeling during repair by blocking Sfrp1+ cells transition to Runx1+ alveolar fibroblasts. However, it is possible that Sfrp1+ cells in Runx1 knockout may have an altered transcriptional program (compared to normal Sfrp1+ alveolar fibroblasts), which may have exaggerated the alveolar simplification we observed in these mutants. To ablate PATS, we used either repeat AT1 ablation or AAV5 based DTR expression. However, these strategies ablates both PATS and AT1s or AT2s, respectively. Therefore, future work needs to develop PATS-specific cell ablation models.
STAR Methods
Resource availability
Lead contact
Further information and requests for resources and reagents should be directed to and will be fulfilled by the lead contact, Purushothama Rao Tata, purushothamarao.tata@duke.edu.
Materials availability
This study did not generate unique reagents.
Data and code availability
Single-cell RNA-seq data have been deposited at GEO and are publicly available as of the date of publication and accession numbers are listed in the key resources table. This paper analyzes existing, publicly available data. These accession numbers for the datasets are listed in the key resources table.
This paper does not report original code.
Any additional information required to reanalyze the data reported in this paper is available from the lead contact upon request.
KEY RESOURCES TABLE.
| REAGENT or RESOURCE | SOURCE | IDENTIFIER |
|---|---|---|
| Antibodies | ||
| Monoclonal Rat anti-RAGE/AGER | R&D systems | Cat# MAB1179, RRID:AB_2289349 |
| Polyclonal rabbit anti-Claudin4 | Thermo Fisher Scientific | Cat#36-4800 RRID:AB_2533262 |
| Polyclonal rabbit anti-p53 | GeneTex | Cat#GTX102965 RRID:AB_1952339 |
| Monoclonal mouse anti-actin α-Smooth Muscle-Cy3 | Sigma-Aldrich | Cat# C6198, RRID: AB_476856 |
| Monoclonal mouse anti-actin α-Smooth Muscle-FITC | Sigma-Aldrich | Cat# F3777 RRID: AB_476977 |
| Polyclonal rabbit anti-actin α-Smooth muscle | abcam | Cat#ab5694 RRID:AB_2223021 |
| Polyclonal goat anti-SCGB1A1 | Santa Cruz | Cat# 9772 RRID: AB_2238819 |
| Polyclonal goat anti-TIMP1 | R&D | Cat# AF980 RRID: AB_355759 |
| Polyclonal Rabbit anti-SFRP1 | Abcam | Cat# ab126613 RRID: AB_11128257 |
| Polyclonal Rabbit anti-CTHRC1 | Abcam | Cat# ab85739 RRID: AB_10712489 |
| Monoclonal rabbit anti-RUNX1/AML | Cell Signaling technology | Cat#8529 RRID:AB_10950225 |
| Polyclonal Goat anti-Human RAGE/AGER | R&D Systems | Cat# AF1145, RRID:AB_354628 |
| Polyclonal Goat anti-Integrin alpha 8 | Novus | Cat# AF4076 RRID:AB_2296280 |
| Polyclonal Rabbit anti-LGALS1 | Cell Signaling | Cat# 13888 RRID:AB_2798338 |
| Monoclonal Rat anti-LGALS3 | Cedarlane | Cat# CL8942AP RRID:AB_10060357 |
| Polyclonal DYKDDDDK tag | Proteintech | Cat# 20543-1-AP RRID:AB_11232216 |
| Polyclonal Goat tdTomato | Origene | Cat# AB8181-200 RRID: AB_2722750 |
| Monoclonal Rat Anti-CD31 | BD Biosciences | Cat# 550274 RRID:AB_393571 |
| Polyclonal Rabbit Anti-14-3-3 sigma | Thermo Fisher Scientific | Cat# PA5-95056 RRID:AB_2806862 |
| Monoclonal Rat anti-LIF | Novus | Cat# NBP2-27406 |
| Polyclonal rabbit anti-RFP | Rockland | Cat# 600-401-379 RRID:AB_2209751 |
| Polyclonal guineapig anti-LAMP3 | Synaptic systems | Cat#391 005 RRID:AB_2713987 |
| Polyclonal Rabbit anti-ELN (Elastin) | Kind gift from Dr. Robert Mecham (Washington University, USA) | N/A |
| Polyclonal rabbit anti-Collagen 1, alpha 1 propeptide | Phosphosolutions | Cat# 321-COLP RRID:AB_2492060 |
| Polyclonal goat anti-DTR/HB-EGF | R&D systems | Cat# AF259-NA RRID:AB_354429 |
| LEL-Fluorescein | Vector Laboratories | Cat# FL-1171 RRID:AB_2307440 |
| LEL-DyLight® 649 | Vector Laboratories | Cat#DL-1178 |
| Alexa Fluor 594 donkey anti-goat IgG | Thermo Fisher Scientific | Cat# A11058, RRID:AB_2534105 |
| Alexa Fluor 488 donkey anti-goat IgG | Thermo Fisher Scientific | Cat# A11055 RRID:AB_2534102 |
| Alexa Fluoro 488 Donkey anti-rabbit IgG | Thermo Fisher Scientific | Cat# A21206 RRID:AB_141708 |
| Alexa Fluoro 647 Donkey anti-rabbit IgG | Thermo Fisher Scientific | Cat# A31573 RRID:AB_2536183 |
| Alexa Fluoro 647 Donkey anti-goat IgG | Thermo Fisher Scientific | Cat# A21447, RRID:AB_141844 |
| Alexa Fluoro 488 Donkey anti-rat IgG | Thermo Fisher Scientific | Cat# A21208, RRID:AB_141709 |
| Alexa Fluoro 594 Donkey anti-rat IgG | Thermo Fisher Scientific | Cat# A2109, RRID:AB_2535795 |
| Alexa Fluor 594 goat anti-rabbit IgG | Thermo Fisher Scientific | Cat# A21207, RRID:AB_141637 |
| Alexa Fluor 647 goat anti-rat IgG | Thermo Fisher Scientific | Cat# A21247, RRID:AB_141778 |
| Alexa Fluor 647 goat anti-rabbit IgG | Thermo Fisher Scientific | Cat# A21245, RRID:AB_2535813 |
| CD45 microbeads, mouse | Miltenyi Biotec | Cat# 130-052-301 RRID:AB_2877061 |
| Anti-CD31 microbeads | Miltenyi Biotec | Cat# 130-097-418 RRID:AB_2814657 |
| Anti-CD140a microbeads | Miltenyi Biotec | Cat# 130-101-547 |
| Anti-CD326 (EpCAM) MicroBeads | Miltenyi Biotec | Cat# 130-105-958 |
| Anti-CD146 (LSEC) MicroBeads | Miltenyi Biotec | Cat# 130-092-007 |
| Weigert′s Iron Hematoxylin Set | Millipore Sigma | Cat#HT1079 |
| Trichrome Stain (Masson) Kit | Millipore Sigma | Cat#HT15 |
| Bacterial and virus strains | ||
| NEB Stable Competent E. coli | NEB | Cat# C3040 |
| Adeno-Cre-GFP | Signagen | Cat# SL100706 |
| Adeno-GFP | Signagen | Cat# SL100708 |
| Biological samples | ||
| N/A | N/A | N/A |
| Chemicals, peptides, and recombinant proteins | ||
| DMEM | Corning | Cat# 25-500 |
| Antibiotic-Antimycotic (100X) | Thermo Fisher Scientific | Cat# A5955-100ML |
| Penicillin/Streptomycin | Gibco | Cat# 15140 |
| FBS | HyClone products (Cytiva) | Cat# SH30396.03 |
| Tamoxifen | Sigma-Aldrich | Cat# T5648 |
| Dispase | Corning | Cat# 354235 |
| DNase I | Thermo Fisher Scientific | Cat# 10104159001 |
| Collagenase type I | Gibco | Cat# 17100-017 |
| Butylated hydroxytoluene | Sigma-Aldrich | Cat# W218405 |
| TruStain FcX | Biolegend | Cat# 422302 |
| Diphtheria toxin | Millipore | Cat# 322326 |
| Sucrose | Sigma-Aldrich | Cat# S9378 |
| Citrate Buffer, pH 6.0 (10X) | Sigma-Aldrich | Cat# C9999 |
| DAPI | Sigma-Aldrich | Cat# D9542 |
| Fluoromount-G, with DAPI | Thermo Fisher Scientific | Cat# 00-4959 |
| N-Acetyl-L-cysteine (NAC) | Sigma-Aldrich | Cat # A9165 |
| B-27 Supplement (50X) | Thermo Fisher Scientific | Cat # 17504044 |
| N-2 Supplement (100X) | Thermo Fisher Scientific | Cat # 17502048 |
| Glutamax | Thermo Fisher Scientific | Cat # 35050061 |
| HEPES (1M) | Thermo Fisher Scientific | Cat # 15630080 |
| Antibiotic-Antimycotic (Anti-Anti) (100X) | Thermo Fisher Scientific | Cat # A5955-100ML |
| Recombinant Mouse TGF-β1 | BioLegend | Cat# 763102 |
| Recombinant Mouse PDGF-AA (carrier-free) | BioLegend | Cat#776306 |
| Bovine Serum Albumin (BSA) | Sigma | Cat # A7906 |
| PBS | Gibco | Cat# 20012027 |
| Ro 5-3335 | Tocris | Cat#4694 |
| Physiologic Saline | Henry Schein | Cat# 002477 |
| OCT Compound | Fisher Scientific | Cat# 23-730-571 |
| Paraformaldehyde | Sigma-Aldrich | Cat# P6148 |
| Pierce™ 16% Formaldehyde (w/v), Methanol-free | Thermo Fisher Scientific | Cat#28908 |
| Proteinase K, recombinant, PCR grade | Thermo Fisher Scientific | Cat#E00491 |
| tRNA | Roche | Cat#10109495001 |
| dNTP | Thermo Fisher Scientific | Cat#10297018 |
| Sodium trichloroacetate, 97% | Alfa Aesar | Cat#A17004 |
| Glycerol | Millipore Sigma | Cat#G5516 |
| Low melting agarose | Seaplaque | Cat# 50100 |
| Triton X-100 | Sigma-Aldrich | Cat# X100 |
| Chromium Next GEM Single Cell 3’ Kits v3.1 | 10x Genomics | Cat# 1000269 |
| Ethylenediaminetetraacetic acid disodium salt dihydrate (EDTA) | Sigma-Aldrich | Cat# E5134 |
| Tris pH 7.4 | Thermo Fisher Scientific | Cat# J60202.K2 |
| Heparin ammonium sulfate from porcine intestinal mucosa | Sigma-Aldrich | Cat# H6279 |
| T4 DNA Ligase | NEB | Cat# M0202 |
| RNaseOUT | ThermoFisher | Cat# 10777019 |
| NxGen® phi29 DNA Polymerase | ThermoFisher | Cat# 30221-2 |
| Grace Bio-Labs SecureSeal™ hybridization chambers | Sigma-Aldrich | Cat# GBL621505-20EA |
| Hydrazide-CF647 | Sigma-Aldrich | Cat# SCJ4600046 |
| NEBuilder HiFi DNA Assembly Master Mix | New England Biolabs | Cat# E2621L |
| XbaI | New England Biolabs | Cat# R0145S |
| EcoRI | New England Biolabs | Cat# R0101S |
| Polyethylenimine, Linear, MW 25000, Transfection Grade | Polysciences | Cat#23966 |
| Optiprep Density Gradient Medium | Sigma-Aldrich | Cat# D1556 |
| PEG8000 | Promega | Cat# V3011 |
| Sodium citrate dihydrate | Sigma-Aldrich | Cat# W302600 |
| Ammonium sulfate | Sigma-Aldrich | Cat# A4418-5006 |
| Citric Acid | Sigma-Aldrich | Cat#251275 |
| 10% Pluronic Acid | Gibco | Cat#24040-032 |
| Sodium Bicarbonate (7.5%) | Gibco | Cat#25080-094 |
| Ficoll PM-400, powder | GE Healthcare Life Sciences | Cat# 15260-037 |
| Skarosyl, sodium salt solution | Sigma-Aldrich | Cat# L7414-50ML |
| Ultrapure 1M Tris-HCl, pH 7.5 | ThermoFisher Scientific | Cat# 15567-027 |
| 1M-Tris-HCl, pH 8.0 (Trizma) | Sigma-Aldrich | Cat#T2694-1L |
| Pierce DTT (Dithiothreitol) | ThermoFisher Scientific | Cat#20291 |
| Maxima H Minus RTase | ThermoFisher Scientific | Cat#EP0753 |
| Klenow fragment (3’→5’ exo minus | New England Biolabs | Cat#M0212L |
| Terra PCR Direct Polymerase | Takara | Cat#639271 |
| QX200 Droplet generation oil | Bio-Rad | Cat# 186-4006 |
| Perfluorooctanol (PFO), 97% | Sigma-Aldrich | Cat# 370533-25G |
| 20% SDS | Quality Biological | Cat# 351-066-721 |
| Tween 20 | Bio-Rad | Cat# 170-6531 |
| SSC, 20X | Sigma-Aldrich | Cat# S6639 |
| Advantage UltraPure PCR Deoxynucleotide Mix | Clontech | Cat# 639125 |
| NxGen RNase Inhibitor | Lucigen | Cat# 30281-1 |
| Maxima RT H minus Reverse Transcriptase, 200 U/mL | ThermoFisher Scientific | Cat# EP0752 |
| Exonuclease I, 20 U/mL | ThermoFisher Scientific | Cat# EN0582 |
| 2X Kapa HiFi HotStart ReadyMix | Kapa Biosystems | Cat# KK2601 |
| AMPure XP Beads | Beckman Coulter | Cat# A63880 |
| Nextera XT DNA sample preparation kit, 24 samples | illumina | Cat# FC-131-1024 |
| Critical commercial assays | ||
| N/A | N/A | N/A |
| Deposited data | ||
| Single-cell RNA-seq data – BHT injury | This study | NCBI GEO: GSE218665 |
| Single-cell RNA-seq data – AT1 cell ablation | This study | NCBI GEO: GSE218666 |
| Single-cell RNA-seq data – AT2-specific loss of Mdm2 | This study | NCBI GEO: GSE235212 |
| Single-cell RNA-seq data – bleomycine injury | Tsukui et al., 2020 | NCBI GEO: GSE132771 |
| Single-cell RNA-seq data – Control lungs | Konkimalla et al., 2022 | NCBI GEO: GSE173878 |
| Experimental models: Cell lines | ||
| Primary alveolar fibroblasts | NA | NA |
| HEK293T cells | NA | NA |
| Experimental models: Organisms/strains | ||
| Sftpc tm1(cre/ERT2)Blh | Jackson Laboratory | Cat# 028054 |
| Pdgfra tm1.1(cre/ERT2)Blh /J | Jackson Laboratory | Cat# 032770 |
| Runx1tm1Tani/J | Jackson Laboratory | Cat# 008772 |
| Hopx tm2.1(cre/ERT2)joe/J | Jackson Laboratory | Cat# 017606 |
| Mdm2tm2.1Glo/J | Jackson Laboratory | Cat# 031614 |
| C57Bl/6 | Jackson Laboratory | Cat# 000664 |
| Rosa26R-CAG-lsl-tdTomato | Jackson Laboratory | Cat# 007914 |
| Ager tm1(cre/ERT2)Blh | Jackson Laboratory | Cat# 036942 |
| Rosa26R-lsl-DTR | Jackson Laboratory | Cat# 007900 |
| Rosa26R-lsl-DTA | Jackson Laboratory | Cat# 006331 |
| Tg(Acta2-cre/ERT2)12Pcn | Hogan lab Wendling et al., 2009 |
N/A |
| Oligonucleotides | ||
| See TableS5 for oligonucleotides used in this study | N/A | N/A |
| Recombinant DNA | ||
| pAAV-nEFCas9 | Suzuki et al, 2016 | Juan Belmont, Addgene Plasmid# 87115 |
| pCDNA3.1 FLAG-Runx1(1790) | Jiang et al., 2005 | Matija Peterlin, Addgene Plasmid#14585 |
| pxx680 | N/A | N/A |
| pXR5 | N/A | N/A |
| Software and algorithms | ||
| CellRanger v3.0.0 | 10x genomics | https://www.10xgenomics.com/ |
| Seurat R package v3.2.3 | Stuart et al., 2019 | https://satijalab.org/seurat/ |
| SoupX pipeline | Young, M.D., Behjati, S. 2020 | https://github.com/constantAmateur/SoupX |
| Enrichr | Kuleshov et al., 2016 | https://maayanlab.cloud/Enrichr/ |
| SCENIC | Aibar et al., 2017 | https://scenic.aertslab.org/ |
| CellChat | Jin et el., 2021 | http://www.cellchat.org/ |
| Cellpose | Stringer et., 2021 | https://www.cellpose.org/ |
| GraphPad Prism | Graph Pad | https://www.graphpad.com |
| FlexiWare software (version 8.1) | SCIREQ | https://www.scireq.com/flexivent/flexiware/ |
| FIJI | NIH | https://fiji.sc |
| Other | ||
| N/A | N/A | N/A |
Experimental model and subject details
Animals
Sftpctm1(cre/ERT2)Blh(Sftpc-CreER) (stock number 028054, Jackson Laboratory 53), Rosa26R-CAG-lsl-tdTomato (Ai14) (stock number 007914, Jackson Laboratory 54), Agertm1(cre/ERT2)Blh (Ager-CreER) (stock number 036942, Jackson Laboratory 55), Rosa26R-lsl-DTA (stock number 006331, Jackson Laboratory 56, Rosa26R-lsl-DTR (stock number 007900, Jackson Laboratory57), Pdgfratm1.1(cre/ERT2)Blh/J(Pdgfra-CreER) (stock number 032770, Jackson laboratory55), Runx1tm1Tani/J (stock number 008772, Jackson Laboratory58), Hopx tm2.1(cre/ERT2)joe/J (stock number 017606, Jackson laboratory59) Mdm2tm2.1Glo/J (stock number 031614, Jackson Laboratory60), Tg(Acta2-cre/ERT2)12Pcn 61 and C57BL/6J (stock number 000664, Jackson Laboratory) mice were maintained on a C57BL/6J background. For all lineage tracing or loss of function experiments (with exceptions noted below), 3–5 doses of tamoxifen (0.1mg/g body weight) (Sigma Aldrich) was administered intraperitoneally. For high dose Ager-CreER based ablation, 5 doses of tamoxifen (0.2mg/g body weight) was used. Diphtheria toxin was administered at a dose of 3μg/mouse (single ablation) or 3μg/mouse + 1μg/mouse (repeat ablation) via intraperitoneal administration. Butylated hydroxytoluene (BHT) was administered via intraperitoneal (IP) injection at a dose of 225 mg/kg. AAV5-GFP and AAV5-DTR virus were intranasally administered to mice as described previously44. Both male and female mice between 8–14 weeks of age groups were used for experiments. All animal experiments were approved by the Duke University Institutional Animal Care and Use Committee in accordance with US National Institutes of Health guidelines.
Method details
Partial left lobe pneumonectomy and double injury (AT1 ablation + PNX) model
Partial right-lobe pneumonectomy was performed as previously described62. Briefly, animals were anesthetized by inhalation of 3% isoflurane in an induction chamber, and anesthesia was maintained via peroral tracheal intubation with a 22G catheter (ventilation set with MiniVent, 200–300ul/stroke). The left thoracic wall was shaved and disinfected with betadine and ethanol. Buprenorphine-SR was administered subcutaneously as an analgesic. A 1–1.5cm incision was made over the left rib cage and skin retracted, followed by a small incision in the intercostal space between the fifth and sixth ribs and expanded using a retractor. The left lobe of the lung was lifted out of the rib cage with forceps and the pulmonary vessels and left bronchi were ligated with a surgical clip. The left lung was resected, and the rib cage sutured shut. Outer skin was stapled shut. Bupivicaine (50μl) was administered locally to the incision site. Mechanical ventilation was ceased once mice returned to spontaneous breathing on room air. Mice were then extubated and allowed to recover in a cage on a heat source. Saline, 1ml at 0.9% sodium chloride (USP), was given intraperitoneally to replace fluid/blood loss. Animals were monitored every 15 minutes until ambulatory and then at least twice daily for 72 hours. Humane endpoints described in the mouse protocol are observed.
For double injury (pneumonectomy + AT1 ablation) model, Ager-CreER mice were administered 5 doses of tamoxifen (0.2mg/g body weight) and pneumonectomy performed as above. Diphtheria toxin (3μg/mouse) was intraperitoneally administered on day 4.
Whole-body plethysmography
Whole body plethysmography (WBP) was performed as previously described 63,64 at 11 and 13 days post double injury (PNX+AT1 ablation) and repeated AT1 ablation in mice with control pneumonectomy or control WT mice, respectively. Briefly, unanesthetized, unrestrained mice were placed in a Plexiglass chamber (DSI, St. Paul, MN); Breathing was monitored under normoxia (FiO2: 0.21; N2 balance) for 1.5 hours, within which a five-minute period of regular breathing was selected as the baseline. Following the period of normoxia, mice were exposed to a hypercapnic and hypoxic (FiCO2: 0.07, FiO2: 0.10; N2 balance) respiratory challenge for 10 minutes. Mice were then returned to normoxic air. Data was collected and tidal volume (TV) and expiratory time (Te) were analyzed using FinePointe Software.
Forced Oscillometry Flexivent measurements
Respiratory mechanics at baseline were assessed using forced oscillometry (FlexiVent system; SCIREQ, Montreal, Canada) in control and BHT treated mice at day 6 and day 20 following injury as previously described65. The mice were anesthetized by intraperitoneal injection of a 2g/kg urethane. Following an adequate plane of anesthesia (loss of withdrawal to toe pinch), mice were tracheotomized, connected to the FlexiVent system in a supine position, and ventilated at a tidal volume of 10 ml/kg, with a rate of 150 breaths/min. Respiratory mechanics were obtained and calculated using FlexiWare software (SCIREQ, version 8.1).In brief, measurements were obtained by analyzing pressure and volume signals acquired in reaction to predefined, small amplitude, oscillatory airflow waveforms (perturbations) applied to the subject’s airways. Respiratory system resistance (Rrs), elastance (Ers), compliance (Crs) and inspiratory capacity (IC) were obtained by assessing the mouse’s response to a single frequency forced oscillation maneuver. These maneuvers were performed every 15 seconds for a total of 12 automated measurements per dose.
Tissue Preparation and Sectioning
Lungs were inflated with 4% Paraformaldehyde (PFA) and incubated at 4°C for 4–6 hours. Lung lobes were separated, washed in PBS, and incubated overnight in 30% sucrose at 4°C. Lobes were subsequently incubated in 1:1 30% sucrose:OCT for 1 hour followed by embedding in OCT blocks and cryosectioning. For all 2D imaging, sections were collected at 8–10μm.
For thick sections, lungs were inflated with 1–1.5mL low-melting point 2% agarose dissolved in PBS. Lungs were placed on ice until agarose solidified, followed by vibratome sectioning at 300–500μm. Sections were collected in PFA, fixed for 4 hours at 4°C and stored in PBS until further processing.
Masson-trichrome staining
Trichrome staining was performed using Masson Trichrome Staining Kit (Sigma-Aldrich, St Louis, MO, USA) according to the manufacturer protocol on OCT-frozen section collected from BHT, AT1 ablation and control lung. Large view images were recorded and stitched using a 10X objective of Axio imager (Zeiss).
Proximity ligation in situ hybridization (PLISH)
PLISH was performed as described previously66. Briefly, fixed and OCT embedded mouse lungs were cryosectioned, fixed with 4% paraformaldehyde for 20 min, treated with 20 μg/mL proteinase K for 9 min at 37°C, and dehydrated with up-series of ethanol. The sections were incubated with gene-specific oligos in hybridization buffer (1M sodium trichloroacetate, 50 mM Tris [pH 7.4], 5 mM EDTA, 0.2 mg/mL heparin) for 2 h at 37°C. Common bridge and circle probes were added to the section and incubated for 1 h followed by T4 DNA ligase reaction for 2 h. Rolling circle amplification was performed by using phi29 polymerase (#30221, Lucigen) for 12 hours at 37°C. Fluorophore-conjugated detection probe was applied and incubated for 30 min at 37°C followed by mounting in medium containing DAPI.
Immunofluorescence Staining
OCT sections were brought to room temperature and washed in PBS. Antigen retrieval was performed in citrate buffer, pH 6.0 (Sigma-Aldrich) using a water bath (95°C for 10–12 minutes) or antigen retrieval system (Electron Microscopy Science). Sections were washed with 0.1% Triton in PBS (PBST), incubated in blocking buffer (1% BSA in 0.1% PBST) for 1 hour, and then stained with primary antibody for 2 hours at RT or overnight at 4°C. Following primary antibody incubation, tissues were washed three times in PBST followed by incubation with secondary antibody in blocking buffer for 1 hour. Sections were washed with PBST and coverslips were mounted with Fluor G reagent with DAPI. Primary antibodies were as follows: RAGE/AGER (R&D systems, MAB1179, 1:500), CLDN4 (Thermo Fischer Scientific, 36–4800, 1:500), TP53 (Gentex, GTX102965, 1:500), αSMA (abcam; ab5694, 1:250), TdTomato (Origene, AB8181-200, 1:700), RFP (Rockland, 600-401-379, 1:500), SFN (Thermo Fisher, PA5-95056, 1:250), LEL Fluorescin (Vector Laboratories, FL-1171, 1:1000), LEL-DyLight-449 (Vector laboratories, DL-1178, 1:1000), LAMP3 (Synaptic Systems, 391 005, 1:1000), PDGFRA (R&D Systems, AF1062, 1:250), αSMA (Sigma-Aldrich; Cy3 conjugated, C6198, 1:1000; FITC conjugated, F3777, 1:1000), LGALS3 (Cedarlane, CL8942AP, 1:500), Pro-COL1A1 (Phosphosolutions, 321-COLP, 1:500), RUNX1 (Cell signaling technology, 8529, 1:500), DTR (R&D systems, AF259-NA, 1:250), PECAM-1 (BD Pharmingen, 550274, 1:250), SCGB1A1 (Santa Cruz, sc-9772, 1:500), TIMP1 (Novus, AF980, 1:500), SFRP1 (abcam, ab126613, 1:500), CTHRC1 (abcam, ab85739, 1:500), Integrin alpha 8 (ITGA8) (Novus, AF4076, 1:500), LGALS1 (Cell signaling, 13888, 1:500), LGALS3 (Cedarlane, CL8942AP, 1:1000), LIF (Novus, NBP2-27406, 1:500) Hydrazide-CF647 (Sigma-Aldrich, SCJ4600046, 1:5000), ELN (kind gift from Dr. Robert Mecham, Washington University, USA).
For thick sections, immunofluorescence staining was performed on floating sections with buffers as described above. Thick sections were stained in primary antibody for 24–48 hours at 4°C, washed 3x in PBST for 15 minutes and incubated with secondary antibody for 3 hours at RT, followed by three washes with PBST. Nuclei were stained with 100ng/mL DAPI for 15 minutes. Sections were maintained in PBS until imaging on a glass-bottom dish (Matsunami Glass).
Mouse lung tissue dissociation and cell isolation
Lung dissociation was performed as described previously 30,67,68. Briefly, lungs were inflated with an enzyme dissociation solution (450U/mL Collagenase I (Worthington, LS004197), 5U/mL Dispase (Corning, 354235), and 0.33U/mL DNase I (Roche, 10104159001), in DMEM). Separated lung lobes were minced and incubated in enzyme solution at 37°C for 25–35 minutes. Dissociation was quenched with equivalent volume 10% FBS/DMEM and strained through a 100 μm strainer. Cell pellet was resuspended in red blood cell lysis buffer (100 μm EDTA, 10 mM KHCO3, 155 mM NH4Cl) for 2 minutes, followed by quenching with 10% FBS/DMEM and filtration through a 40 μm strainer.
Fibroblasts purification, culture and treatment
For magnet assisted cell sorting was performed as described previously 20. Briefly, the dissociated cells were resuspended in 1mL of MACs buffer (PBS, pH 7.2, 0.5% bovine serum albumin (BSA), and 2 mM EDTA). MACs antibodies used for sorting include the following: CD45 MicroBeads, mouse (Milenyi Biotec, 130-052-301, 1:100), CD31 MicroBeads, mouse (Miltenyi Biotec, 130-097-418, 1:100), EpCAM MicroBeads, mouse (130-105-958, 1:100), LSEC MicroBeads, mouse (Miltenyi Biotec, 130-092-007, 1:100). PDGFRα+ fibroblasts were cultured in DMEM/F12 supplemented with Antibiotic/Antimycotic (Gibco 15240062, 100X), HEPES (Thermo Fisher Scientific, 15630080). GlutaMAX (Thermo Fisher Scientific, 35050061), B27 supplement (Thermo Fisher Scientific, 17504044), N2 supplement (Thermo Fisher Scientific, 17502048), N-acetylcysteine (Sigma-Aldrich, A9165) and PDGFα (10ng/mL). After isolation, cells were resuspended in media and seeded on fibronectin coated plates. Media was changed every 2–3 days. To induce myofibrogenesis, PDGFα containing media was replaced with media containing 10ng/mL TGFβ (BioLegend, 781802), unless otherwise stated.
pAAV5-Runx1-FLAG plasmid construction and AAV production
Full length mouse Runx1 was PCR-amplified from pcDNA3.1 Flag Runx1 FL (Addgene Plasmid#1458569) using Q5 DNA polymerase (NEB, M0491) according to the manufacturer’s instructions (see Table S5 for primer sequences). The PCR-amplified fragment was cloned into pAAV-nEFCas9 (Addgene Plasmid#8711570). Briefly, the parent vector was linearized and the Cas9 region was excised via an initial restriction digest using XbaI and EcoRI enzymes. Then, A PCR-amplified a Runx1-FLAG fragment was HiFi (NEB HIFI-assembly master mix, NEB, E2621L) assembled into the modified plasmid thereby replacing the Cas9 region, generating the pAAV-Runx1-FLAG plasmid. AAV was produced and purified as described previously44.
Adenoviral infection
Adenovirus encoding Cre recombinase co-expressing GFP (Ad-Cre-GFP, SL100706) were purchased from SignaGen Laboratories. Fibroblasts were infected by adding virus stocks directly to the culture medium. After an overnight incubation at 37°C, the infection medium was replaced with fresh culture medium.
RNA isolation and qRT–PCR
Cells were lysed in TRIzol reagent (Thermo Fisher Scientific, 15596026) and total RNA was extracted using a Direct-zol RNA Microprep kit (Zymo, R2061). cDNA was synthesised from a maximum of 1μg total RNA using the SuperScript III First-Strand Synthesis SuperMix kit (Thermo Fisher Scientific, 18080400) using oligo dT primers. qPCR was performed using PowerUp SYBR Green Master Mix (Thermo Fisher Scientific, A25742) on a StepOne Plus Real-Time PCR System (Applied Biosystems). Primer sequences were sourced from Origene and are listed in key resource table. Analysis was performed as described previously20. Results are provided as ΔΔCt. Only biological replicates are shown on the plots, and these were obtained by averaging n > 1 experimental replicates each.
Lysyl Oxidase (LOX) activity assay
LOX activity of cell supernatant collected from cultured PDGFRα+ fibroblasts was measured using a Fluorometric Lysyl Oxidase Activity Assay Kit (ab112139, Abcam) following a protocol provided by the manufacturer. Briefly, cells were grown in PDGFRα containing medium for 2 days, and then fresh media with or without 10 ng/mL TGFβ and/or small-molecule inhibitors was added. Following an overnight incubation, 50 μl of sample was mixed with an equal volume of assay reaction mixture containing LOX substrate, HRP, and HRP substrate. The mixture was incubated for 30 minutes at 37°C in darkness. The fluorescence increase was then measured with a fluorescence plate reader (BMG LabTech CLARIOstar) at excitation (Ex)/emission (Em) = 540/590 nm. Medium alone without LOX present was used for determination of the background fluorescence. Reported LOX values are background (media alone) subtracted and normalized to the TGFβ treatment.
Single-cell RNA sequencing
For AT1-ablated lung tissues, MACS based immune and endothelial cell depletion was performed to enrich epithelial and mesenchymal cells. Cells from dissociated lungs were incubated for 30 minutes with the following antibodies: CD45 (MiltenyiBiotech, 130-052-301) and CD31 (MiltenyiBiotech, 130-097-418). MACS depletion was performed as per manufacturer protocol using LD columns (MiltenyiBiotech, 130-042-901). Drop-seq S3 (Second-Strand Synthesis), an optimized version of Drop-seq was used by adapting S3 procedure from Seq-well S3 71. Briefly, cells at a concentration of 100 cells/μl were run through microfluidic channels at 3,000 μl/h, together with mRNA capture beads at 3,000 μl/h and droplet-generation oil at 13,000 μl/h. Captured mRNA on the beads were reverse-transcribed using Maxima H Minus RTase (Thermo Fisher, #EP0753) with a series of incubation at 25°C for 30 min, 42°C for 90 min and 50°C for 30 min followed by Exonuclease I treatment. The beads were treated with fresh 0.1M NaOH at room temperature for 5 min followed by second-strand synthesis using Klenow fragment (3’→5’ exo minus, New England Biolabs, #M0212L) with incubation at 37°C for 60 min. The beads were then used for pre-amplification step (1 cycle of 98°C for 3 min, 4 cycles of 98°C for 15 sec, 55°C for 45 sec, 68°C for 4min, 10–144 cycles of 98°C for 15 sec, 57°C for 30 sec, 68°C for 4 min and 1 cycle of 72°C for 10 min) using Terra PCR Direct Polymerase (#639271, Takara). The rest of the processes were performed as described in the original Drop-seq protocol72.
For scRNA-seq profiling of BHT-injury and Mdm2 knockout (AT2-specific) lungs, MACS based cell immune and endothelial cell depletion was performed to enrich epithelial and mesenchymal cells. Cells were captured and library preparation was performed using Chromium Single Cell 3′ Reagent Kits v3.1 (10x Genomics). Libraries generated from both methods were sequenced using HiSeq X with 150-bp paired end sequencing.
scRNA-Seq analyses
scRNA-seq analysis of Drop-seq data was performed by processing FASTQ files using dropSeqPipe v0.3 (https://hoohm.github.io/dropSeqPipe) and mapped on the GRCm38 genome reference with annotation version 91. Unique molecular identifier (UMI) counts were then further analyzed using the Seurat R package (v4.2.0) 73. For 10X processed samples, FASTQ files were processed using CellRanger v7.0.1 (10x Genomics) and mapped to the mm10 reference genome. Background signal from the UMI counts data was filtered using the SoupX package.Low quality and duplet cells were removed prior to further analysis (nFeature_RNA > 1000 & nFeature_RNA < 5000). Background-corrected UMI counts were normalized using SCTransform v0.3.2. Integration anchors were calculated for data using the FindIntegrationAnchors() command with 10,000 anchor features. Data were integrated using the IntegrateData() command.
Principle component analysis was performed, and the number of significant dimensions was estimated by plotting standard deviations of principal components using the ElbowPlot() function. Cell clusters were identified using a shared nearest neighbors (SNN)-based algorithm. UMAP rendering was performed to visualize the clusters. Specific cell clusters were identified based on enrichment for Vim, Epcam, Sox2, Ptprc, Wt1, FoxJ1, Chad, Pdgfra, Timp4, Pi16, Fgf18, Pdgfrb, Pde5a, Cthrc1, Sftpc, Sftpb, Lamp3, Ager, Hopx, Akap5, Mki67, Lgals3, Cldn4, Pdgfra, Acta2, Hhip, and Des. Immune cells and other rare cell populations were manually removed from further analyses. Cells belonging to populations of interest were subset using the subset() function and re-clustered. Markers for each cluster were obtained using the command FindAllMarkers in Seurat. All UMAP and dot plot visualization was performed using Seurat package commands.
The ECM score was calculated as previously described 11. To generate heatmaps, differentially expressed genes between clusters were identified using FindAllMarkers and filtered for ECM Core Matrisome and Matrisome-associated genes with avg_log2FC>5. Heat maps were plotted using the pheatmap v.1.0.12 package after calculating z-scores of average gene expression in each cluster.
Transcription factor regulatory network analyses in epithelial and mesenchymal cells was performed using SCENIC package 42. Results were visualized as a heat map using the ComplexHeatmap v.2.2.0 package. Cell–cell interaction analysis was performed using CellChat v.1.1.0 43. Activated AT2s, alveolar fibroblasts, AT1, AT2, Epithelial Transitional States (PATS), Proliferating AT2s, transitional alveolar fibroblasts subsets were used for interaction analysis.
Transcripts enriched in each cell population were used as input to Enrichr to identify cell type enriched pathways 74.
Differentially expressed genes between clusters of interest were identified using the FindMarkers command. Volcano plots were generated using EnhancedVolcano75. “EnhancedVolcano: Publication-ready volcano plots with enhanced colouring and labeling.” https://github.com/kevinblighe/EnhancedVolcano.).
The RDS files for bleomycin-injured mice were obtained from 33 (raw data NCBI GEO:GSE132771). Pdgfra-expressing cells from AT1 ablation and Tsukui et al. 2020 were integrated with SCT (nfeatures = 3000 for SelectIntegrationFeatures) as per the Seurat pipeline. Principle components were used for generating UMAP plots, as above.
Image acquisition and processing
Images were captured on an Olympus FV3000 confocal microscope using 20X, 40X, and 30X objectives or Zeiss Axio Imager Widefield Fluorescence Microscope using 10x objectives and visualized using ImageJ. Images from lung tissue staining are presented as a z-projection over approximately 3–4 μm unless otherwise stated.
Quantification of alveolar sac area and MLI
For alveolar size quantification a deep-learning-based segmentation algorithm, Cellpose38 and Google-Colab-based platform, ZeroCost DL4Mic76 were used. Hydrazide-stained lung sections were used for segmentation that was obtained using the pre-trained model of Cellpose. Binary images were then created using find maxima in Fiji Image J2 software (National Institutes of Health, Bethesda, MD, USA) and segmented area was manually corrected. The size of segmented alveolar space was obtained from 2 images per mouse and n=3 mice were used for each condition.
Mean linear intercept (MLI) analysis was conducted as previously described39. A horizontal grid of 500 μm was laid over 20X magnification images per mouse. Lung fields were chosen at random from parenchymal lung, and quantification was performed on 5 grid lines per image, starting at the top left of the grid. Interalveolar grid intersection lengths were manually measured using ImageJ as previously described 77. Regions that did not contain tissue (such as the edge of the lung) or contain blood vessels or large airways were excluded from analysis. At least 3–5 images were quantified per mouse, with at least n=3 mice per condition. Statistical significance was set at p≤0.05. All data are presented as mean±SEM.
Quantification of ACTA2+ cell coverage
To quantify the coverage of ACTA2+ cells on sections collected at different time points following BHT injury, AT1 ablation and controls, ACTA2 fluorescence staining and transmission DIC images were recorded using 20X objective (FV3000 Olympus). Using Fiji (Image J2 software), binary process was applied to both fluorescence and DIC images and a region of Interest (ROI) was set on the ACTA2-stained image by polygon selection to exclude large blood vessels and airways. The same ROI was applied to the transmission DIC image. Area fractions were measured in ROIs in both ACTA2-stained image and DIC image. The percentages of ACTA2 coverage were calculated by dividing the area fraction of the ACTA2-stained image by the area fraction in the transmission DIC image. At least three images were quantified per mouse, with at least n=3 mice per condition.
Quantification of pro-COL1A1 in ACTA2 cell
To quantify the percentage of COL1A1 propeptide in ACTA2+ cells, images of pro-COL1A1 and ACTA2 immunostainings on BHT injured, AT1 ablation and controls were acquired using a 20X objective of FV3000 (Olympus). First, the ACTA2+ cell area was measured using Fiji (Image J2 software). Next, color-merged image of the COL1A1 and ACTA2 was created by setting up different pseudo-color for COL1A1and ACTA2 staining. The area of pro-COL1A1 and ACTA2 colocalization was measured by color thresholding of merged color of the two pseudo-colors. The area fraction was calculating by dividing the area where the COL1A1 and ACTA2 signals colocalize by the area of the single ACTA2 signal. Three images were quantified per mouse, with n=3 mice per condition.
QUANTIFICATION AND STATISTICAL ANALYSIS
Sample size was not pre-determined. All experiments were performed on at least three biological replicates (except scRNA-Seq, in which each condition consisted of two biological replicates). Data are presented as means with standard error (SEM). Statistical analysis was performed in Excel, GraphPad Prism, and R. A two-tailed Student’s t-test was used for all comparisons between two conditions. In cases with >2 conditions, one-way ANOVA followed by Tukey’s multiple comparison’s test. For multiple groups, two-way ANOVA followed by Sidak’s multiple comparison’s test were performed. FlexiVent data were analyzed using one-way ANOVA and post-hoc analysis using the Bonferroni comparison test was used. Statistical significance was set a priori at p≤0.05. All data are presented as mean±SEM.
Supplementary Material
Table S1: Differentially expressed gene list from distinct mesenchymal cell populations or states in integrated data (BHT, AT1 ablation, Bleomycin, and relevant controls). Related to Figure 3.
Table S2: Differentially expressed gene list from distinct alveolar epithelial cell populations or states in integrated data (BHT, AT1 ablation, and relevant controls). Related to Figure 3.
Table S3: Differentially expressed gene list from distinct mesenchymal cell populations or states in integrated data (AT2-specific Mdm2 knock out, BHT, and relevant controls). Related to Figure 4.
Table S4: Differentially expressed gene list from distinct mesenchymal cell populations or states in integrated data (AT2-specific Mdm2 knock out, and relevant controls). Related to Figure 4.
Table S5: Sequences for oligonucleotides used in this study. Related to Key Resource Table.
Highlights:
Co-emergence of epithelial and fibroblast transitional states during lung repair
AT1 cell loss alone is sufficient to trigger repair responses in alveolar niche
Ectopic induction or loss of transitional states impair tissue topology during repair
RUNX1 controls alveolar fibroblast dynamics and ECM organization during repair
ACKNOWLEDGEMENTS
We thank Brigid Hogan and Tata lab members for fruitful discussions, Preetish Murthy for help with scRNA-seq data analysis; Dr. Robert Mecham for providing ELN antibody; and the Duke Compute Cluster for server space and data storage. We thank Victoria McQuade and Rodent inhalation core facility (for FlexiVent measurements on BHT injured lungs) and LMC Facility at Duke University. A.K. is supported by a fellowship from NIH/NHLBI (F30HL143911). S.K and Y.K. were supported by the Japan Society for the Promotion of Science Overseas Research Fellowships. This work was supported by research award from NIH/NICHD R01HD099486 to M.K.E, from NHLBI/NIH (R00HL127181, R01HL146557, R01HL160939, and R01HL153375) and pilot grant support from NCI/NIH P30 Cancer Center Support Grant (P30CA014236) to P.R.T., and funds from Kaganov-MEDx Pulmonary Initiative to P.R.T. This work was partially supported by funds from Whitehead foundation; P.R.T. is a Whitehead Scholar at Duke University.
INCLUSION AND DIVERSITY
We support inclusive, diverse, and equitable conduct of research.
Footnotes
Declaration of interests
P.R.T. serves as acting CEO of Iolux Inc. and consultant for Surrozen Inc., Cellarity Inc., and Celldom Inc., on work not related to the contents of this manuscript. Z.J.F. serves as COO of Iolux Inc. P.R.T., A.T., A.K., and Y.K. filed a patent based on the findings from this work.
Publisher's Disclaimer: This is a PDF file of an unedited manuscript that has been accepted for publication. As a service to our customers we are providing this early version of the manuscript. The manuscript will undergo copyediting, typesetting, and review of the resulting proof before it is published in its final form. Please note that during the production process errors may be discovered which could affect the content, and all legal disclaimers that apply to the journal pertain.
REFERENCES
- 1.Pinet K, and McLaughlin KA (2019). Mechanisms of physiological tissue remodeling in animals: Manipulating tissue, organ, and organism morphology. Dev Biol 451, 134–145. 10.1016/j.ydbio.2019.04.001. [DOI] [PubMed] [Google Scholar]
- 2.Beitel GJ (2021). Organ remodeling: The molecular choreography of a dance of destruction. Curr Biol 31, R1517–R1520. 10.1016/j.cub.2021.10.057. [DOI] [PubMed] [Google Scholar]
- 3.Daley WP, Peters SB, and Larsen M (2008). Extracellular matrix dynamics in development and regenerative medicine. J Cell Sci 121, 255–264. 10.1242/jcs.006064. [DOI] [PubMed] [Google Scholar]
- 4.Lu P, Takai K, Weaver VM, and Werb Z (2011). Extracellular matrix degradation and remodeling in development and disease. Cold Spring Harb Perspect Biol 3, a005058. 10.1101/cshperspect.a005058. [DOI] [PMC free article] [PubMed] [Google Scholar]
- 5.Gur-Cohen S, Yang H, Baksh SC, Miao Y, Levorse J, Kataru RP, Liu X, de la Cruz-Racelis J, Mehrara BJ, and Fuchs E (2019). Stem cell-driven lymphatic remodeling coordinates tissue regeneration. Science 366, 1218–1225. 10.1126/science.aay4509. [DOI] [PMC free article] [PubMed] [Google Scholar]
- 6.Marsh E, Gonzalez DG, Lathrop EA, Boucher J, and Greco V (2018). Positional Stability and Membrane Occupancy Define Skin Fibroblast Homeostasis In Vivo. Cell 175, 1620–1633.e13. 10.1016/j.cell.2018.10.013. [DOI] [PMC free article] [PubMed] [Google Scholar]
- 7.Talbott HE, Mascharak S, Griffin M, Wan DC, and Longaker MT (2022). Wound healing, fibroblast heterogeneity, and fibrosis. Cell Stem Cell 29, 1161–1180. 10.1016/j.stem.2022.07.006. [DOI] [PMC free article] [PubMed] [Google Scholar]
- 8.Fraire-Zamora JJ, Tosi S, Solon J, and Casanova J (2021). Control of hormone-driven organ disassembly by ECM remodeling and Yorkie-dependent apoptosis. Curr Biol 31, 5261–5273.e4. 10.1016/j.cub.2021.09.057. [DOI] [PubMed] [Google Scholar]
- 9.Zhou Y, Horowitz JC, Naba A, Ambalavanan N, Atabai K, Balestrini J, Bitterman PB, Corley RA, Ding B-S, Engler AJ, et al. (2018). Extracellular matrix in lung development, homeostasis and disease. Matrix Biol 73, 77–104. 10.1016/j.matbio.2018.03.005. [DOI] [PMC free article] [PubMed] [Google Scholar]
- 10.Gur C, Wang S-Y, Sheban F, Zada M, Li B, Kharouf F, Peleg H, Aamar S, Yalin A, Kirschenbaum D, et al. (2022). LGR5 expressing skin fibroblasts define a major cellular hub perturbed in scleroderma. Cell 185, 1373–1388.e20. 10.1016/j.cell.2022.03.011. [DOI] [PMC free article] [PubMed] [Google Scholar]
- 11.Kuppe C, Ibrahim MM, Kranz J, Zhang X, Ziegler S, Perales-Patón J, Jansen J, Reimer KC, Smith JR, Dobie R, et al. (2021). Decoding myofibroblast origins in human kidney fibrosis. Nature 589, 281–286. 10.1038/s41586-020-2941-1. [DOI] [PMC free article] [PubMed] [Google Scholar]
- 12.Ramachandran P, Dobie R, Wilson-Kanamori JR, Dora EF, Henderson BEP, Luu NT, Portman JR, Matchett KP, Brice M, Marwick JA, et al. (2019). Resolving the fibrotic niche of human liver cirrhosis at single-cell level. Nature 575, 512–518. 10.1038/s41586-019-1631-3. [DOI] [PMC free article] [PubMed] [Google Scholar]
- 13.Weibel ER (2017). Lung morphometry: the link between structure and function. Cell Tissue Res. 367, 413–426. 10.1007/s00441-016-2541-4. [DOI] [PubMed] [Google Scholar]
- 14.Weibel ER (2013). A retrospective of lung morphometry: from 1963 to present. Am J Physiol Lung Cell Mol Physiol 305, L405–408. 10.1152/ajplung.00169.2013. [DOI] [PubMed] [Google Scholar]
- 15.Crapo JD, Barry BE, Gehr P, Bachofen M, and Weibel ER (1982). Cell number and cell characteristics of the normal human lung. Am Rev Respir Dis 126, 332–337. 10.1164/arrd.1982.126.2.332. [DOI] [PubMed] [Google Scholar]
- 16.Hogan BLM, Barkauskas CE, Chapman HA, Epstein JA, Jain R, Hsia CCW, Niklason L, Calle E, Le A, Randell SH, et al. (2014). Repair and regeneration of the respiratory system: complexity, plasticity, and mechanisms of lung stem cell function. Cell Stem Cell 15, 123–138. 10.1016/j.stem.2014.07.012. [DOI] [PMC free article] [PubMed] [Google Scholar]
- 17.Konkimalla A, Tata A, and Tata PR (2021). Lung Regeneration: Cells, Models, and Mechanisms. Cold Spring Harb Perspect Biol, a040873. 10.1101/cshperspect.a040873. [DOI] [PMC free article] [PubMed] [Google Scholar]
- 18.Basil MC, Katzen J, Engler AE, Guo M, Herriges MJ, Kathiriya JJ, Windmueller R, Ysasi AB, Zacharias WJ, Chapman HA, et al. (2020). The Cellular and Physiological Basis for Lung Repair and Regeneration: Past, Present, and Future. Cell Stem Cell 26, 482–502. 10.1016/j.stem.2020.03.009. [DOI] [PMC free article] [PubMed] [Google Scholar]
- 19.Travaglini KJ, Nabhan AN, Penland L, Sinha R, Gillich A, Sit RV, Chang S, Conley SD, Mori Y, Seita J, et al. (2020). A molecular cell atlas of the human lung from single-cell RNA sequencing. Nature 587, 619–625. 10.1038/s41586-020-2922-4. [DOI] [PMC free article] [PubMed] [Google Scholar]
- 20.Kadur Lakshminarasimha Murthy P, Sontake V, Tata A, Kobayashi Y, Macadlo L, Okuda K, Conchola AS, Nakano S, Gregory S, Miller LA, et al. (2022). Human distal lung maps and lineage hierarchies reveal a bipotent progenitor. Nature 604, 111–119. 10.1038/s41586-022-04541-3. [DOI] [PMC free article] [PubMed] [Google Scholar]
- 21.Basil MC, Cardenas-Diaz FL, Kathiriya JJ, Morley MP, Carl J, Brumwell AN, Katzen J, Slovik KJ, Babu A, Zhou S, et al. (2022). Human distal airways contain a multipotent secretory cell that can regenerate alveoli. Nature 604, 120–126. 10.1038/s41586-022-04552-0. [DOI] [PMC free article] [PubMed] [Google Scholar]
- 22.Sun X, Perl A-K, Li R, Bell SM, Sajti E, Kalinichenko VV, Kalin TV, Misra RS, Deshmukh H, Clair G, et al. (2022). A census of the lung: CellCards from LungMAP. Dev Cell 57, 112–145.e2. 10.1016/j.devcel.2021.11.007. [DOI] [PMC free article] [PubMed] [Google Scholar]
- 23.Liem KF (1988). Form and Function of Lungs: The Evolution of Air Breathing Mechanisms. Am Zool 28, 739–759. 10.1093/icb/28.2.739. [DOI] [Google Scholar]
- 24.Toshima M, Ohtani Y, and Ohtani O (2004). Three-dimensional architecture of elastin and collagen fiber networks in the human and rat lung. Arch Histol Cytol 67, 31–40. 10.1679/aohc.67.31. [DOI] [PubMed] [Google Scholar]
- 25.Cottin V, Nunes H, Brillet P-Y, Delaval P, Devouassoux G, Tillie-Leblond I, Israel-Biet D, Court-Fortune I, Valeyre D, Cordier J-F, et al. (2005). Combined pulmonary fibrosis and emphysema: a distinct underrecognised entity. Eur Respir J 26, 586–593. 10.1183/09031936.05.00021005. [DOI] [PubMed] [Google Scholar]
- 26.Adams TS, Marlier A, and Kaminski N (2022). Lung Cell Atlases in Health and Disease. Annu Rev Physiol. 10.1146/annurev-physiol-032922-082826. [DOI] [PubMed] [Google Scholar]
- 27.Kropski JA, Lawson WE, Young LR, and Blackwell TS (2013). Genetic studies provide clues on the pathogenesis of idiopathic pulmonary fibrosis. Dis Model Mech 6, 9–17. 10.1242/dmm.010736. [DOI] [PMC free article] [PubMed] [Google Scholar]
- 28.Steele MP, Peljto AL, Mathai SK, Humphries S, Bang TJ, Oh A, Teague S, Cicchetti G, Sigakis C, Kropski JA, et al. (2022). Incidence and Progression of Fibrotic Lung Disease in an At-Risk Cohort. Am J Respir Crit Care Med. 10.1164/rccm.202206-1075OC. [DOI] [PMC free article] [PubMed] [Google Scholar]
- 29.Hogg JC (2008). Lung structure and function in COPD. Int J Tuberc Lung Dis 12, 467–479. [PubMed] [Google Scholar]
- 30.Kobayashi Y, Tata A, Konkimalla A, Katsura H, Lee RF, Ou J, Banovich NE, Kropski JA, and Tata PR (2020). Persistence of a regeneration-associated, transitional alveolar epithelial cell state in pulmonary fibrosis. Nat. Cell Biol. 10.1038/s41556-020-0542-8. [DOI] [PMC free article] [PubMed] [Google Scholar]
- 31.Choi J, Park J-E, Tsagkogeorga G, Yanagita M, Koo B-K, Han N, and Lee J-H (2020). Reconstitution of Alveolar Regeneration via novel DATPs by Inflammatory Niches. bioRxiv, 2020.06.14.151324. 10.1101/2020.06.14.151324. [DOI] [Google Scholar]
- 32.Strunz M, Simon LM, Ansari M, Kathiriya JJ, Angelidis I, Mayr CH, Tsidiridis G, Lange M, Mattner LF, Yee M, et al. (2020). Alveolar regeneration through a Krt8+ transitional stem cell state that persists in human lung fibrosis. Nat Commun 11, 3559. 10.1038/s41467-020-17358-3. [DOI] [PMC free article] [PubMed] [Google Scholar]
- 33.Tsukui T, Sun K-H, Wetter JB, Wilson-Kanamori JR, Hazelwood LA, Henderson NC, Adams TS, Schupp JC, Poli SD, Rosas IO, et al. (2020). Collagen-producing lung cell atlas identifies multiple subsets with distinct localization and relevance to fibrosis. Nat Commun 11, 1920. 10.1038/s41467-020-15647-5. [DOI] [PMC free article] [PubMed] [Google Scholar]
- 34.Marino AA, and Mitchell JT (1972). Lung damage in mice following intraperitoneal injection of butylated hydroxytoluene. Proc Soc Exp Biol Med 140, 122–125. 10.3181/00379727-140-36407. [DOI] [PubMed] [Google Scholar]
- 35.Adamson IY, Bowden DH, Cote MG, and Witschi H (1977). Lung injury induced by butylated hydroxytoluene: cytodynamic and biochemical studies in mice. Lab Invest 36, 26–32. [PubMed] [Google Scholar]
- 36.Smith LJ (1984). Lung damage induced by butylated hydroxytoluene in mice. Biochemical, cellular, and morphologic characterization. Am Rev Respir Dis 130, 895–904. 10.1164/arrd.1984.130.5.895. [DOI] [PubMed] [Google Scholar]
- 37.Kehrer JP, and DiGiovanni J (1990). Comparison of lung injury induced in 4 strains of mice by butylated hydroxytoluene. Toxicol Lett 52, 55–61. 10.1016/0378-4274(90)90165-i. [DOI] [PubMed] [Google Scholar]
- 38.Stringer C, Wang T, Michaelos M, and Pachitariu M (2021). Cellpose: a generalist algorithm for cellular segmentation. Nat Methods 18, 100–106. 10.1038/s41592-020-01018-x. [DOI] [PubMed] [Google Scholar]
- 39.Konkimalla A, Konishi S, Kobayashi Y, Kadur Lakshminarasimha Murthy P, Macadlo L, Mukherjee A, Elmore Z, Kim S-J, Pendergast AM, Lee PJ, et al. (2022). Multi-apical polarity of alveolar stem cells and their dynamics during lung development and regeneration. iScience 25, 105114. 10.1016/j.isci.2022.105114. [DOI] [PMC free article] [PubMed] [Google Scholar]
- 40.Mayr CH, Sengupta A, Ansari M, Pestoni JC, Ogar P, Angelidis I, Liontos A, Rodriguez-Castillo A, Lang NJ, Strunz M, et al. (2022). Autocrine Sfrp1 inhibits lung fibroblast invasion during transition to injury induced myofibroblasts. 2022.07.11.499594. 10.1101/2022.07.11.499594. [DOI] [PMC free article] [PubMed] [Google Scholar]
- 41.El Agha E, Moiseenko A, Kheirollahi V, De Langhe S, Crnkovic S, Kwapiszewska G, Szibor M, Kosanovic D, Schwind F, Schermuly RT, et al. (2017). Two-Way Conversion between Lipogenic and Myogenic Fibroblastic Phenotypes Marks the Progression and Resolution of Lung Fibrosis. Cell Stem Cell 20, 261–273.e3. 10.1016/j.stem.2016.10.004. [DOI] [PMC free article] [PubMed] [Google Scholar]
- 42.Aibar S, González-Blas CB, Moerman T, Huynh-Thu VA, Imrichova H, Hulselmans G, Rambow F, Marine J-C, Geurts P, Aerts J, et al. (2017). SCENIC: single-cell regulatory network inference and clustering. Nat Methods 14, 1083–1086. 10.1038/nmeth.4463. [DOI] [PMC free article] [PubMed] [Google Scholar]
- 43.Jin S, Guerrero-Juarez CF, Zhang L, Chang I, Ramos R, Kuan C-H, Myung P, Plikus MV, and Nie Q (2021). Inference and analysis of cell-cell communication using CellChat. Nat Commun 12, 1088. 10.1038/s41467-021-21246-9. [DOI] [PMC free article] [PubMed] [Google Scholar]
- 44.Konkimalla A, Elmore Z, Konishi S, Macadlo L, Katsura H, Tata A, Asokan A, and Tata PR (2023). Efficient AAV Mediated Transgenesis in Alveolar Stem Cells and Associated Niches. Am J Respir Cell Mol Biol. 10.1165/rcmb.2022-0424MA. [DOI] [PMC free article] [PubMed] [Google Scholar]
- 45.Tsukui T, and Sheppard D (2022). Tracing the origin of pathologic pulmonary fibroblasts. 2022.11.18.517147. 10.1101/2022.11.18.517147. [DOI] [Google Scholar]
- 46.Abbasi S, Sinha S, Labit E, Rosin NL, Yoon G, Rahmani W, Jaffer A, Sharma N, Hagner A, Shah P, et al. (2021). Distinct Regulatory Programs Control the Latent Regenerative Potential of Dermal Fibroblasts during Wound Healing. Cell Stem Cell 28, 581–583. 10.1016/j.stem.2021.02.004. [DOI] [PubMed] [Google Scholar]
- 47.Zhou T, Luo M, Cai W, Zhou S, Feng D, Xu C, and Wang H (2018). Runt-Related Transcription Factor 1 (RUNX1) Promotes TGF-β-Induced Renal Tubular Epithelial-to-Mesenchymal Transition (EMT) and Renal Fibrosis through the PI3K Subunit p110δ. EBioMedicine 31, 217–225. 10.1016/j.ebiom.2018.04.023. [DOI] [PMC free article] [PubMed] [Google Scholar]
- 48.Kim W, Barron DA, San Martin R, Chan KS, Tran LL, Yang F, Ressler SJ, and Rowley DR (2014). RUNX1 is essential for mesenchymal stem cell proliferation and myofibroblast differentiation. Proc Natl Acad Sci U S A 111, 16389–16394. 10.1073/pnas.1407097111. [DOI] [PMC free article] [PubMed] [Google Scholar]
- 49.Neptune ER, Frischmeyer PA, Arking DE, Myers L, Bunton TE, Gayraud B, Ramirez F, Sakai LY, and Dietz HC (2003). Dysregulation of TGF-beta activation contributes to pathogenesis in Marfan syndrome. Nat Genet 33, 407–411. 10.1038/ng1116. [DOI] [PubMed] [Google Scholar]
- 50.Hiwatari N, Shimura S, and Takishima T (1993). Pulmonary emphysema followed by pulmonary fibrosis of undetermined cause. Respiration 60, 354–358. 10.1159/000196235. [DOI] [PubMed] [Google Scholar]
- 51.Cottin V (2013). The impact of emphysema in pulmonary fibrosis. Eur Respir Rev 22, 153–157. 10.1183/09059180.00000813. [DOI] [PMC free article] [PubMed] [Google Scholar]
- 52.Cottin V, Selman M, Inoue Y, Wong AW, Corte TJ, Flaherty KR, Han MK, Jacob J, Johannson KA, Kitaichi M, et al. (2022). Syndrome of Combined Pulmonary Fibrosis and Emphysema: An Official ATS/ERS/JRS/ALAT Research Statement. Am J Respir Crit Care Med 206, e7–e41. 10.1164/rccm.202206-1041ST. [DOI] [PMC free article] [PubMed] [Google Scholar]
- 53.Rock JR, Barkauskas CE, Cronce MJ, Xue Y, Harris JR, Liang J, Noble PW, and Hogan BLM (2011). Multiple stromal populations contribute to pulmonary fibrosis without evidence for epithelial to mesenchymal transition. Proc. Natl. Acad. Sci. U.S.A. 108, E1475–1483. 10.1073/pnas.1117988108. [DOI] [PMC free article] [PubMed] [Google Scholar]
- 54.Madisen L, Zwingman TA, Sunkin SM, Oh SW, Zariwala HA, Gu H, Ng LL, Palmiter RD, Hawrylycz MJ, Jones AR, et al. (2010). A robust and high-throughput Cre reporting and characterization system for the whole mouse brain. Nat Neurosci 13, 133–140. 10.1038/nn.2467. [DOI] [PMC free article] [PubMed] [Google Scholar]
- 55.Chung M-I, Bujnis M, Barkauskas CE, Kobayashi Y, and Hogan BLM (2018). Niche-mediated BMP/SMAD signaling regulates lung alveolar stem cell proliferation and differentiation. Development 145, dev163014. 10.1242/dev.163014. [DOI] [PMC free article] [PubMed] [Google Scholar]
- 56.Ivanova A, Signore M, Caro N, Greene NDE, Copp AJ, and Martinez-Barbera JP (2005). In vivo genetic ablation by Cre-mediated expression of diphtheria toxin fragment A. Genesis 43, 129–135. 10.1002/gene.20162. [DOI] [PMC free article] [PubMed] [Google Scholar]
- 57.Buch T, Heppner FL, Tertilt C, Heinen TJAJ, Kremer M, Wunderlich FT, Jung S, and Waisman A (2005). A Cre-inducible diphtheria toxin receptor mediates cell lineage ablation after toxin administration. Nat Methods 2, 419–426. 10.1038/nmeth762. [DOI] [PubMed] [Google Scholar]
- 58.Davis JM, Jones AD, and Miller BG (1991). Experimental studies in rats on the effects of asbestos inhalation coupled with the inhalation of titanium dioxide or quartz. Int J Exp Pathol 72, 501–525. [PMC free article] [PubMed] [Google Scholar]
- 59.Takeda N, Jain R, LeBoeuf MR, Wang Q, Lu MM, and Epstein JA (2011). Interconversion between intestinal stem cell populations in distinct niches. Science 334, 1420–1424. 10.1126/science.1213214. [DOI] [PMC free article] [PubMed] [Google Scholar]
- 60.Grier JD, Yan W, and Lozano G (2002). Conditional allele of mdm2 which encodes a p53 inhibitor. Genesis 32, 145–147. 10.1002/gene.10066. [DOI] [PubMed] [Google Scholar]
- 61.Wendling O, Bornert J-M, Chambon P, and Metzger D (2009). Efficient temporally-controlled targeted mutagenesis in smooth muscle cells of the adult mouse. Genesis 47, 14–18. 10.1002/dvg.20448. [DOI] [PubMed] [Google Scholar]
- 62.Voswinckel R, Motejl V, Fehrenbach A, Wegmann M, Mehling T, Fehrenbach H, and Seeger W (2004). Characterisation of post-pneumonectomy lung growth in adult mice. Eur Respir J 24, 524–532. 10.1183/09031936.04.10004904. [DOI] [PubMed] [Google Scholar]
- 63.Fusco AF, Pucci LA, Switonski PM, Biswas DD, McCall AL, Kahn AF, Dhindsa JS, Strickland LM, La Spada AR, and ElMallah MK (2021). Respiratory dysfunction in a mouse model of spinocerebellar ataxia type 7. Dis Model Mech 14, dmm048893. 10.1242/dmm.048893. [DOI] [PMC free article] [PubMed] [Google Scholar]
- 64.McCall AL, Dhindsa JS, Pucci LA, Kahn AF, Fusco AF, Biswas DD, Strickland LM, Tseng HC, and ElMallah MK (2020). Respiratory pathology in the Optn−/− mouse model of Amyotrophic Lateral Sclerosis. Respir Physiol Neurobiol 282, 103525. 10.1016/j.resp.2020.103525. [DOI] [PMC free article] [PubMed] [Google Scholar]
- 65.Keeler AM, Liu D, Zieger M, Xiong L, Salemi J, Bellvé K, Byrne BJ, Fuller DD, ZhuGe R, and ElMallah MK (2017). Airway smooth muscle dysfunction in Pompe (Gaa−/− ) mice. Am J Physiol Lung Cell Mol Physiol 312, L873–L881. 10.1152/ajplung.00568.2016. [DOI] [PMC free article] [PubMed] [Google Scholar]
- 66.Nagendran M, Riordan DP, Harbury PB, and Desai TJ (2018). Automated cell-type classification in intact tissues by single-cell molecular profiling. Elife 7. 10.7554/eLife.30510. [DOI] [PMC free article] [PubMed] [Google Scholar]
- 67.Katsura H, Kobayashi Y, Tata PR, and Hogan BLM (2019). IL-1 and TNFα Contribute to the Inflammatory Niche to Enhance Alveolar Regeneration. Stem Cell Reports 12, 657–666. 10.1016/j.stemcr.2019.02.013. [DOI] [PMC free article] [PubMed] [Google Scholar]
- 68.Katsura H, Sontake V, Tata A, Kobayashi Y, Edwards CE, Heaton BE, Konkimalla A, Asakura T, Mikami Y, Fritch EJ, et al. (2020). Human lung stem cell-based alveolospheres provide insights into SARS-CoV-2 mediated interferon responses and pneumocyte dysfunction. Cell Stem Cell. 10.1016/j.stem.2020.10.005. [DOI] [PMC free article] [PubMed] [Google Scholar]
- 69.Jiang H, Zhang F, Kurosu T, and Peterlin BM (2005). Runx1 binds positive transcription elongation factor b and represses transcriptional elongation by RNA polymerase II: possible mechanism of CD4 silencing. Mol Cell Biol 25, 10675–10683. 10.1128/MCB.25.24.10675-10683.2005. [DOI] [PMC free article] [PubMed] [Google Scholar]
- 70.Suzuki K, Tsunekawa Y, Hernandez-Benitez R, Wu J, Zhu J, Kim EJ, Hatanaka F, Yamamoto M, Araoka T, Li Z, et al. (2016). In vivo genome editing via CRISPR/Cas9 mediated homology-independent targeted integration. Nature 540, 144–149. 10.1038/nature20565. [DOI] [PMC free article] [PubMed] [Google Scholar]
- 71.Hughes TK, Wadsworth MH, Gierahn TM, Do T, Weiss D, Andrade PR, Ma F, de Andrade Silva BJ, Shao S, Tsoi LC, et al. (2020). Second-Strand Synthesis-Based Massively Parallel scRNA-Seq Reveals Cellular States and Molecular Features of Human Inflammatory Skin Pathologies. Immunity 53, 878–894.e7. 10.1016/j.immuni.2020.09.015. [DOI] [PMC free article] [PubMed] [Google Scholar]
- 72.Macosko EZ, Basu A, Satija R, Nemesh J, Shekhar K, Goldman M, Tirosh I, Bialas AR, Kamitaki N, Martersteck EM, et al. (2015). Highly Parallel Genome-wide Expression Profiling of Individual Cells Using Nanoliter Droplets. Cell 161, 1202–1214. 10.1016/j.cell.2015.05.002. [DOI] [PMC free article] [PubMed] [Google Scholar]
- 73.Stuart T, Butler A, Hoffman P, Hafemeister C, Papalexi E, Mauck WM, Hao Y, Stoeckius M, Smibert P, and Satija R (2019). Comprehensive Integration of Single-Cell Data. Cell 177, 1888–1902.e21. 10.1016/j.cell.2019.05.031. [DOI] [PMC free article] [PubMed] [Google Scholar]
- 74.Kuleshov MV, Jones MR, Rouillard AD, Fernandez NF, Duan Q, Wang Z, Koplev S, Jenkins SL, Jagodnik KM, Lachmann A, et al. (2016). Enrichr: a comprehensive gene set enrichment analysis web server 2016 update. Nucleic Acids Res. 44, W90–97. 10.1093/nar/gkw377. [DOI] [PMC free article] [PubMed] [Google Scholar]
- 75.Blighe K (2022). EnhancedVolcano: publication-ready volcano plots with enhanced colouring and labeling. [Google Scholar]
- 76.von Chamier L, Laine RF, Jukkala J, Spahn C, Krentzel D, Nehme E, Lerche M, Hernández-Pérez S, Mattila PK, Karinou E, et al. (2021). Democratising deep learning for microscopy with ZeroCostDL4Mic. Nat Commun 12, 2276. 10.1038/s41467-021-22518-0. [DOI] [PMC free article] [PubMed] [Google Scholar]
- 77.Knudsen L, Weibel ER, Gundersen HJG, Weinstein FV, and Ochs M (2010). Assessment of air space size characteristics by intercept (chord) measurement: an accurate and efficient stereological approach. J. Appl. Physiol. 108, 412–421. 10.1152/japplphysiol.01100.2009. [DOI] [PubMed] [Google Scholar]
- 78.Young MD, Behjati S SoupX removes ambient RNA contamination from droplet-based single-cell RNA sequencing data. GigaScience. 2020; 9 10.1093/gigascience/giaa151 [DOI] [PMC free article] [PubMed] [Google Scholar]
Associated Data
This section collects any data citations, data availability statements, or supplementary materials included in this article.
Supplementary Materials
Table S1: Differentially expressed gene list from distinct mesenchymal cell populations or states in integrated data (BHT, AT1 ablation, Bleomycin, and relevant controls). Related to Figure 3.
Table S2: Differentially expressed gene list from distinct alveolar epithelial cell populations or states in integrated data (BHT, AT1 ablation, and relevant controls). Related to Figure 3.
Table S3: Differentially expressed gene list from distinct mesenchymal cell populations or states in integrated data (AT2-specific Mdm2 knock out, BHT, and relevant controls). Related to Figure 4.
Table S4: Differentially expressed gene list from distinct mesenchymal cell populations or states in integrated data (AT2-specific Mdm2 knock out, and relevant controls). Related to Figure 4.
Table S5: Sequences for oligonucleotides used in this study. Related to Key Resource Table.
Data Availability Statement
Single-cell RNA-seq data have been deposited at GEO and are publicly available as of the date of publication and accession numbers are listed in the key resources table. This paper analyzes existing, publicly available data. These accession numbers for the datasets are listed in the key resources table.
This paper does not report original code.
Any additional information required to reanalyze the data reported in this paper is available from the lead contact upon request.
KEY RESOURCES TABLE.
| REAGENT or RESOURCE | SOURCE | IDENTIFIER |
|---|---|---|
| Antibodies | ||
| Monoclonal Rat anti-RAGE/AGER | R&D systems | Cat# MAB1179, RRID:AB_2289349 |
| Polyclonal rabbit anti-Claudin4 | Thermo Fisher Scientific | Cat#36-4800 RRID:AB_2533262 |
| Polyclonal rabbit anti-p53 | GeneTex | Cat#GTX102965 RRID:AB_1952339 |
| Monoclonal mouse anti-actin α-Smooth Muscle-Cy3 | Sigma-Aldrich | Cat# C6198, RRID: AB_476856 |
| Monoclonal mouse anti-actin α-Smooth Muscle-FITC | Sigma-Aldrich | Cat# F3777 RRID: AB_476977 |
| Polyclonal rabbit anti-actin α-Smooth muscle | abcam | Cat#ab5694 RRID:AB_2223021 |
| Polyclonal goat anti-SCGB1A1 | Santa Cruz | Cat# 9772 RRID: AB_2238819 |
| Polyclonal goat anti-TIMP1 | R&D | Cat# AF980 RRID: AB_355759 |
| Polyclonal Rabbit anti-SFRP1 | Abcam | Cat# ab126613 RRID: AB_11128257 |
| Polyclonal Rabbit anti-CTHRC1 | Abcam | Cat# ab85739 RRID: AB_10712489 |
| Monoclonal rabbit anti-RUNX1/AML | Cell Signaling technology | Cat#8529 RRID:AB_10950225 |
| Polyclonal Goat anti-Human RAGE/AGER | R&D Systems | Cat# AF1145, RRID:AB_354628 |
| Polyclonal Goat anti-Integrin alpha 8 | Novus | Cat# AF4076 RRID:AB_2296280 |
| Polyclonal Rabbit anti-LGALS1 | Cell Signaling | Cat# 13888 RRID:AB_2798338 |
| Monoclonal Rat anti-LGALS3 | Cedarlane | Cat# CL8942AP RRID:AB_10060357 |
| Polyclonal DYKDDDDK tag | Proteintech | Cat# 20543-1-AP RRID:AB_11232216 |
| Polyclonal Goat tdTomato | Origene | Cat# AB8181-200 RRID: AB_2722750 |
| Monoclonal Rat Anti-CD31 | BD Biosciences | Cat# 550274 RRID:AB_393571 |
| Polyclonal Rabbit Anti-14-3-3 sigma | Thermo Fisher Scientific | Cat# PA5-95056 RRID:AB_2806862 |
| Monoclonal Rat anti-LIF | Novus | Cat# NBP2-27406 |
| Polyclonal rabbit anti-RFP | Rockland | Cat# 600-401-379 RRID:AB_2209751 |
| Polyclonal guineapig anti-LAMP3 | Synaptic systems | Cat#391 005 RRID:AB_2713987 |
| Polyclonal Rabbit anti-ELN (Elastin) | Kind gift from Dr. Robert Mecham (Washington University, USA) | N/A |
| Polyclonal rabbit anti-Collagen 1, alpha 1 propeptide | Phosphosolutions | Cat# 321-COLP RRID:AB_2492060 |
| Polyclonal goat anti-DTR/HB-EGF | R&D systems | Cat# AF259-NA RRID:AB_354429 |
| LEL-Fluorescein | Vector Laboratories | Cat# FL-1171 RRID:AB_2307440 |
| LEL-DyLight® 649 | Vector Laboratories | Cat#DL-1178 |
| Alexa Fluor 594 donkey anti-goat IgG | Thermo Fisher Scientific | Cat# A11058, RRID:AB_2534105 |
| Alexa Fluor 488 donkey anti-goat IgG | Thermo Fisher Scientific | Cat# A11055 RRID:AB_2534102 |
| Alexa Fluoro 488 Donkey anti-rabbit IgG | Thermo Fisher Scientific | Cat# A21206 RRID:AB_141708 |
| Alexa Fluoro 647 Donkey anti-rabbit IgG | Thermo Fisher Scientific | Cat# A31573 RRID:AB_2536183 |
| Alexa Fluoro 647 Donkey anti-goat IgG | Thermo Fisher Scientific | Cat# A21447, RRID:AB_141844 |
| Alexa Fluoro 488 Donkey anti-rat IgG | Thermo Fisher Scientific | Cat# A21208, RRID:AB_141709 |
| Alexa Fluoro 594 Donkey anti-rat IgG | Thermo Fisher Scientific | Cat# A2109, RRID:AB_2535795 |
| Alexa Fluor 594 goat anti-rabbit IgG | Thermo Fisher Scientific | Cat# A21207, RRID:AB_141637 |
| Alexa Fluor 647 goat anti-rat IgG | Thermo Fisher Scientific | Cat# A21247, RRID:AB_141778 |
| Alexa Fluor 647 goat anti-rabbit IgG | Thermo Fisher Scientific | Cat# A21245, RRID:AB_2535813 |
| CD45 microbeads, mouse | Miltenyi Biotec | Cat# 130-052-301 RRID:AB_2877061 |
| Anti-CD31 microbeads | Miltenyi Biotec | Cat# 130-097-418 RRID:AB_2814657 |
| Anti-CD140a microbeads | Miltenyi Biotec | Cat# 130-101-547 |
| Anti-CD326 (EpCAM) MicroBeads | Miltenyi Biotec | Cat# 130-105-958 |
| Anti-CD146 (LSEC) MicroBeads | Miltenyi Biotec | Cat# 130-092-007 |
| Weigert′s Iron Hematoxylin Set | Millipore Sigma | Cat#HT1079 |
| Trichrome Stain (Masson) Kit | Millipore Sigma | Cat#HT15 |
| Bacterial and virus strains | ||
| NEB Stable Competent E. coli | NEB | Cat# C3040 |
| Adeno-Cre-GFP | Signagen | Cat# SL100706 |
| Adeno-GFP | Signagen | Cat# SL100708 |
| Biological samples | ||
| N/A | N/A | N/A |
| Chemicals, peptides, and recombinant proteins | ||
| DMEM | Corning | Cat# 25-500 |
| Antibiotic-Antimycotic (100X) | Thermo Fisher Scientific | Cat# A5955-100ML |
| Penicillin/Streptomycin | Gibco | Cat# 15140 |
| FBS | HyClone products (Cytiva) | Cat# SH30396.03 |
| Tamoxifen | Sigma-Aldrich | Cat# T5648 |
| Dispase | Corning | Cat# 354235 |
| DNase I | Thermo Fisher Scientific | Cat# 10104159001 |
| Collagenase type I | Gibco | Cat# 17100-017 |
| Butylated hydroxytoluene | Sigma-Aldrich | Cat# W218405 |
| TruStain FcX | Biolegend | Cat# 422302 |
| Diphtheria toxin | Millipore | Cat# 322326 |
| Sucrose | Sigma-Aldrich | Cat# S9378 |
| Citrate Buffer, pH 6.0 (10X) | Sigma-Aldrich | Cat# C9999 |
| DAPI | Sigma-Aldrich | Cat# D9542 |
| Fluoromount-G, with DAPI | Thermo Fisher Scientific | Cat# 00-4959 |
| N-Acetyl-L-cysteine (NAC) | Sigma-Aldrich | Cat # A9165 |
| B-27 Supplement (50X) | Thermo Fisher Scientific | Cat # 17504044 |
| N-2 Supplement (100X) | Thermo Fisher Scientific | Cat # 17502048 |
| Glutamax | Thermo Fisher Scientific | Cat # 35050061 |
| HEPES (1M) | Thermo Fisher Scientific | Cat # 15630080 |
| Antibiotic-Antimycotic (Anti-Anti) (100X) | Thermo Fisher Scientific | Cat # A5955-100ML |
| Recombinant Mouse TGF-β1 | BioLegend | Cat# 763102 |
| Recombinant Mouse PDGF-AA (carrier-free) | BioLegend | Cat#776306 |
| Bovine Serum Albumin (BSA) | Sigma | Cat # A7906 |
| PBS | Gibco | Cat# 20012027 |
| Ro 5-3335 | Tocris | Cat#4694 |
| Physiologic Saline | Henry Schein | Cat# 002477 |
| OCT Compound | Fisher Scientific | Cat# 23-730-571 |
| Paraformaldehyde | Sigma-Aldrich | Cat# P6148 |
| Pierce™ 16% Formaldehyde (w/v), Methanol-free | Thermo Fisher Scientific | Cat#28908 |
| Proteinase K, recombinant, PCR grade | Thermo Fisher Scientific | Cat#E00491 |
| tRNA | Roche | Cat#10109495001 |
| dNTP | Thermo Fisher Scientific | Cat#10297018 |
| Sodium trichloroacetate, 97% | Alfa Aesar | Cat#A17004 |
| Glycerol | Millipore Sigma | Cat#G5516 |
| Low melting agarose | Seaplaque | Cat# 50100 |
| Triton X-100 | Sigma-Aldrich | Cat# X100 |
| Chromium Next GEM Single Cell 3’ Kits v3.1 | 10x Genomics | Cat# 1000269 |
| Ethylenediaminetetraacetic acid disodium salt dihydrate (EDTA) | Sigma-Aldrich | Cat# E5134 |
| Tris pH 7.4 | Thermo Fisher Scientific | Cat# J60202.K2 |
| Heparin ammonium sulfate from porcine intestinal mucosa | Sigma-Aldrich | Cat# H6279 |
| T4 DNA Ligase | NEB | Cat# M0202 |
| RNaseOUT | ThermoFisher | Cat# 10777019 |
| NxGen® phi29 DNA Polymerase | ThermoFisher | Cat# 30221-2 |
| Grace Bio-Labs SecureSeal™ hybridization chambers | Sigma-Aldrich | Cat# GBL621505-20EA |
| Hydrazide-CF647 | Sigma-Aldrich | Cat# SCJ4600046 |
| NEBuilder HiFi DNA Assembly Master Mix | New England Biolabs | Cat# E2621L |
| XbaI | New England Biolabs | Cat# R0145S |
| EcoRI | New England Biolabs | Cat# R0101S |
| Polyethylenimine, Linear, MW 25000, Transfection Grade | Polysciences | Cat#23966 |
| Optiprep Density Gradient Medium | Sigma-Aldrich | Cat# D1556 |
| PEG8000 | Promega | Cat# V3011 |
| Sodium citrate dihydrate | Sigma-Aldrich | Cat# W302600 |
| Ammonium sulfate | Sigma-Aldrich | Cat# A4418-5006 |
| Citric Acid | Sigma-Aldrich | Cat#251275 |
| 10% Pluronic Acid | Gibco | Cat#24040-032 |
| Sodium Bicarbonate (7.5%) | Gibco | Cat#25080-094 |
| Ficoll PM-400, powder | GE Healthcare Life Sciences | Cat# 15260-037 |
| Skarosyl, sodium salt solution | Sigma-Aldrich | Cat# L7414-50ML |
| Ultrapure 1M Tris-HCl, pH 7.5 | ThermoFisher Scientific | Cat# 15567-027 |
| 1M-Tris-HCl, pH 8.0 (Trizma) | Sigma-Aldrich | Cat#T2694-1L |
| Pierce DTT (Dithiothreitol) | ThermoFisher Scientific | Cat#20291 |
| Maxima H Minus RTase | ThermoFisher Scientific | Cat#EP0753 |
| Klenow fragment (3’→5’ exo minus | New England Biolabs | Cat#M0212L |
| Terra PCR Direct Polymerase | Takara | Cat#639271 |
| QX200 Droplet generation oil | Bio-Rad | Cat# 186-4006 |
| Perfluorooctanol (PFO), 97% | Sigma-Aldrich | Cat# 370533-25G |
| 20% SDS | Quality Biological | Cat# 351-066-721 |
| Tween 20 | Bio-Rad | Cat# 170-6531 |
| SSC, 20X | Sigma-Aldrich | Cat# S6639 |
| Advantage UltraPure PCR Deoxynucleotide Mix | Clontech | Cat# 639125 |
| NxGen RNase Inhibitor | Lucigen | Cat# 30281-1 |
| Maxima RT H minus Reverse Transcriptase, 200 U/mL | ThermoFisher Scientific | Cat# EP0752 |
| Exonuclease I, 20 U/mL | ThermoFisher Scientific | Cat# EN0582 |
| 2X Kapa HiFi HotStart ReadyMix | Kapa Biosystems | Cat# KK2601 |
| AMPure XP Beads | Beckman Coulter | Cat# A63880 |
| Nextera XT DNA sample preparation kit, 24 samples | illumina | Cat# FC-131-1024 |
| Critical commercial assays | ||
| N/A | N/A | N/A |
| Deposited data | ||
| Single-cell RNA-seq data – BHT injury | This study | NCBI GEO: GSE218665 |
| Single-cell RNA-seq data – AT1 cell ablation | This study | NCBI GEO: GSE218666 |
| Single-cell RNA-seq data – AT2-specific loss of Mdm2 | This study | NCBI GEO: GSE235212 |
| Single-cell RNA-seq data – bleomycine injury | Tsukui et al., 2020 | NCBI GEO: GSE132771 |
| Single-cell RNA-seq data – Control lungs | Konkimalla et al., 2022 | NCBI GEO: GSE173878 |
| Experimental models: Cell lines | ||
| Primary alveolar fibroblasts | NA | NA |
| HEK293T cells | NA | NA |
| Experimental models: Organisms/strains | ||
| Sftpc tm1(cre/ERT2)Blh | Jackson Laboratory | Cat# 028054 |
| Pdgfra tm1.1(cre/ERT2)Blh /J | Jackson Laboratory | Cat# 032770 |
| Runx1tm1Tani/J | Jackson Laboratory | Cat# 008772 |
| Hopx tm2.1(cre/ERT2)joe/J | Jackson Laboratory | Cat# 017606 |
| Mdm2tm2.1Glo/J | Jackson Laboratory | Cat# 031614 |
| C57Bl/6 | Jackson Laboratory | Cat# 000664 |
| Rosa26R-CAG-lsl-tdTomato | Jackson Laboratory | Cat# 007914 |
| Ager tm1(cre/ERT2)Blh | Jackson Laboratory | Cat# 036942 |
| Rosa26R-lsl-DTR | Jackson Laboratory | Cat# 007900 |
| Rosa26R-lsl-DTA | Jackson Laboratory | Cat# 006331 |
| Tg(Acta2-cre/ERT2)12Pcn | Hogan lab Wendling et al., 2009 |
N/A |
| Oligonucleotides | ||
| See TableS5 for oligonucleotides used in this study | N/A | N/A |
| Recombinant DNA | ||
| pAAV-nEFCas9 | Suzuki et al, 2016 | Juan Belmont, Addgene Plasmid# 87115 |
| pCDNA3.1 FLAG-Runx1(1790) | Jiang et al., 2005 | Matija Peterlin, Addgene Plasmid#14585 |
| pxx680 | N/A | N/A |
| pXR5 | N/A | N/A |
| Software and algorithms | ||
| CellRanger v3.0.0 | 10x genomics | https://www.10xgenomics.com/ |
| Seurat R package v3.2.3 | Stuart et al., 2019 | https://satijalab.org/seurat/ |
| SoupX pipeline | Young, M.D., Behjati, S. 2020 | https://github.com/constantAmateur/SoupX |
| Enrichr | Kuleshov et al., 2016 | https://maayanlab.cloud/Enrichr/ |
| SCENIC | Aibar et al., 2017 | https://scenic.aertslab.org/ |
| CellChat | Jin et el., 2021 | http://www.cellchat.org/ |
| Cellpose | Stringer et., 2021 | https://www.cellpose.org/ |
| GraphPad Prism | Graph Pad | https://www.graphpad.com |
| FlexiWare software (version 8.1) | SCIREQ | https://www.scireq.com/flexivent/flexiware/ |
| FIJI | NIH | https://fiji.sc |
| Other | ||
| N/A | N/A | N/A |