Abstract
Objectives:
The aim of this study was to investigate the association between the overexpression of tumor protein (P53), cytokeratin 20 (CK20), fibroblast growth factor receptor 3 (FGFR3), biomarkers and the grading, prognosis, heterogeneity, and relapse tendency of urothelial cell carcinomas (UCCs) of the bladder.
Methods:
A cross-sectional study was conducted using 413 samples of Iranian patients diagnosed with UCC of the bladder. The tissue microarray technique was used to evaluate the patterns of tumor tissue. Two pathologists scored tissue staining using a semi-quantitative scoring system.
Results:
The results showed that P53 was a predictor of a high-grade pattern (the area under the curve (AUC)=0.620) with a best cut-off value of 95.0 using the receiver operating characteristic (ROC) curve. CK20 was another predictor of a high-grade pattern (AUC=0.745) with a best cut-off value of 15. However, the overexpression of both biomarkers was not associated with a heterogeneous pattern and could not predict tumor-associated death or relapse. The heterogeneous (odds ratio (OR)=4.535, p-value=0.001) and non-papillary (OR= 6.363, p-value= 0.001) patterns were effective predictors of tumor recurrence among all baseline variables, including patient and tumor characteristics. FGFR3 was positive in all specimens and was not a valuable biomarker for differentiating patterns. None of the variables predicted tumor prognosis.
Conclusion:
The study findings indicate that the intensity and percentage of cell staining for P53 and CK20 in the UCC of the bladder can aid in differentiating the grading patterns. The tendency of tumor relapse can be predicted by demonstrating heterogeneous and non-papillary patterns.
Key Words: Urothelial cancer, bladder, oncopathology, biomarkers, cancer diagnosis
Introduction
Urothelial cell carcinoma (UCC) of the bladder represents a prevalent neoplastic disorder worldwide, and as such, engenders a significant financial burden on healthcare systems. The disease is distinguished by frequent recurrence, the presence of superficial or invasive phenotypes, and a pronounced propensity to metastasize (McConkey et al., 2010; Zarifmahmoudi et al., 2019).
The complete molecular etiology underlying urothelial carcinoma of the bladder remains to be elucidated. Nonetheless, various hereditary and environmental influences have been linked with the initiation and progression of tumorigenesis (Di Pierro et al., 2012). There is evidence for the association between specific genetic mutations, such as those affecting the tumor protein P53 gene, and the development of high-grade and invasive forms of urothelial carcinoma of the bladder (Wallerand et al., 2005; Smal et al., 2014). The P53 gene is a tumor suppressor gene responsible for the regulation of the cell cycle and inhibition of apoptosis in response to DNA damage (Chen, 2016; Aubrey et al., 2018). Various mutations, including substitution, frame deletion, frame insertion, etc in P53 gene are responsible for tumorigenesis in a wide range of organs (Ghosh et al., 2022). Missense mutations which increase the resistance of P53 protein are the most prevalent mutations in UCC. The prevalence of P53 gene mutations in urinary bladder neoplasms ranges from 6% to 61% (Shipman et al., 1997; Ciccarese et al., 2017). It is noted that the mutation of this gene occurs late in tumor development and plays a role in the conversion of superficial bladder cancer to invasive carcinoma (Wu et al., 2019). Historically, a threshold of 10% or more nuclei displaying P53 staining has been employed to designate a positive P53 outcome in urothelial carcinoma. Nevertheless, alternative cutoffs, such as 20%, 26%, and even as elevated as 40-50%, have been documented. It is noteworthy, however, that P53 staining fails to discern between low-grade and high-grade urothelial carcinomas. Furthermore, the absence of P53 staining, termed the null phenotype, does not presently hold status as an aberrant staining pattern in this specific tumor category. This is in contradistinction to epithelial malignancies originating in other organ systems, where both the null phenotype and the diffusely positive phenotype are recognized as abnormal expressions of the P53 marker (Hodgson et al., 2017).
Cytokeratin 20 (CK20), encoded by KRT20 on chromosome 17q21.2, is a low-molecular-weight protein that is routinely used as a immunobiological marker by pathologists. Its expression is limited to specific epithelial types, primarily in superficial umbrella cells of normal urothelium, indicating cellular differentiation. Deviations in urothelial differentiation could extend CK20’s presence, causing an “abnormal” staining pattern, or it might be entirely absent. This disruption is common in non-invasive tumors, a key event in early papillary bladder cancer development (Sanguedolce et al., 2019). However, it remains uncertain whether the use of CK20 as a biomarker can aid in distinguishing different types of tumors, particularly in the case of high- and low-grade patterns of tumors (Selves et al., 2018).
Currently, fibroblast growth factor receptor 3 (FGFR3) is among the immunobiological markers that is used to measure progression and recurrence of some tumors. FGFR3 mutations are noted in spermatocytic seminoma, multiple myeloma, and cervical cancer. In multiple myeloma, instances of both mutation and over-expression of FGFR3 exist. About 80% of pTa tumors carry FGFR3 mutations, while 21% of pT1 and 16% of pT2–4 tumors exhibit these mutations. It is also observed that the expression of FGFR3 is higher in high-grade UCC tumors than low-grade tumors (Akanksha and Sandhya, 2019).
It has been posited that detecting the overexpression of all P53, CK20, and FGFR3 as biomarkers may facilitate the differentiation of high- and low-grade urinary bladder urothelial carcinoma and identify tumors that exhibit a heterogeneous pattern. Therefore, The objective of the current investigation is to assess the correlation between the upregulation of P53, CK20, and FGFR3 biomarkers and the histological clssification and grading of the bladder UCCs in selected samples of Iranian patients.
Materials and Methods
Study Design
This cross-sectional study was conducted on 413 specimens obtained from 413 patients diagnosed with bladder UCC at the Shahid Hasheminejad Hospital in Tehran, Iran during the period of 2009-2010. The cases of preoperative mortality and the samples that were not suitable for immunohistochemical staining were excluded. We retrieved baseline characteristics from hospital records, which were subsequently documented. The baseline characteristics included demographic information, disease duration, tumor-related pathological parameters (maximum and minimum diameters, grading, vascular or neural invasions, presence of a heterogenetic pattern on histology, non-papillary features, glandular or squamous differentiation, prostatic urethral invasion, and the presence of carcinoma-in-situ (CIS)), as well as the prognosis and occurrence of relapse. The tumor tissue patterns were accessed using the tissue microarray (TMA) technique.
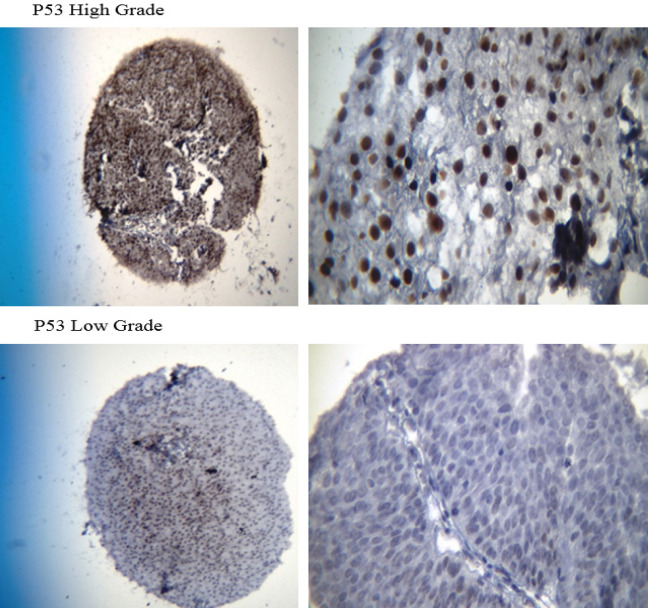
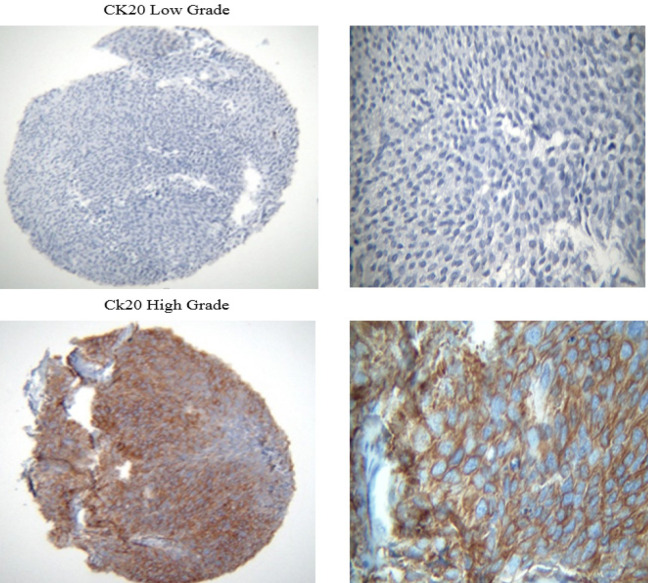
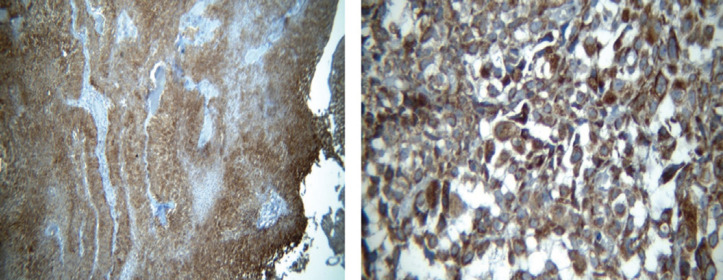
A total number of 413 paraffin-embedded tumor blocks of the bladder UCC were obtained and then stained with hematoxylin and eosin (H&E). Subsequently, the samples were reviewed to locate the tumor areas in the center of the blocks and acquire adequate tissue microarray. The samples were characterized into three high-grade, low-grade, and heterogeneous types based on histology patterns. Of each block, five points from different areas of the tumor tissue were selected with diameters of 0.6 mm and a height of 3-5mm. Upon preparing the TMA blocks, 5-micron specimens were sectioned using a microtome. To remove the tumor tissue folds, the sections were put in an ethanol solution for a few seconds and then placed into a tissue float bath containing distilled water at a temperature of 42°C. Later, the sections were transferred to the charged lams (Thermo Fisher Scientific, Massachusetts, United States) and dried at room temperature. The different steps of deparaffinization and rehydration were further performed by putting the sections in xylol and ethanol, respectively. The specimens were put into hydrogen peroxide 3% for 20 minutes in a dark and wet environment to block the enzymes and other confounders for immunohistochemistry evaluation. Subsequently, they were washed with Tris-buffered saline (TBS) three times for 3-5 minutes. After placing the tissues in an autoclave for 20 minutes, they were then placed in a suitable buffer (Tris-ethylenediaminetetraacetic acid [EDTA], pH=9) and cooled at room temperature. The slides were again washed with TBS three times for 3-5 minutes and then the tissues were exposed to primary P53, core stained (Figure 1; DAKO Mo a Hu P53 Protein, clone Do-7 0.2me and M700129); CK20 antibodies, cytoplasmic stained (Figure 2; abcam76126); and fibroblast growth factor receptor 3 (FGFR3; Figure 3; abcam10651) at 25°C temperature for one hour. Breast tissue was considered the positive control for FGFR3. After washing the samples in TBS, they were incubated with a secondary antibody (Envision K2007) for an hour. For staining, washing with the 3, 3’-diaminobenzidine solution was used for 10 minutes followed by tap water. All of the steps were similarly performed for the negative controls, except for the addition of primary P53, CK20, and FGFR3 antibodies.
Figure 1.
400X (Left) and 1000X (Right) Magnified Images of the P53 Stained Core in High-Grade Urothelial Carcinoma (TMA Specimens), and Unstained Specimen in Low-Grade Urothelial Carcinoma
Figure 2.
400X (Left) and 1000X (Right) Magnified Images of the CK20 Stained Cytoplasm in High-Grade Urothelial Carcinoma (TMA Specimens), and Unstained Specimen in Low-Grade Urothelial Carcinoma
Figure 3.
FGFR3 Stained Cytoplasm in High (Right) and Low (Left) Grade Urothelial Carcinomas
A semi-quantitative scoring system was further employed to score the tissue staining by two pathologists separately. In this regard, the intensity of cell staining was categorized as zero for negative staining in addition to +1, +2, and +3 for weak, moderate, and strong staining, respectively. The percentage of cell staining was also stratified into four categories as Group 1 (˃25% of the cells), Group 2 (25-50% of the cells), Group 3 (50-75% of the cells), and Group 4 (˂75% of the cells).
Ethical Considerations
This research was conducted based on the principles of the Declaration of Helsinki (DoH). The Ethics Committee of Iran University of Medical Sciences, Tehran, Iran also approved the study (Ethical Code #9211100007). This study was extracted from the Pathology Residency Thesis conducted by Faezeh Firouzi at Iran University of Medical Sciences, Tehran, Iran (Research ID #2154).
Statistical Analysis
The study results were presented as mean±standard deviation (SD) for the quantitative variables. Later, they were summarized by absolute frequencies and percentages for categorical variables. The association between biomarker alteration and grade/stage was further examined using Fisher’s exact test and the Chi-square test. The quantitative variables were also analyzed with one-way analysis of variance (ANOVA) and Tukey’s test for post hoc analysis. Moreover, logistic regression was performed to evaluate the effect of the baseline variables. The final analysis was conducted using the SPSS Statistics software (ver. 10.0.5, SPSS Inc, Chicago, United States). The p-value ≤0.05 was considered statistically significant.
Results
A total of 413 samples with UCC were histologically evaluated. The mean age of the patients was 64.44±13.37 years, with a range of 20-95 years, and 79.6% of the cases were male. Tumor grade analysis showed that 43.8% of cases had high-grade tumors, 47.5% had low-grade tumors, and 8.7% had heterogeneous tumors. Furthermore, 10.2% of the specimens were non-papillary, and 7.5% showed carcinoma-in-situ (CIS). Squamous differentiation was found in more than 50% of specimens in 9.3% of the cases, while glandular differentiation was reported in 0.5% of cases. Necrosis was seen in 1.7% of the specimens. Regarding tissue invasions, the vascular invasion was observed in 1.5% of the specimens, and perineural and prostatic urethral invasions were detected in 1.2% and 0.7% of the cases, respectively.
During the follow-up period, 72.9% of the patients survived, while 3.6% of the samples had expired due to UCC and 3.1% had died for other reasons. The etiology of death was uncertain in 20.3% of the patients. Furthermore, cancer relapse was not found in 53% of the patients, while 20% of cases had a single relapse, and 11.8% of patients had repeated relapses. Additionally, a high-grade pattern was observed in 5.5% of the samples, and cystectomy was required in 10.4% of the patients.
The P53 biomarker was found to predict high-grade, low-grade, and heterogeneous patterns. The study results indicated a significant difference in the three groups (high, 136.46±76.40; low, 107.91±66.76; heterogeneous, 89.35±58.82, p-value=0.001). Tukey’s test for post hoc analysis revealed a significant difference in pairwise comparisons (Figure 4). Similarly, the CK20 biomarker was associated with grade difference (high, 112.11±103.17; low, 29.64±44.71, heterogeneous, 38.42±48.44; p-value=0.001; Figure 5).
Figure 4.
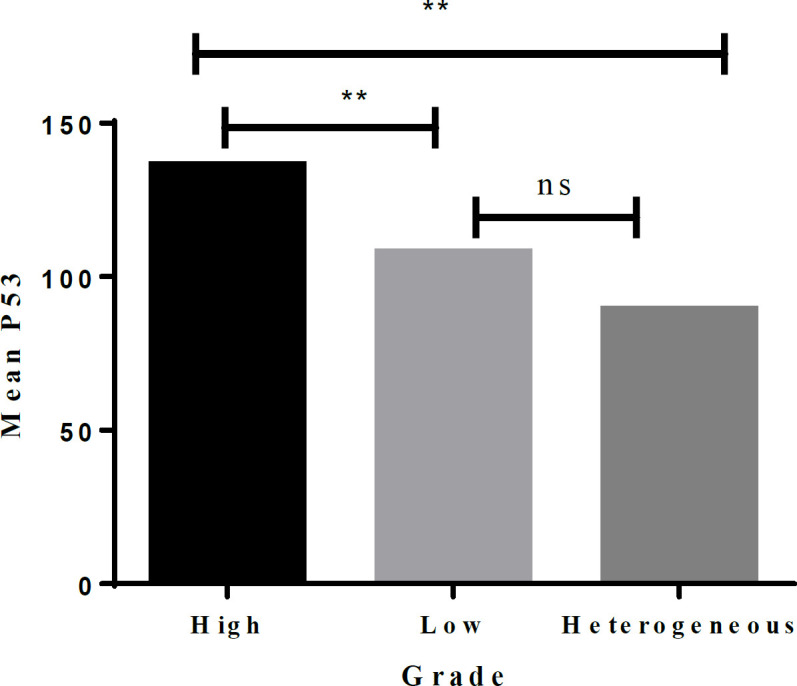
Pairwise Comparison of the Grades for the P53 Biomarker. **, Significant at 5% level; NS, Not significant
Figure 5.
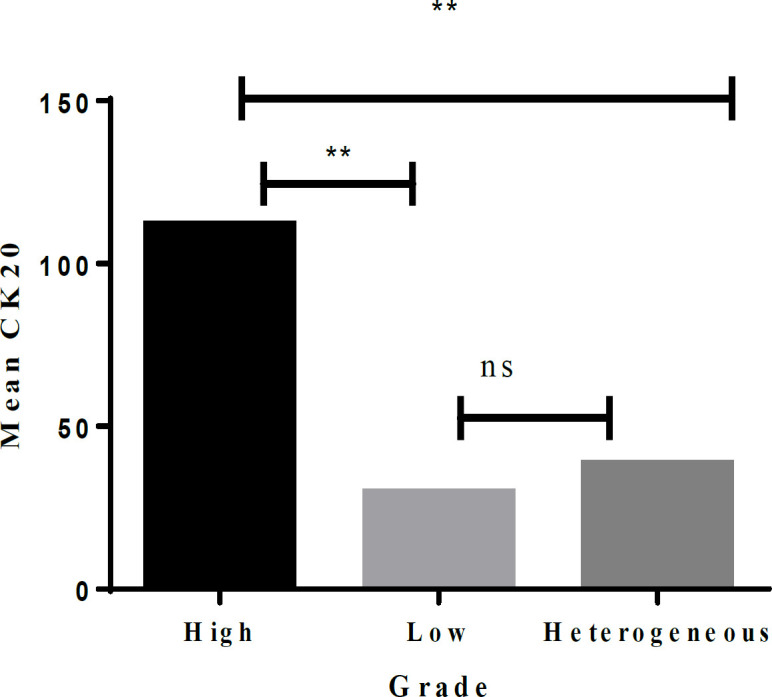
Pairwise Comparison of the Grades for the CK20 Biomarker. **, Significant at 5% level; NS, Not significant
Using the receiver operating characteristic (ROC) curve, the P53 biomarker predicted a high-grade pattern (AUC=0.620) (Figure 6). In this regard, the best cut-off value for the P53 biomarker to differentiate between high- and low-grade patterns was 95.0, yielding a sensitivity of 65.6% and a specificity of 56.0%. Similarly, the CK20 biomarker predicted the high-grade pattern (AUC=0.745) (Figure 7). Accordingly, the best cut-off value for this biomarker to distinguish high-grade from the low-grade pattern was 15.0, producing sensitivity and specificity of 75.3% and 57.8%, respectively.
Figure 6.
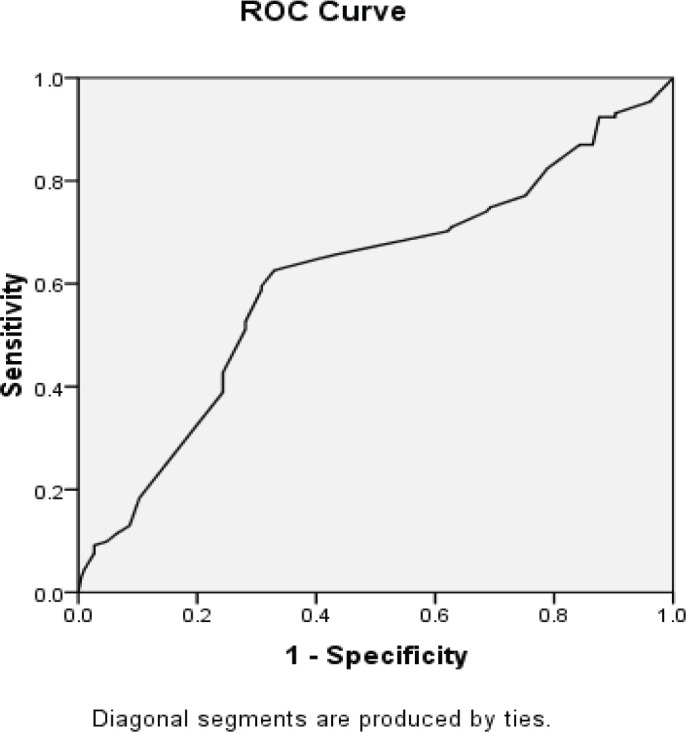
AUC of ROC to Determine the Ability of the P53 Biomarker Value to Predict High- and Low-Grade Patterns of UCC (AUC=0.610)
Figure 7.
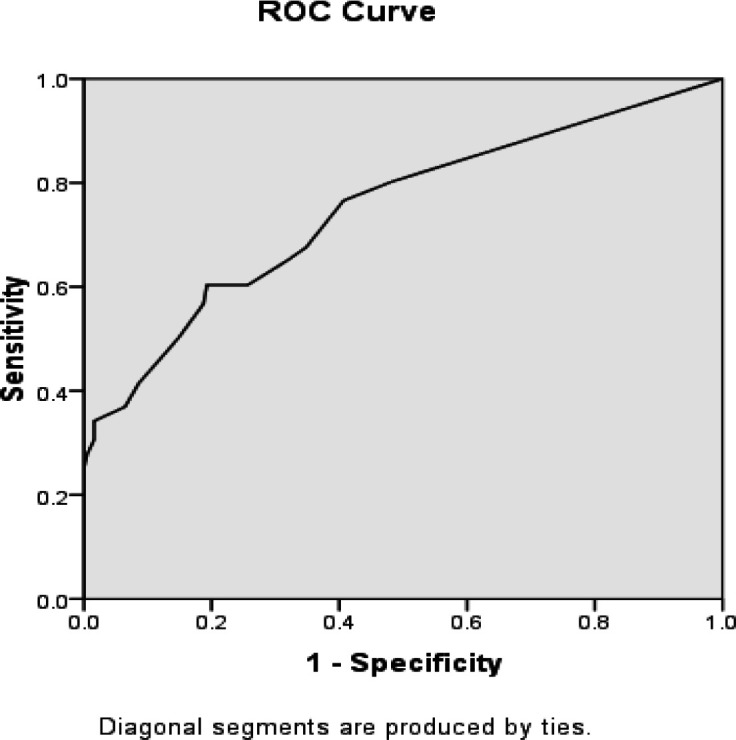
AUC of ROC to Determine the Ability of the CK20 Biomarker Value to Predict High- and Low-Grade Patterns of UCC (AUC=0.748)
The mean histoscore (H-score) for the P53 biomarker was 120.13±70.17 in the survived group and 111.32±79.74 in the group that did not survive. Moreover, no difference was seen between both groups (p=0.416). Based on the multiple logistic regression analysis and concerning the presence of other baseline variables, the findings revealed that the increased expression of the P53 biomarker could not predict mortality in cancer patients (p-value=0.625). In addition, this biomarker failed to predict tumor recurrence since the mean H-score for this biomarker for those with and without relapse was reported as 112.38±77.62 and 123.33±66.60, respectively (p-value=0.153) even after adjusting the baseline variables in multiple logistic regression analysis (p-value= 0.157). The mean H-score for the CK20 biomarker in the survived and non-survived groups was 56.89±76.90 and 74.56±99.84, respectively, with no significant difference (p-value=0.143). Moreover, no significant difference was found in the multiple logistic regression analysis (p-value=0.318). Similarly, the mean H-score for the CK20 biomarker in the groups with and without tumor relapse was 55.90±76.33 and 64.09±86.53, respectively, yielding no significant difference (P-value=0.360). The multiple logistic regression analysis also showed similar findings (P-value=0.383). However, non-papillary pattern (p-value=6.363, p-value=0.001), out of all baseline variables (including patient and tumor characteristics), could effectively predict tumor recurrence (Table 1), but none of the variables predicted tumor prognosis (Table 2).
Table 1.
Main Determinants of Tumor Recurrence in Multiple Logistic Regression Analysis
| B | S.E. | Sig. | Exp (B) | 95.0% CI for EXP (B) | ||
|---|---|---|---|---|---|---|
| Lower | Upper | |||||
| Gender | 0.113 | 0.373 | 0.763 | 1.119 | 0.539 | 2.326 |
| Age | 0.009 | 0.011 | 0.449 | 1.009 | 0.986 | 1.032 |
| Grade | 0.687 | 0.574 | 0.232 | 1.987 | 0.645 | 6.12 |
| Hetrog | 1.512 | 0.383 | 0 | 4.535 | 2.141 | 9.602 |
| Size | 0.164 | 0.304 | 0.589 | 1.178 | 0.65 | 2.136 |
| LP | -0.758 | 0.524 | 0.148 | 0.469 | 0.168 | 1.309 |
| M | 0.302 | 0.59 | 0.609 | 1.353 | 0.425 | 4.302 |
| non. papi | 1.851 | 0.511 | 0 | 6.363 | 2.339 | 17.313 |
| CIS | 1.405 | 0.759 | 0.064 | 4.075 | 0.921 | 18.028 |
| Squ. diff | -0.415 | 0.77 | 0.59 | 0.66 | 0.146 | 2.989 |
| Necrosis | -19.703 | 1.43E+04 | 0.999 | 0 | 0 | . |
| History | 0.432 | 0.322 | 0.179 | 1.54 | 0.82 | 2.894 |
| Constant | -4.056 | 1.514 | 0.007 | 0.017 | ||
a, The variable(s) entered into step 1: gender, age, grade, Hetrog, (heterogeneity); size, LP, (lamina propria invasion); M, (muscular invasion); Non-papi, (non-papillary pattern); CIS, (carcinoma in-situ); Squ.diff, (squamous-differentiation); necrosis, and history; b, Abbreviations: B (coefficient for the constant/intercept), SE, (standard error); Sig, (significance probability); Exp(B), (exponentiation of the B coefficient); CI, (confidence interval).
Table 2.
Main Determinants of Tumor Prognosis in Multiple Logistic Regression Analysis
| B | S.E. | Sig. | Exp (B) | 95.0% CI for EXP(B) | ||
|---|---|---|---|---|---|---|
| Lower | Upper | |||||
| Gender | -0.074 | 0.456 | 0.872 | 0.929 | 0.38 | 2.271 |
| Age | 0.014 | 0.015 | 0.356 | 1.014 | 0.985 | 1.043 |
| Grade | -0.941 | 0.63 | 0.135 | 0.39 | 0.113 | 1.342 |
| Hetrog | 0.166 | 0.668 | 0.804 | 1.18 | 0.319 | 4.369 |
| Size | 0.106 | 0.315 | 0.737 | 1.111 | 0.6 | 2.06 |
| LP | 0.509 | 0.613 | 0.406 | 1.663 | 0.501 | 5.524 |
| M | -0.017 | 0.467 | 0.97 | 0.983 | 0.393 | 2.456 |
| Non-papi | 0.001 | 0.52 | 0.999 | 1.001 | 0.361 | 2.775 |
| CIS | -0.012 | 0.824 | 0.988 | 0.988 | 0.197 | 4.963 |
| Squ.diff | 0.329 | 0.452 | 0.466 | 1.39 | 0.574 | 3.368 |
| Necrosis | 1.243 | 0.918 | 0.176 | 3.465 | 0.573 | 20.955 |
| History | -0.77 | 0.483 | 0.111 | 0.463 | 0.18 | 1.192 |
| Constant | -1.975 | 1.727 | 0.253 | 0.139 | ||
a. The variable(s) entered into step 1: gender, age, grade, Hetrog (heterogeneity), size, LP (lamina propria invasion), M (muscular invasion), Non-papi (non-papillary pattern), CIS (carcinoma in-situ), Squ.diff (squamous-differentiation), necrosis, and history; b. Abbreviations: B, (coefficient for the constant/intercept); SE, (standard error); Sig, (significance probability); Exp(B), (exponentiation of the B coefficient); CI, (confidence interval).
However, the FGFR3 biomarker was positive in all of the specimens and; therefore, was not a valuable biomarker for differentiating the patterns.
Discussion
The discrimination of high- and low-grade tumor patterns using diverse biomarkers is crucial due to the distinct prognostic and relapse tendencies associated with different stages of UCC. Hence, the identification of the most sensitive and specific biomarkers is considered the primary objective of clinical research. P53, CK20, FGFR3 are two diagnostic biomarkers widely utilized in human cancers due to their essential roles in cell growth and differentiation. The present investigation aimed to evaluate the potential of P53, CK20 and FGFR3 biomarkers in discriminating between high-grade and low-grade tumor patterns, as well as their prognostic and relapse prediction value in bladder UCC. The study considered two cancer tissue features, namely the intensity of cellular staining and the percentage of staining, related to the expressions of the selected biomarkers. The findings indicate that P53 and CK20 biomarkers, unlike FGFR3, can differentiate high-grade from low-grade bladder UCC. However, their overexpression did not facilitate the discrimination of heterogeneous patterns. Furthermore, only heterogeneous and non-papillary patterns demonstrated a significant ability to predict tumor recurrence, while none of the variables were able to predict tumor prognosis.
Some studies have already determined the value of the P53 biomarker in differentiating the tumors of the bladder UCCs regarding the tumor grading, heterogeneity, and outcome or prognosis. As indicated by Hitching et al., (2004), the expression of the P53 biomarker was a valuable factor for predicting the poor prognosis of the UCC of the bladder. In addition, Jebar et al., (2005) found an association between the overexpression of the P53 biomarker and the high-grade pattern of the tumor. Netto et al., (2011) reported an association between the expression of the P53 biomarker and muscular invasion as well as higher grades of the tumor. Moreover, Sarkis et al., (1993) reported that P53 was an independent biomarker for predicting the progression of UCCs of the bladder. Mhawech et al., (2002) have concluded that the expression of the P53 biomarker is very capable of predicting high-grade UCC of the bladder.
Regarding the value of the CK20 biomarker in differentiating the high- and low-grade UCC of the bladder, some studies had shown similar findings. Mumtaz et al., (2014) demonstrated that upon staining the tumor specimens with the CK20 biomarker, the overexpression of this biomarker on the high-grade UCC of the bladder was significant. However, this expression was not detected in low-grade cases. Moreover, Mai et al., (2017) have similarly reported a high value of the CK20 biomarker to predict the high-grade tumor pattern. In case of FGFR3, however our investigation indicated that it is not a valuable marker in differentiating UCC, in a study it is found out that 18% of the UCC samples were positive the marker, with significantly higher rate of expression in low-grade carcinomas (Akanksha and Sandhya, 2019). The small sample size of this study and the samples being paraffin embedded were the major limitations of this study. Therefore, further investigation with larger samples size and fresh samples is required to elucidate the exact rule of the markers, especially, FGFR3 in UCC.
In conclusion, the differentiation between high- and low-grade patterns could be achieved by determining the intensity and the percentage of cell staining for the P53 and CK20 biomarkers of the UCC of the bladder. Furthermore, the likelihood of tumor relapse could be predicted by reflecting on heterogeneous and non-papillary patterns.
Author Contribution Statement
All authors passed the four criteria for authorship contribution based on recommendations of the International Committee of Medical Journal Editors. MA, FF, and MB conducted the research and wrote the primary draft. EA, MA, MM, ZM, and MB prepared the manuscript. MB and EA prepared the final paper. FF conducted the final check and scientific edition of the paper. SH conducted the final edition. All authors read and approved the final paper.
Acknowledgements
Funding statement
This research was funded by Iran University of Medical Sciences and resulted of a pathology residency thesis conducted by Dr. Faezeh Firouzi under the research ID 2154.
Ethical issues
This research was conducted based on the principles of the Declaration of Helsinki and approved by the Ethics Committee of Iran University of Medical Sciences, Tehran, Iran also approved the study under the ethical code 9211100007.
Availability of data
The datasets generated and/or analyzed in this manuscript are available from the corresponding author on reasonable request.
Conflicts of interest
The authors declare that they do not have any conflict of interest.
References
- Akanksha M, Sandhya S. Role of FGFR3 in Urothelial Carcinoma. Iran J Pathol. 2019;14:148–55. doi: 10.30699/IJP.14.2.148. [DOI] [PMC free article] [PubMed] [Google Scholar]
- Aubrey BJ, Kelly GL, Janic A, et al. How does p53 induce apoptosis and how does this relate to p53-mediated tumour suppression? Cell Death Differ. 2018;25:104–13. doi: 10.1038/cdd.2017.169. [DOI] [PMC free article] [PubMed] [Google Scholar]
- Chen J. The Cell-Cycle Arrest and Apoptotic Functions of p53 in Tumor Initiation and Progression. Cold Spring Harb Perspect Med. 2016;6:a026104. doi: 10.1101/cshperspect.a026104. [DOI] [PMC free article] [PubMed] [Google Scholar]
- Ciccarese C, Massari F, Blanca A, et al. Tp53 and its potential therapeutic role as a target in bladder cancer. Expert Opin Ther Targets. 2017;21:401–14. doi: 10.1080/14728222.2017.1297798. [DOI] [PubMed] [Google Scholar]
- Di Pierro GB, Gulia C, Cristini C, et al. Bladder cancer: a simple model becomes complex. Curr Genomics. 2012;13:395–415. doi: 10.2174/138920212801619232. [DOI] [PMC free article] [PubMed] [Google Scholar]
- Ghosh S, Bhattacharjee M, Jana NK. Gene Regulation by p53 in Human Cancer System. Asian Pac J Cancer Biol. 2022;7:97–109. [Google Scholar]
- Hitchings AW, Kumar M, Jordan S, et al. Prediction of progression in pTa and pT1 bladder carcinomas with p53, p16 and pRb. Br J Cancer. 2004;91:552–7. doi: 10.1038/sj.bjc.6601954. [DOI] [PMC free article] [PubMed] [Google Scholar]
- Hodgson A, Xu B, Downes MR. p53 immunohistochemistry in high-grade urothelial carcinoma of the bladder is prognostically significant. Histopathology. 2017;71:296–304. doi: 10.1111/his.13225. [DOI] [PubMed] [Google Scholar]
- Jebar AH, Hurst CD, Tomlinson DC, et al. FGFR3 and Ras gene mutations are mutually exclusive genetic events in urothelial cell carcinoma. Oncogene. 2005;24:5218–25. doi: 10.1038/sj.onc.1208705. [DOI] [PubMed] [Google Scholar]
- Mai KT, Bateman J, Djordjevic B, et al. Clear Cell Urothelial Carcinoma. Int J Surg Pathol. 2017;25:18–25. doi: 10.1177/1066896916660195. [DOI] [PubMed] [Google Scholar]
- McConkey DJ, Lee S, Choi W, et al. Molecular genetics of bladder cancer: Emerging mechanisms of tumor initiation and progression. Urol Oncol. 2010;28:429–40. doi: 10.1016/j.urolonc.2010.04.008. [DOI] [PMC free article] [PubMed] [Google Scholar]
- Mhawech P, Uchida T, Pelte MF. Immunohistochemical profile of high-grade urothelial bladder carcinoma and prostate adenocarcinoma. Hum Pathol. 2002;33:1136–40. doi: 10.1053/hupa.2002.129416. [DOI] [PubMed] [Google Scholar]
- Mumtaz S, Hashmi AA, Hasan SH, et al. Diagnostic utility of p53 and CK20 immunohistochemical expression grading urothelial malignancies. Int Arch Med. 2014;7:36. doi: 10.1186/1755-7682-7-36. [DOI] [PMC free article] [PubMed] [Google Scholar]
- Netto GJ. Molecular biomarkers in urothelial carcinoma of the bladder: are we there yet? Nat Rev Urol. 2011;9:41–51. doi: 10.1038/nrurol.2011.193. [DOI] [PubMed] [Google Scholar]
- Sanguedolce F, Russo D, Calò B, et al. Diagnostic and prognostic roles of CK20 in the pathology of urothelial lesions. A systematic review. Pathol Res Pract. 2019;215:152413. doi: 10.1016/j.prp.2019.04.005. [DOI] [PubMed] [Google Scholar]
- Sarkis AS, Dalbagni G, Cordon-Cardo C, et al. Nuclear overexpression of p53 protein in transitional cell bladder carcinoma: a marker for disease progression. J Natl Cancer Inst. 1993;85:53–9. doi: 10.1093/jnci/85.1.53. [DOI] [PubMed] [Google Scholar]
- Selves J, Long-Mira E, Mathieu MC, et al. Immunohistochemistry for Diagnosis of Metastatic Carcinomas of Unknown Primary Site. Cancers (Basel) 2018:10. doi: 10.3390/cancers10040108. [DOI] [PMC free article] [PubMed] [Google Scholar]
- Shipman R, Schraml P, Moch H, et al. p53 protein accumulation and p53 gene alterations (RFLP, VNTR and p53 gene mutations) in non-invasive versus invasive human transitional bladder cancer. Int J Oncol. 1997;10:801–6. doi: 10.3892/ijo.10.4.801. [DOI] [PubMed] [Google Scholar]
- Smal MP, Rolevich AI, Polyakov SL, et al. FGFR3 and TP53 mutations in a prospective cohort of Belarusian bladder cancer patients. Exp Oncol. 2014;36:246–51. [PubMed] [Google Scholar]
- Wallerand H, Bakkar AA, de Medina SG, et al. Mutations in TP53, but not FGFR3, in urothelial cell carcinoma of the bladder are influenced by smoking: contribution of exogenous versus endogenous carcinogens. Carcinogenesis. 2005;26:177–84. doi: 10.1093/carcin/bgh275. [DOI] [PubMed] [Google Scholar]
- Wu G, Wang F, Li K, et al. Significance of TP53 mutation in bladder cancer disease progression and drug selection. Peer J. 2019;7:e8261. doi: 10.7717/peerj.8261. [DOI] [PMC free article] [PubMed] [Google Scholar]
- Zarifmahmoudi L, Ghorbani H, Sadri K, et al. Sentinel Node Biopsy in Urothelial Carcinoma of the Bladder: Systematic Review and Meta-Analysis. Urol Int. 2019;103:373–82. doi: 10.1159/000497310. [DOI] [PubMed] [Google Scholar]
Associated Data
This section collects any data citations, data availability statements, or supplementary materials included in this article.
Data Availability Statement
The datasets generated and/or analyzed in this manuscript are available from the corresponding author on reasonable request.


