Abstract
This study compared the proliferation and differentiation potential of bone marrow–derived mesenchymal stem cells (BMSCs) derived from infants with polydactyly and adults with basal joint arthritis. The proliferation rate of adult and infant BMSCs was determined by the cell number changes and doubling times. The γH2AX immunofluorescence staining, age-related gene expression, senescence-associated β-galactosidase (SA-β-gal) staining were analyzed to determine the senescence state of adult and infant BMSCs. The expression levels of superoxide dismutases (SODs) and genes associated with various types of differentiation were measured using Real-Time Quantitative Polymerase Chain Reaction (RT-qPCR). Differentiation levels were evaluated through histochemical and immunohistochemical staining. The results showed that infant BMSCs had a significantly higher increase in cell numbers and faster doubling times compared with adult BMSCs. Infant BMSCs at late stages exhibited reduced γH2AX expression and SA-β-gal staining, indicating lower levels of senescence. The expression levels of senescence-related genes (p16, p21, and p53) in infant BMSCs were also lower than in adult BMSCs. In addition, infant BMSCs demonstrated higher antioxidative ability with elevated expression of SOD1, SOD2, and SOD3 compared with adult BMSCs. In terms of differentiation potential, infant BMSCs outperformed adult BMSCs in chondrogenesis, as indicated by higher expression levels of chondrogenic genes (SOX9, COL2, and COL10) and positive immunohistochemical staining. Moreover, differentiated cells derived from infant BMSCs exhibited significantly higher expression levels of osteogenic, tenogenic, hepatogenic, and neurogenic genes compared with those derived from adult BMSCs. Histochemical and immunofluorescence staining confirmed these findings. However, adult BMSCs showed lower adipogenic differentiation potential compared with infant BMSCs. Overall, infant BMSCs demonstrated superior characteristics, including higher proliferation rates, enhanced antioxidative activity, and greater differentiation potential into various lineages. They also exhibited reduced cellular senescence. These findings, within the context of cellular differentiation, suggest potential implications for the use of allogeneic BMSC transplantation, emphasizing the need for further in vivo investigation.
Keywords: bone marrow–derived mesenchymal stem cells, proliferation, senescence, antioxidative activity, multilineage differentiation
Introduction
Bone marrow–derived mesenchymal stem cells (BMSCs) have demonstrated the ability to undergo proliferation and maintain their stemness in vitro. They can also be directed to differentiate into various lineages, including hepatic, neurogenic, adipogenic, osteogenic, and chondrogenic lineages 1 . These characteristics, combined with their ease of isolation and expansion in culture, as well as their low tumor-forming potential, make BMSCs a promising tool for clinical applications in cartilage regeneration, bone and nerve repair, and tendon healing2–5. In addition, BMSCs serve as a valuable cell model for studying multilineage differentiation in vitro 6 .
Some studies have reported a decrease in the number of human BMSCs progenitor cells with age7–9, while others have found no significant relationship between BMSCs number and age. The differentiation ability of BMSCs has been described as both age-dependent10,11 and age-independent10,12–15. For example, Beane et al. 16 reported lower cell yields and impaired adipogenesis in BMSCs with increasing age. However, Scharstuhl et al. 17 demonstrated that the chondrogenic potential of BMSCs remained unaffected by age or osteoarthritis etiology. Moreover, Chen 18 even reported a decrease in growth and osteogenic differentiation potential in BMSCs from young male mice. The regenerative capacity of aged BMSCs remains a topic of debate. Due to limited availability of samples, there is comparatively less documentation on human infant BMSCs.
The incidence of chronic diseases, such as osteoarthritis, osteoporotic fractures, and neurological degenerative disorders, raises with age. Autologous stem cells transplantation is a preferred option due to lower post-transplantation immune rejection and ethical concerns. However, the capabilities of BMSCs from elderly patients might not be as robust as those from younger individuals. On the other hand, the potential of human infant BMSCs remains underexplored due to the challenges associated with their collection. In this study, infant BMSCs were obtained from the phalanges of excised redundant fingers or thumb after surgical reconstruction of polydactyly children. The prevalence of polydactyly in Taiwan was reported to be 16.57 per 10,000 births between 2014 and 2005 19 . Most children underwent surgery to remove the extra fingers or thumb before the age of 2. Adult BMSCs, on the other hand, were collected from the carpal bones, including trapezium, which were removed during trapezium excision surgery to treat basal joint arthritis. The collected trapezium remains intact without any signs of inflammation. This collection process does not cause additional pain to patients, and the discarded phalanges and carpal bones serve as a source of BMSCs. The objective of this study is to compare the potential for adipogenic, osteogenic, chondrogenic, neurogenic, and hepatogenic differentiation between adult and infant BMSCs.
Materials and Methods
Isolation and Expansion of Adult and Infant BMSCs
The samples of human adult BMSCs samples (n = 3) were obtained from the excised carpal bones following surgery for basal joint arthritis, with an age range of 37–81 years. In addition, human infant BMSCs (n = 3) samples, aged between 1 and 3 years, were collected from the bone of excised redundant thumb or finger after surgical reconstruction for polydactyly children. The protocol and procedure employed in this study were approved by the Institutional Review Board (IRB). To isolate the mononuclear BMSCs, the density gradient centrifugation method was utilized. The nucleated cells were subsequently plated at clonal density and cultured in a modified minimum essential medium (α-MEM), supplemented with 10 % fetal bovine serum (FBS), 100 U/ml penicillin, 100 μg/ml streptomycin, and 250 ng/ml amphotericin B. The growth medium was refreshed every 2 days, and the cells were passaged every 4 days at 1:5 split, prior to reaching 80% confluence in terms of cellular densities.
All subsequent experiments involving multiple differentiation were performed using three donors from both the infant and adult groups. Individual testing was conducted for each donor, and the results were then averaged.
Flow Cytometric Analysis
The BMSCs were harvested in 5 mM ethylenediaminetetraacetic acid (EDTA) in phosphate-buffered saline (PBS) and incubated with the following anti-human antibodies, including anti-CD29–phycoerythrin (PE), anti-CD73–allophycocyanin (APC), anti-CD90–fluorescein isothiocyanate (FITC, Becton Dickinson, San Jose, CA), anti-CD105–cyanine (Cy5.5), anti-CD44–PE, anti-CD14–PE, anti-CD79a–PE, anti-CD11b–PE, anti-CD19–PE, anti-CD34–PE, anti-CD45–PE, and anti-HLA-DR–PE. Mouse isotype antibodies (Becton Dickinson and Beckman Coulter) were used as controls. Ten thousand labeled cells were analyzed using a FACSCanto II Cytometer System running Diva software (Becton Dickinson, San Jose, CA, USA).
Proliferation
The adult and infant BMSCs, which were seeded at a density of 1 × 10⁵ cells in 10-cm dish, were passaged every 7 days. The seeding density and incubation times remained constant throughout the study. The increased cellular numbers at each passage were counted to calculate the fold changes of cell number and doubling time of BMSCs.
Real-Time Quantitative Polymerase Chain Reaction
Total RNA was extracted using Trizol reagent (Invitrogen). First-strand cDNA was synthesized by random sequence primers and SuperScriptTM III Reverse Transcriptase (Invitrogen) to prime reverse transcription reactions. The cDNA in a reaction mixture containing specific primer pairs (Table 1) and the fast SYBR® Green 189 Master Mix (Applied Biosystems, Foster City, CA, USA) to achieve Real-Time Quantitative Polymerase Chain Reaction (RT-qPCR). Glyceraldehyde-3-phosphate dehydrogenase (GAPDH) gene was as an internal control. The results were analyzed using the software supplied with the StepOneTM (Applied Biosystem) using the comparative CT (ΔΔCT) method 20 .
Table 1.
Primer Sequences Used for RT-qPCR Analysis.
| Gene | Forward primer (5′–3′) | Reverse primer (5′–3′) |
|---|---|---|
| p16 | ATCATCAGTCACCGAAGG | TCAAGAGAAGCCAGTAACC |
| p21 | CATCTTCTGCCTTAGTCTCA | CACTCTTAGGAACCTCTCATT |
| p53 | CGGACGATATTGAACAATGG | GGAAGGGACAGAAGATGAC |
| TERT | AAATGCGGCCCCTGTTTCT | CAGTGCGTCTTGAGGAGCA |
| SOD1 | GTGATTGGGATTGCGCAGTA | TGGTTTGAGGGTAGCAGATGAGT |
| SOD2 | TTAACGCGCAGATCATGCA | GGTGGCGTTGAGATTGTTCA |
| SOD3 | CATGCAATCTGCAGGGTACAA | AGAACCAAGCCGGTGATCTG |
| SOX9 | CCAGGGCACCGGCCTCTACT | TTCCCAGTGCTGGGGGCTGT |
| COL2 | TTCAGCTATGGAGATGACAATC | AGAGTCCTAGAGTGACTGAG |
| COL10 | CAAGGCACCATCTCCAGGAA | AAAGGGTATTTGTGGCAGCATATT |
| ALP | ACCATTCCCACGTCTTCACATTTG | AGACATTCTCTCGTTCACCGCC |
| OPN | GGACCTGCCAGCAACCGAAGT | GCACCATTCAACTCCTCGCTTTCC |
| DCN | CTCTGCTGTTGACAATGGCTCTCT | TGGATGGCTGTATCTCCCAGTACT |
| MMP3 | CTGTTGATTCTGCTGTTGAG | AAGTCTCCATGTTCTCTAACTG |
| PPARγ | TCAGGTTTGGGCGGATGC | TCAGCGGGAAGGACTTTATGTATG |
| LPL | TGTAGATTCGCCCAGTTTCAGC | AAGTCAGAGCCAAAAGAAGCAGC |
| AFP | GGCGGTGAGTGTCAGGATAG | AGGTGCATACAGGAAGGGATG |
| ALB | TGCTTGAATGTGCTGATGACAGGG | AAGGCAAGTCAGCAGGCATCTCATC |
| MAP2 | CAAACGTCATTACTTTACAACTTGA | CAGCTGCCTCTGTGAGTGGAG |
| NEFH | AGTGGTTCCGAGTGAGATTG | CTGCTGAATTGCATCCTGGT |
| GCLM | GGCGGTGAGTGTCAGGATAG | GGCGGTGAGTGTCAGGATAG |
| CAT | TTAATCCATTCGATCTCACC | GGCGGTGAGTGTCAGGATAG |
| GADPH | ATATTGTTGCCATCAATGACC | GATGGCATGGACTGTGGTCATG |
γH2AX Immunostaining
The adult and infant BMSCs at passage three to five were permeabilized by a permeabilization buffer (0.1% Triton X-100 in PBS) and treated with primary antibodies against γH2AX (tcba13051; Taiclone Biotech Corp., Taipei, Taiwan). The DyLight 488-conjugated goat anti-rabbit immunoglobulin G (IgG) secondary antibodies (GTX213110-01; GeneTex Inc., Irvine, CA, USA) were used to show green fluorescence. The nuclei were counterstained with 4′,6-diamidino-2-phenylindole (DAPI; F6057; Sigma-Aldrich, St Louis, MO, USA). Fluorescence intensity from 60 to 100 cells was determined by the Image-Pro Plus (v4.5.0.29, Media Cybernetics, Silver Spring, MD, USA). The intensity of adult BMSCs was considered as a standard to compare the relative folds of intensity of infant BMSCs.
Chondrogenic Differentiation In Vitro
At passages 3–5, 2.5 × 10⁵ adult or infant BMSCs were incubated in an induction medium contained the serum-free and high-glucose (4.5 g/l) Dulbecco’s modified Eagle’s medium (HG-DMEM) (Gibco, Grand Island, NY, USA) with 10-7 M dexamethasone (Sigma-Aldrich), 50 μg/ml ascobate-2-phosphate (Sigma-Aldrich), 50 μg/ml L-proline, 10 ng/ml transforming growth factor-β1 (TGF-β1) (R&D Systems, Minneapolis, MN, USA) and Insulin-Transferrin-Selenium (ITS) plus Premix (BD Biosciences, San Jose, CA, USA). After centrifugation at 1500 rpm for 5 min to form a pellet, the sample was transferred into a culture incubator for cultivation and cultured in 5% CO2 at 37°C. The medium changed every 3 days, and the chondrogenic pellets were observed and harvested at days 7, 14, and 21 for RT-qPCR detection during the induction 21 .
Immunohistochemistry Staining and Quantification
The equivalent diameter of the chondrogenic pellets formed by the adult and infant BMSCs was measured on day 21. The sections of the paraffin embedded pellets were stained with Alcian blue (ANC500; ScyTek Laboratories, UT, USA) to detect proteoglycan, and then stained with nuclear fast red staining (NFS125; ScyTek). For collagen type 2 (COL2) and collagen type 10 (COL10) detection, the sections were deparaffinized, hydrated, and treated with 0.4 mg/ml proteinase K for 15 min, and 3 % hydrogen peroxide (Sigma-Aldrich) was used to block the endogenous peroxidase activity. After washing and blocking, the sections were incubated with the primary antibodies against COL2 (MAB8887; Millipore Corporation, Burlington, MA, USA) or COL10 (ab58632; Abcam, Cambridge, MA, USA) overnight at 4°C, and incubated with the secondary anti-rabbit polymer–horseradish peroxidase (HRP) in the Super Sensitive™ Polymer-HRP Detection Systems (QD420-YIKE, Biogenex, San Ramon, CA, USA) for 30 min. The 3,3′-diaminobenzidine (DAB) substrate and hematoxylin were used to reveal the staining. The staining intensities in the areas of the adult and infant BMSC-differentiated pellets were quantified by the image analysis software (ImageJ, National Institute of Health, USA), and the values were compared to calculate the relative fold.
Osteogenic Differentiation
The adult and infant BMSCs at passages 3–5 were treated in an induction medium to induce osteogenic differentiation. The medium was an α-MEM supplemented with 10% FBS, 50 μg/ml ascorbic acid-2 phosphate (Nacalai, Kyoto, Japan), 0.01 μM dexamethasone (Sigma-Aldrich), and 1 mM b-glycerol phosphate (Sigma-Aldrich), and cultured at 37°C and 5% CO2. The differentiation was monitored and harvested at days 7, 14, and 21 for RT-qPCR detection during the induction.
Alizarine Red S Staining
The osteogenic differentiated cells were fixed and stained with ARS (A5533; Sigma-Aldrich), an anthraquinone dye that was used to detect calcium deposits. The quantification assay was applied to determine the osteogenesis induction of the adult and infant BMSCs by extracting the ARS from the stained cells with a 10% cetylpyridinium chloride (CPC) buffer, and the optical density (OD) of the extract was measured at 550 nm by an enzyme-linked immunosorbent assay (ELISA) reader (Spectra MAX 250; Molecular Devices, Sunnyvale, CA, USA).
Tenogenic Differentiation
The adult and infant BMSCs at passages 3–5 were induced in a medium that contained Dulbecco’s modified Eagle medium with low glucose (LG-DMEM) with 10% FBS, 50 μg/ml ascorbic acid (AA; Sigma-Aldrich), and 100 ng/ml connective tissue growth factor (CTGF) 22 , and maintained at 37°C and 5% CO2 and monitored at days 7, 14, and 21 for RT-qPCR detection during the induction.
Picro-Sirius Red Staining
The total collagen deposition of the differentiated cells was evaluated at the cell density of 3 × 10³ cells/cm2. Samples were fixed in Bouin’s solution (Bouin’s Fixative, Electron Microscopy Sciences, USA) for 1 h and collagen fibers stained with 0.1% Picro-Sirius Red (ScyTek Laboratories) saturated in picric acid (Sigma-Aldrich). The collagen matrix deposition was finally visualized under polarized light microscopy 23 . After staining, the Picro-Sirius Red from the stained cells were extracted with a 0.2 M NAOH and methanol (1:1) buffer to quantify the stained collagen, and the OD of the extract was measured at 550 nm using an ELISA reader (Spectra MAX 250; Molecular Devices, Sunnyvale, CA).
Adipogenic Differentiation
The adult and infant BMSCs at passages 3–5 were induced in an induction medium that contained an α-MEM supplemented with 10% FBS, 50 μg/ml ascorbic acid-2 phosphate, 0.1 μM dexamethasone, 50 μM indomethacin (Sigma-Aldrich), 45 μM 3-isobutyl-1-methylxanthine (Sigma-Aldrich), and 1 μg/ml insulin (Sigma-Aldrich), which were applied to induce adipogenic differentiation at 37°C and 5% CO2 and monitored at days 7, 14, and 21 for RT-qPCR detection during the induction.
Oil Red O Staining
The differentiated cells were fixed in 10% formalin for over 1 h at room temperature and stained with Oil Red-O (O9755; Sigma-Aldrich) for 2 h. The Oil Red-O working solution was prepared by mixing 15 ml of a stock (0.5% in isopropanol) and 10 ml of distilled water, and filtered through a polyvinylidene difluoride (PVDF) membrane (0.2 µm) filter. After staining, the Oil Red-O from the stained cells was extracted with isopropanol to quantify the lipid accumulation, and the OD of the extract was measured at 510 nm using an ELISA reader (Spectra MAX 250).
Hepatogenic Differentiation
The adult and infant BMSCs were induced in a step 1 induction medium that was an LG-DMEM containing the 20 ng/ml human epidermal growth factor (hEGF, Sigma-Aldrich) and a 10 ng/ml human fibroblast growth factor-basic (hBFGF, Sigma-Aldrich) at 37°C and 5% CO2 for 24 h. Then, the differentiation was treated with a step 2 induction medium comprising the LG-DMEM supplemented with the 20 ng/ml human hepatocyte growth factor (hHGF, Sigma-Aldrich), 10 ng/ml hBFGF, and 0.61 mg/ml nicotinamide (Sigma-Aldrich) for 7 days. The step 3 induction medium, which contained the LG-DMEM supplemented with 20 ng/ml oncostatin (R&D System), 10−6 M dexamethasone (Sigma-Aldrich), and ITS-premix (Corning life science), was used for induction for 7 days 24 . The total process of differentiation lasted 15 days. The differentiation was monitored at days 2, 9, and 16 for RT-qPCR detection during the induction.
Neurogenic Differentiation
The adult and infant BMSCs at passages 3–5 were induced by an LG-DMEM supplemented with 50 μM all-trans-retinoic acid (RA; Sigma-Aldrich) and 1 mM 2-mercaptoethanol (β-ME; Sigma-Aldrich) in a 37°C and 5% CO2 incubator for 24 h 25 . Then, the differentiated cells were maintained with the LG-DMEM containing 1% FBS and monitored from 1, 3, 5, and 7 days for RT-qPCR detection.
Immunofluorescence Staining and Quantification
Primary antibodies against albumin (Taiclone Biotech Corp., Taipei, Taiwan), microtubule-associated protein 2 (MAP2; GTX11267; GeneTex Inc.) and neurofilament heavy polypeptide (NEFH; BM4078S; OriGene Technologies, Medical Center Drive, MD, USA) at appropriate dilution were incubated with the differentiated cells on slides, then the cells were incubated with DyLight 488-conjugated goat anti-mouse IgG (A90-516D2; Bethyl Laboratories Inc., Montgomery, TX, USA) secondary antibodies. Each sample was counterstained with DAPI (Vector Labs) and detected by an Olympus BX43 microscope (Tokyo, Japan). Immunofluorescence intensities were quantified by the ImageJ.
Statistical Analysis
The quantitative analysis of results was performed by Prism (version 5.03, GraphPad, La Jolla, California, USA). Data were exhibited in mean ± standard error. Statistical significance of the data was determined by the Mann–Whitney U test, and a result was considered significant when the P value was less than 0.05.
Results
Cell Proliferation of the Adult and Infant Human BMSC
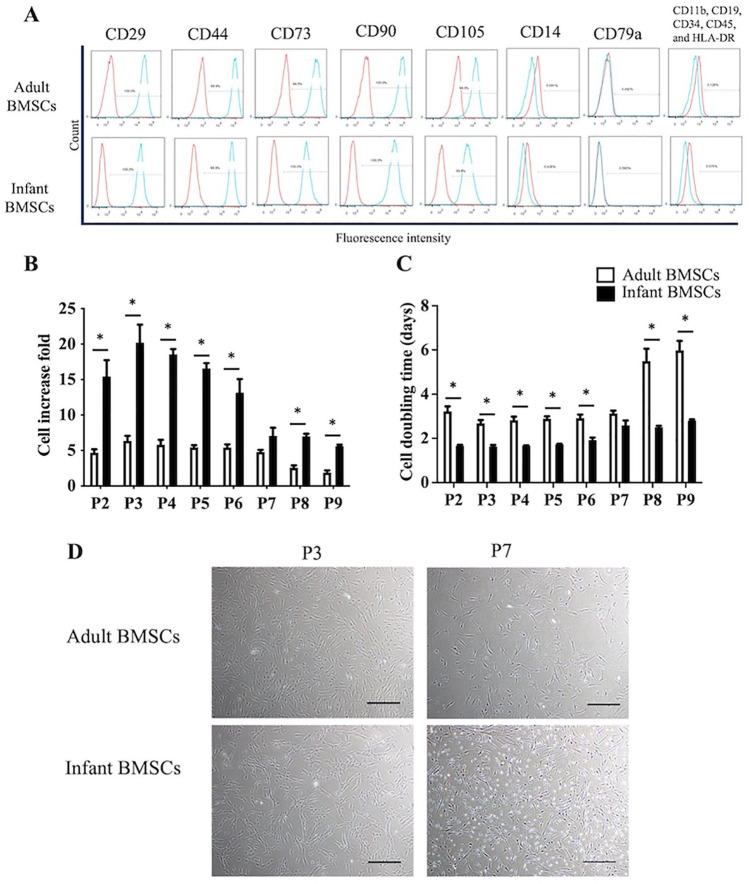
According to the criteria established by the Mesenchymal and Tissue Stem Cell Committee of the International Society for Cellular Therapy (ISCT), mesenchymal stem cells (MSCs) are required to adhere to plastic in culture conditions, display distinct cell surface markers, and demonstrate differentiation potential toward osteogenic, adipogenic, and chondrogenic lineages 26 . The flow cytometry analysis confirmed the cell-surface protein profiles of both adult and infant BMSCs. Both cell types exhibited positive expression for CD29, CD44, CD73, CD90, and CD105, while they were negative for CD11b, CD14, CD19, CD34, CD45, CD79a, and HLA-DR (as shown in Fig. 1A). The fold increase in cell number of infant BMSCs was significantly higher than that of adult BMSCs from passages 2–6 and passages 8–9 (Fig. 1B). In addition, the cell doubling time of infant BMSCs remained consistent from passage 2–9 and was significantly shorter than adult BMSCs at passages 2–6 and passages 8–9 (Fig. 1C). To visualize the cellular morphologies and densities, images were captured at early stage (passage 3) and late stage (passage 7) (Fig. 1D). These images further confirmed the cells’ ability to adhere to plastic substrates.
Figure 1.
Proliferation and replicative stress of adult and infant BMSCs. (A) Human adult and infant BMSCs were isolated and analyzed using antibodies against CD29, CD44, CD73, CD90, and CD105 showed positive expression. Antibodies against CD11b, CD19, CD34, CD45, CD14, CD79a, and (HLA-DR) showed negative expression. Flow cytometry analysis was performed using the FACSCanto II Cytometer System, and isotype control staining was used as a control. (B) The fold increase in cell number was calculated based on the consistent seeding density of 1 × 10⁵ cells per dish, with passages conducted every 7 days. (C) The cell doubling time was computed for both adult and infant BMSCs across passages 2 (P2) to 9 (P9). The data presented here represent the mean ± standard error of the mean (SEM) calculated from three experimental replicates within both the infant and adult groups. Statistical significance between adult and infant BMSCs was determined using the Mann–Whitney U test. Statistical significance is indicated by *P < 0.05. (D) Phase contrast microscopy images of adult and infant BMSCs at passages 3 and 7 were captured at 40× magnification. The scale bar represents 200 μm. BMSC: bone marrow–derived mesenchymal stem cell. HLA-DR: human leukocyte antigen-DR.
Senescence, Replicative Stress, and SOD Expression in the Adult and Infant BMSCs
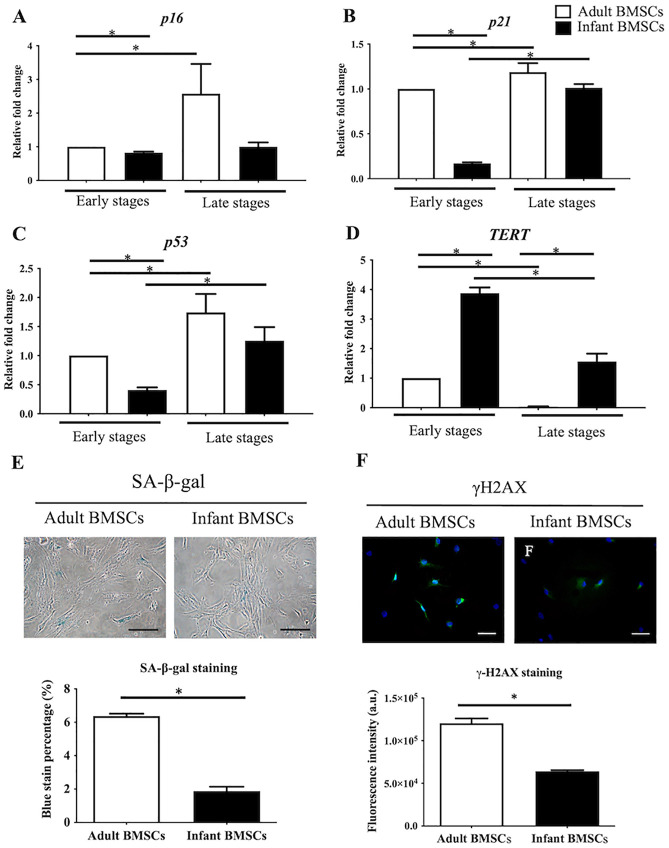
Compared with adult BMSCs, markers of senescence, such as cyclin-dependent kinase inhibitor 2A (p16, Fig. 2A), cyclin-dependent kinase inhibitor 1A (p21, Fig. 2B), and p53 (Fig. 2C) were significantly downregulated in infant BMSCs at early stages (passages 3–5). Conversely, the telomerase reverse transcriptase (TERT), responsible for maintaining genomic integrity, was significantly upregulated in infant BMSCs at both early and late stages (Fig. 2D). The expression levels of p16, p21, and p53 in adult BMSCs during late stages were all significantly higher than those observed during early stages. Moreover, the expressions of p21 and p53 in infant BMSCs during late stages were significantly elevated compared with their levels during early stages. Cellular senescence was evaluated using SA-β-gal assays, which resulted in the appearance of a blue color (Fig. 2E). The percentage of SA-β-gal positive adult BMSCs at passage 8 (6%) was significantly higher than that of infant BMSCs (2%) (Fig. 2E). Replicative stress was assessed by analyzing the presence of γH2AX, a marker of replicative stress, in the nuclei of adult and infant BMSCs at passage 7, which appeared as green fluorescence (Fig. 2F). The quantified fluorescent intensities of infant BMSCs were significantly lower than those of adult BMSCs (Fig. 2F). Although the proliferation rate of adult and infant BMSCs at passage 7 did not show a significant difference, these results suggested that adult BMSCs experienced higher levels of replicative stress.
Figure 2.
Senescence-related genes expression in adult and infant BMSC. The expression levels of (A) p16, (B) p21, (C) p53, and (D) TERT genes in adult and infant BMSCs at early passages (P3–P5) and late passages (P7–P9) were analyzed using RT-qPCR. The expression values were normalized to the reference gene GAPDH. The data are presented as mean ± SEM from three experimental replicates. Using the data from adult BMSCs in the early stage as the baseline, we calculated the relative fold change of adult BMSCs in the late stage and infant BMSCs in both early and late stages. The statistical comparisons of differences were individually analyzed using Mann–Whitney U analysis for the following groups: differences between adult and infant BMSCs in the early passage, differences between adult and infant BMSCs in the late passages, differences between adult BMSCs in the early and late stages, and statistical comparisons between infant BMSCs in the early and late stages. (E) SA-β-gal staining was performed using a Senescence Detection Kit (BioVision, USA) to detect cell senescence in adult and infant BMSCs at passage 8. SA-β-gal positive BMSCs exhibited a blue color upon staining. The cells were visualized using an Olympus BX43 microscope at 200× magnification, and the scale bar represents 150 μm. The percentage of SA-β-gal positive cells was quantified. (F) Immunofluorescence staining was performed on cells at passage 7 using an anti-γH2AX antibody (green) and DAPI (blue). The stained cells were visualized using an Olympus BX43 microscope at 400× magnification, and the scale bar represents 50 μm. The immunofluorescence intensity of γH2AX in the nuclei of adult and infant BMSCs was quantified using Image-Pro Plus v4.5.0.29, normalized to the cell numbers, and presented as fluorescence intensity (arbitrary unit, a.u.). The mean ± SEM calculated from three experimental replicates within both the infant and adult groups. BMSC: bone marrow–derived mesenchymal stem cell; GAPDH: glyceraldehyde-3-phosphate dehydrogenase; SEM: standard error of the mean; SA-β-gal: Senescence-associated β-galactosidase; DAPI: 4′,6-diamidino-2-phenylindole; RT-qPCR: real-time quantitative polymerase chain reaction; TERT: telomerase reverse transcriptase. Statistical significance is indicated by *P < 0.05; ***P < 0.001.
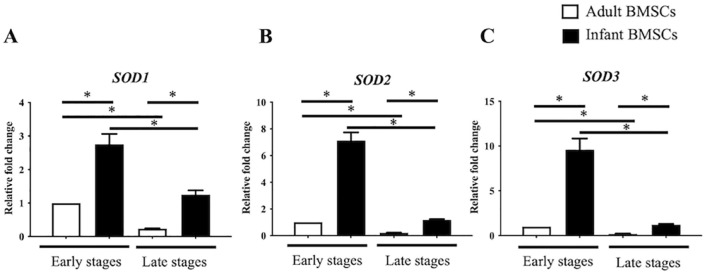
The expression of superoxide dismutase (SOD) genes, specifically SOD1, SOD2, and SOD3, was examined in both adult and infant BMSCs at early and late stages. The expression levels of all three SODs were significantly higher in infant BMSCs compared with adult BMSCs at early and late stages (Fig. 3A–C). Furthermore, in both infant and adult BMSCs, the expression levels of SOD1, SOD2, and SOD3 were significantly downregulated during the late stages when compared with the early stages (Fig. 3A–C). The gene expressions of glutathione synthesis gene (GCLM) and catalase (CAT), along with other antioxidation-related genes, were also detected (Fig. S1 in the supplemental material). However, the expression levels of both genes in infant BMSCs were notably lower than those in adult BMSCs during the early stages. Furthermore, CAT expression in infant BMSCs showed a significant decrease during the late stages. In comparison to the early stages, GCLM expression in adult BMSCs during the late stages exhibited a significant downregulation. In addition, GCLM and CAT gene expressions in infant BMSCs during the late stages were significantly lower than those in adult ones observed during the early stages.
Figure 3.
Superoxide dismutase (SODs) expressions in adult and infant BMSC. The expression levels of (A) SOD1, (B) SOD2, and (C) SOD3 genes in adult and infant BMSCs at early passages (P3–P5) and late passages (P7–P9) were analyzed using RT-qPCR. The expression values were normalized to the reference gene glyceraldehyde-3-phosphate dehydrogenase (GAPDH). The mean ± standard error of the mean (SEM) calculated from three experimental replicates within both the infant and adult groups. Using the data from adult BMSCs in the early stage as the baseline, the relative fold change of adult BMSCs in the late stage and infant BMSCs in both early and late stages were calculated. The statistical comparisons of differences were individually analyzed using Mann–Whitney U analysis for the following groups: differences between adult and infant BMSCs in the early passage, differences between adult and infant BMSCs in the late passages, differences between adult BMSCs in the early and late stages, and statistical comparisons between infant BMSCs in the early and late stages. BMSC: bone marrow–derived mesenchymal stem cell; RT-qPCR: real-time quantitative polymerase chain reaction. The significance levels are indicated by *P < 0.05.
Chondrogenic Differentiation in Adult and Infant BMSCs
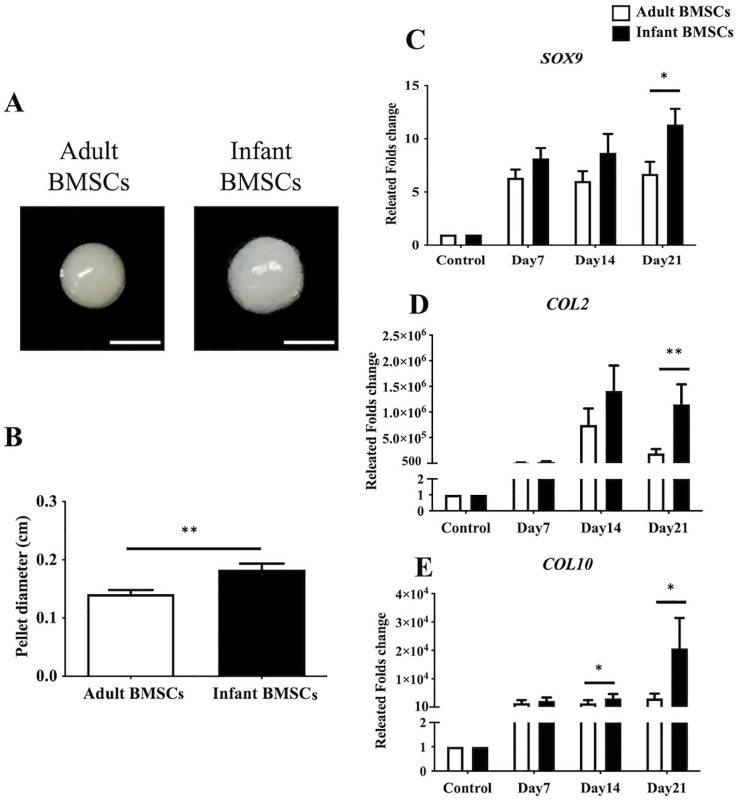
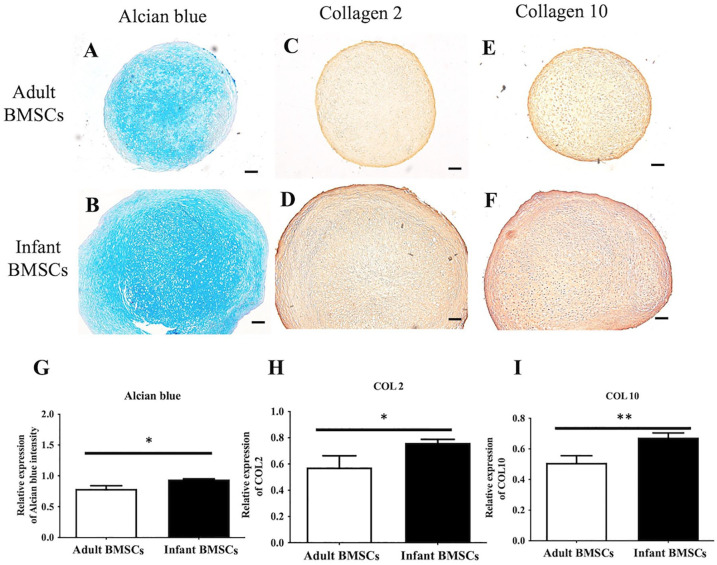
After 21 days of chondrogenic differentiation, infant BMSCs formed larger chondrogenic pellets compared with adult BMSCs (Fig. 4A). The mean diameter of the chondrogenic pellets derived from infant BMSCs was approximately 0.18 cm, which was significantly larger than the pellets derived from adult BMSCs, measuring about 0.15 cm (Fig. 4B). The expression levels of chondrogenic genes, including SRY-box transcription factor 9 (SOX9), COL2, and COL10, were monitored in the chondrogenic pellets derived from adult and infant BMSCs from days 7 to 21. The fold increase in the expression of SOX9, COL2, and COL10 in the chondrogenic pellets derived from infant BMSCs was significantly higher than those derived from adult BMSCs on day 21 (Fig. 4C–E). In addition, on day 14, the expression of COL2 in the chondrogenic pellets derived from infant BMSCs was also significantly higher than that in adult BMSC-derived pellets (Fig. 4E). To evaluate the content of glycosaminoglycans (GAGs), the 21-day differentiated chondrogenic pellets derived from adult and infant BMSCs were stained with Alcian blue (Fig. 5A, B). Immunohistochemistry staining was performed to assess the protein expressions of COL2 (Fig. 5C, D) and COL10 (Fig. 5E, F) in the pellets. The staining intensities were quantified using ImageJ for relative expression analysis. The Alcian blue staining intensities of the chondrogenic pellets derived from infant BMSCs were significantly higher than those derived from adult BMSCs (Fig. 5A, B). Moreover, both the relative expressions of COL2 and COL10 in the pellets derived from infant BMSCs were significantly higher than those in the pellets derived from adult BMSCs (Fig. 5H, I).
Figure 4.
Chondrogenic differentiation of adult and infant BMSC. (A) Chondrogenic pellets were generated from adult and infant BMSCs at passages 3–5, with 3 × 10⁵ cells per pellet, and cultured for 21 days. The image shows representative chondrogenic pellets, with a scale bar indicating 1 mm. (B) The diameters of the chondrogenic pellets were measured on day 21. (C) The gene expression of SOX9, (D) COL2, and (E) COL10 in the chondrogenic pellets differentiated from adult and infant BMSCs was analyzed by RT-qPCR from days 7 to 21. The expression values were normalized to the reference gene (GAPDH). The gene expression levels in undifferentiated cells were used as controls for comparison with adult and infant BMSC-differentiated chondrogenic cells, and the results were presented as relative fold changes. The mean ± standard error of the mean (SEM) calculated from three experimental replicates within both the infant and adult groups. Statistical significance between infant and adult BMSC-differentiated pellets was determined using the Mann–Whitney U test. BMSC: bone marrow–derived mesenchymal stem cell; GAPDH: glyceraldehyde-3-phosphate dehydrogenase RT-qPCR: real-time quantitative polymerase chain reaction. The significance levels are indicated by *P < 0.05; **P < 0.01.
Figure 5.
Immunohistochemistry staining of adult and infant BMSC-differentiated pellets. The chondrogenic pellets differentiated from adult and infant BMSCs for 21 days were sectioned and stained with Alcian blue (A and B). Immunostaining was performed to detect the protein expressions of collagen type 2 (COL2) (C and D) and collagen type 10 (COL10) (E and F) in the pellets. Representative images were captured at a magnification of ×40, and a scale bar indicating 2 mm was included. The densities of each staining were calculated and normalized to the background of the entire pellet sections (G–I). The mean ± standard error of the mean (SEM) calculated from three experimental replicates within both the infant and adult groups. Statistical significance between adult and infant BMSCs was determined using the Mann–Whitney U test. BMSC: bone marrow–derived mesenchymal stem cell. The significance levels are indicated by *P < 0.05; **P < 0.01.
Osteogenic Differentiation in Adult and Infant BMSCs
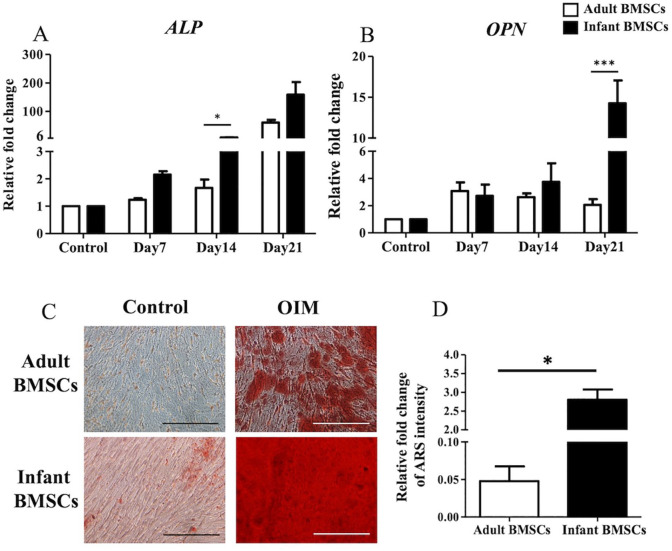
To assess the osteogenic differentiation of adult and infant BMSCs, the relative fold changes in the expression of osteocyte-related genes, including alkaline phosphatase (ALP) (Fig. 6A) and osteopontin (OPN) (Fig. 6B), were measured from days 7 to 21. The expression of ALP on day 14 and OPN on day 21 in the differentiated osteogenic cells derived from infant BMSCs was significantly higher than that in adult BMSCs (Fig. 6A, B). Calcium deposits in the osteogenic cells differentiated from adult and infant BMSCs on day 21 were stained with Alizarin Red S (ARS) (Fig. 6C). The ARS staining was dissolved in a buffer, and the absorbance at 550 nm was measured to calculate the relative fold change in staining intensity. The results indicated a significantly higher intensity of ARS staining in the osteogenic cells derived from infant BMSCs compared with those derived from adult BMSCs (Fig. 6D).
Figure 6.
Detection of osteocyte-related gene expressions of adult and infant BMSCs during differentiation using OIM. (A) The expression of ALP and (B) OPN genes in adult and infant BMSCs during osteogenic differentiation from day 7 to day 21 was detected using RT-qPCR. The expression values of each gene were normalized to the expression of GAPDH. Undifferentiated cells were used as a control to compare the gene expression of adult and infant BMSCs after differentiation, showing the relative fold change. (C) Undifferentiated adult and infant BMSCs were stained with ARS as a control. The 21-day osteogenic differentiated adult and infant BMSCs were confirmed using ARS staining and observed under a Nikon eclipse TS100 microscope (magnification × 200, scale bar = 25 μm). (D) The ARS stain was extracted from the stained cells, and the optical density (OD) was measured at a wavelength of 550 nm. The OD values of the differentiated cells were normalized to the control values set as 1 (not shown in the figure), demonstrating the relative fold changes in comparison to the control. The mean ± standard error of the mean (SEM) calculated from three experimental replicates within both the infant and adult groups. Statistical significance of comparing adult and infant BMSCs in osteogenic differentiation was determined using the Mann–Whitney U test. BMSC: bone marrow–derived mesenchymal stem cell; ALP: alkaline phosphatase; OPN: osteopontin; OIM: osteogenic induction medium; GAPDH: glyceraldehyde-3-phosphate dehydrogenase; ARS: Alizarin Red S; RT-qPCR: real-time quantitative polymerase chain reaction. The significance levels are indicated by *P < 0.05; ***P < 0.001.
Tenogenic Differentiation in Adult and Infant BMSCs
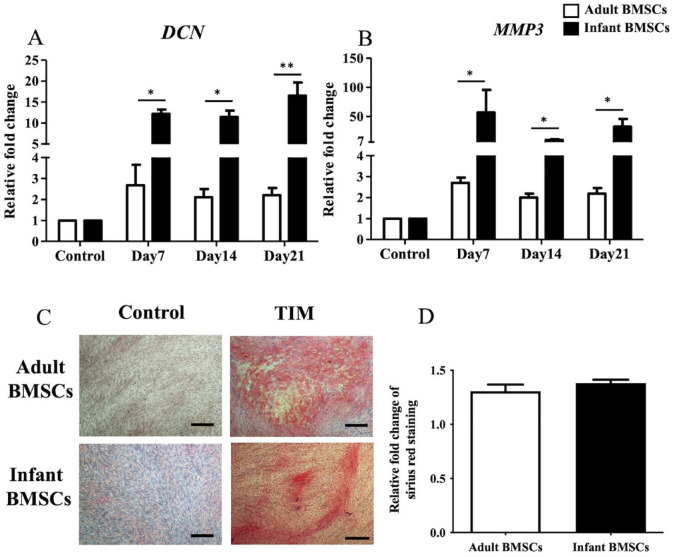
During tenogenic differentiation, the expression levels of matrix metallopeptidase 3 (MMP3) (Fig. 7A) and decorin (DCN) (Fig. 7B) genes in adult and infant BMSCs were monitored from days 7 to 21. The relative fold changes in gene expression in the tenogenic cells differentiated from infant BMSCs were significantly higher than those in adult BMSCs throughout the entire differentiation period (days 7–21) (Fig. 7A, B). To visualize the presence of collagens in the 21-day differentiated tenogenic cells derived from adult and infant BMSCs, Picro-Sirius Red staining was performed, and collagen fibers appeared in red (Fig. 7C). The Picro-Sirius Red staining was dissolved using a buffer, and the absorbance at 550 nm was measured using an ELISA reader. The observed fold changes in collagen content of the differentiated cells from infant BMSCs were comparable with those derived from adult BMSCs (Fig. 7D).
Figure 7.
Detection of tendon-related gene expressions of adult and infant BMSCs during differentiation using TIM. (A) The expression of DCN and (B) MMP3 genes in adult and infant BMSCs during tenogenic differentiation from days 7 to 21 was detected using RT-qPCR. The expression values of each gene were normalized to the expression of GAPDH. Undifferentiated cells were used as a control to compare the gene expression of adult and infant BMSCs after differentiation, showing the relative fold change. (C) Undifferentiated adult and infant BMSCs were stained with Picro-Sirius Red as a control. The 21-day tenogenic differentiated adult and infant BMSCs were confirmed using Picro-Sirius Red staining and observed under a Nikon eclipse TS100 microscope (magnification × 40, scale bar = 50 μm). (D) The Picro-Sirius Red stain was extracted from the stained cells, and the optical density (OD) was measured at a wavelength of 550 nm. Subsequently, the OD values of the differentiated cells were normalized against the control values set as 1 (not shown in the figure), presenting the relative fold changes compared with the control. The mean ± standard error of the mean (SEM) calculated from three experimental replicates within both the infant and adult groups. Statistical significance in the comparison of tenogenic differentiation between adult and infant BMSCs was determined using the Mann–Whitney U test. BMSC: bone marrow–derived mesenchymal stem cell; DCN: decorin; MMP3: matrix metallopeptidase 3; TIM: tenogenic induction medium; GAPDH: glyceraldehyde-3-phosphate dehydrogenase; RT-qPCR: real-time quantitative polymerase chain reaction. Significance levels are indicated by *P < 0.05; **P < 0.01.
Adipogenic Differentiation in Adult and Infant BMSCs
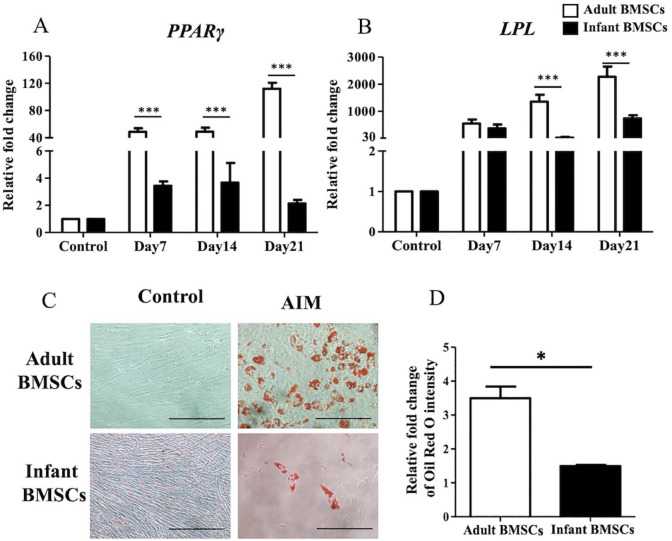
To assess adipogenic differentiation, the expression of adipogenic genes, including peroxisome proliferator-activated receptor γ (PPARγ) (Fig. 8A) and lipoprotein lipase (LPL) (Fig. 8B), was examined from days 7 to 21. The fold changes in PPARγ expression in the cells differentiated from adult BMSCs were significantly higher than those in infant BMSCs throughout the differentiation period (days 7–21). Similarly, the expression of LPL at days 14 and 21 in the differentiated cells derived from adult BMSCs was significantly higher than that in cells derived from infant BMSCs. To visualize the accumulation of lipids, Oil Red O staining was performed on both differentiated and undifferentiated cells from adult and infant BMSCs on day 21 (Fig. 8C). The relative fold change in the intensity of Oil Red O staining in the adipogenic cells derived from adult BMSCs on day 21 showed a significant increase compared with those in cells derived from infant BMSCs (Fig. 8D).
Figure 8.
Detection of adipose-related gene expressions of adult and infant BMSCs during differentiation using AIM. (A) The expression of PPARγ and (B) LPL genes in adult and infant BMSCs after 7–21 days of factor-induced adipogenic differentiation was detected using RT-qPCR. The expression values of each gene were normalized to the expression of GAPDH. Undifferentiated cells were used as a control to compare the gene expression of adult and infant BMSCs after differentiation, showing the relative fold change. (C) Undifferentiated adult and infant BMSCs were stained with Oil Red O as a control. The presence of lipid droplets in adult and infant BMSCs after 21 days of adipogenic differentiation was confirmed using Oil Red O staining and observed under a Nikon Eclipse TS100 microscope. (Magnification × 200, scale bar = 25 μm). (D) The Oil Red O stain was extracted, and the optical density (OD) was measured at a wavelength of 510 nm. Subsequently, the OD values of the differentiated cells were adjusted against the OD values of undifferentiated cells, which were set as 1 (not shown in the figure), illustrating the relative fold changes compared with the control. The mean ± standard error of the mean (SEM) calculated from three experimental replicates within both the infant and adult groups. Statistical significance of comparing adult and infant BMSCs in adipogenic differentiation was determined using the Mann–Whitney U test. BMSC: bone marrow–derived mesenchymal stem cell; PPARγ: peroxisome proliferator-activated receptor-γ; LPL: lipoprotein lipase; AIM: adipogenic induction medium; GAPDH: glyceraldehyde-3-phosphate dehydrogenase; RT-qPCR: real-time quantitative polymerase chain reaction. The significance levels are indicated by *P < 0.05; ***P < 0.001.
Hepatogenic Differentiation in Adult and Infant BMSCs
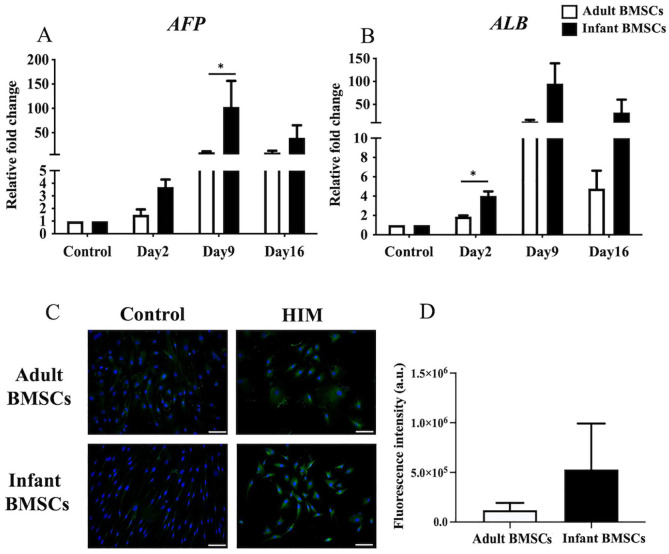
The expression fold changes of alpha-fetoprotein (AFP) (Fig. 9A) and albumin (ALB) (Fig. 9B), which serve as hepatogenic markers, were monitored in cells differentiated from adult and infant BMSCs from days 2 to 16. The AFP expression on day 9 and ALB expression on day 2 in the differentiated cells derived from infant BMSCs were significantly higher than those derived from adult BMSCs. To visualize the expression of the albumin protein, immunofluorescence staining was performed (Fig. 9C). The quantified expression levels in the hepatogenic cells differentiated from infant BMSCs were higher than those in adult BMSCs, although the difference was not statistically significant (Fig. 9D).
Figure 9.
Detection of hepatocyte-related gene expressions of adult and infant BMSCs during differentiation using HIM. (A) The expression of AFP and (B) matrix ALB genes in adult and infant BMSCs after 13-15 days of factor-induced hepatogenic differentiation was detected using RT-qPCR. The expression values of each gene were normalized to the expression of GAPDH. Undifferentiated cells were used as a control to compare the gene expression of adult and infant BMSCs after differentiation, showing the relative fold change. (C) The presence of albumin protein in adult and infant BMSCs was detected using immunofluorescence staining, represented by green fluorescence, and evaluated using an Olympus BX43 microscope. Nuclear DNA stained by DAPI is shown in blue fluorescence. (Magnification × 400, scale bar = 100 μm). (D) Immunofluorescence intensity was quantified using ImageJ. The mean ± standard error of the mean (SEM) calculated from three experimental replicates within both the infant and adult groups. Undifferentiated adult and infant BMSCs were stained with DAPI and antibody, establishing the control set at 1 (not shown in the figure), demonstrating the relative fold changes of differentiated cells compared with the control. Statistical significance of comparing adult and infant BMSCs in hepatogenic differentiation was determined using the Mann–Whitney U test. BMSC: bone marrow–derived mesenchymal stem cell; AFP: alpha-fetoprotein; ALB: albumin; HIM: hepatogenic induction medium; GAPDH: glyceraldehyde-3-phosphate dehydrogenase; DAPI: 4′,6-diamidino-2-phenylindole; RT-qPCR: real-time quantitative polymerase chain reaction. Significance levels are indicated by *P < 0.05.
Neurogenic Differentiation in Adult and Infant BMSCs
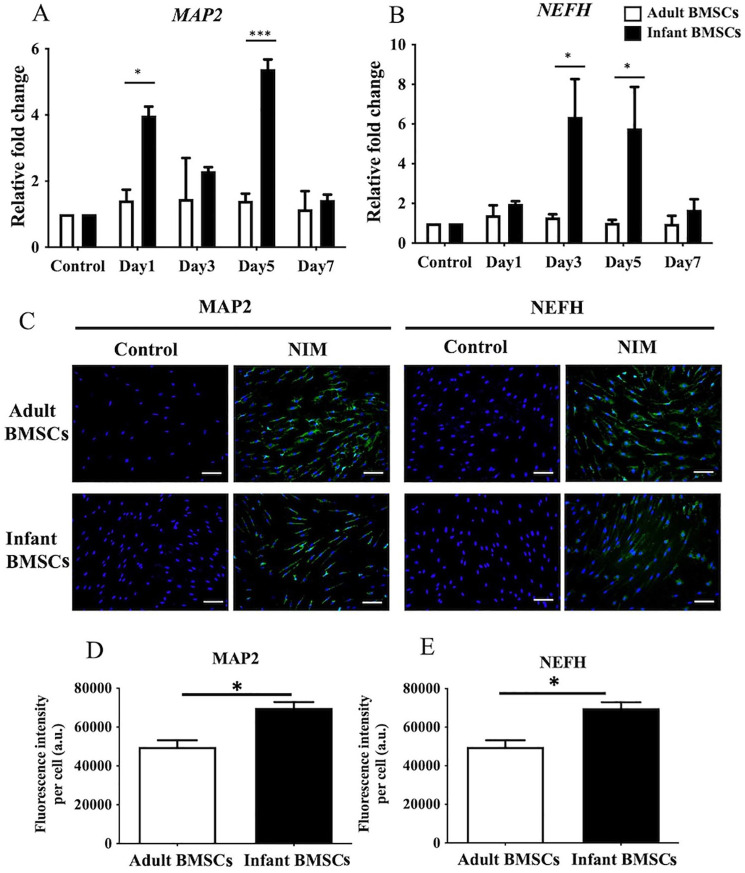
To confirm neurogenic differentiation, the expression of MAP2 and NEFH genes was examined in adult and infant BMSCs from days 7 to 21. The fold changes in MAP2 expression in the differentiated cells derived from infant BMSCs were significantly higher on days 1 and 5 than those from adult BMSCs (Fig. 10A). Similarly, the fold changes in NEFH expression in the neurogenic cells differentiated from infant BMSCs were significantly higher on days 3 and 5 than those from adult BMSCs (Fig. 10B). To visualize the protein expression levels of MAP2 and NEFH, immunofluorescence staining was performed (Fig. 10C). The intensities of immunofluorescence staining for MAP2 and NEFH in the differentiated cells were quantified and normalized with the cell numbers. The intensities of both proteins in the neurogenic cells derived from infant BMSCs were significantly higher than those derived from adult BMSCs (Fig. 10D, E).
Figure 10.
Detection of neuron-related gene expressions of adult and infant BMSC during differentiation using NIM. (A) The expression of MAP2 and (B) NEFH genes in adult and infant BMSCs after 1-7 days of factor-induced neurogenic differentiation was detected using RT-qPCR. The expression values of each gene were normalized to the expression of GAPDH. Undifferentiated cells served as a control to compare the gene expression of adult and infant BMSCs after differentiation, showing the relative fold change. (C) Undifferentiated adult and infant BMSCs were stained with DAPI and antibodies as a control. The presence of MAP2 and NEFH proteins in adult and infant BMSCs after neurogenic differentiation was detected using immunofluorescence staining, which appeared as green fluorescence, and observed under an Olympus BX43 microscope. Nuclear DNA stained with DAPI was shown in blue fluorescence. (Magnification × 200, scale bar = 100 μm). (D and E) Immunofluorescence intensity was quantified using Image-Pro Plus v4.5.0.29. The mean ± standard error of the mean (SEM) calculated from three experimental replicates within both the infant and adult groups. The undifferentiated adult and infant BMSCs were designated as the control set at 1 (not shown in the figure), illustrating the relative fold changes of differentiated cells in comparison to the control. Statistical significance of comparing adult and infant BMSC-differentiated cells was determined using the Mann–Whitney U test. BMSC: bone marrow–derived mesenchymal stem cell; MAP2: microtubule-associated protein 2; NEFH: neurofilament heavy polypeptide; NIM: neurogenic induction medium; GAPDH: glyceraldehyde-3-phosphate dehydrogenase; DAPI: 4′,6-diamidino-2-phenylindole; RT-qPCR: real-time quantitative polymerase chain reaction. The significance levels are indicated by *P < 0.05; ***P < 0.001.
Discussion
We conducted a study comparing the properties of infant adipose-derived mesenchymal stem cells (ADSCs) and adult ADSCs, and found that the infant ADSCs exhibited better proliferation, anti-aging, antioxidation, and differentiation potential 27 . In this study, we observed similar trends in infant BMSCs compared with adult BMSCs. The infant BMSCs demonstrated higher proliferation, anti-senescence, and antioxidation capabilities. They also exhibited enhanced potential for chondrogenic, osteogenic, tenogenic, and hepatogenic differentiation, whereas the adult BMSCs favored adipogenic differentiation.
Cellular senescence and stem cell exhaustion contribute to the decline in stem cell regenerative potential and proliferation 28 . Senescent BMSCs exhibit organelle stress, shortened telomeres, impaired DNA and protein, and increased reactive oxygen species (ROS) levels. Replicative senescence and accumulation of γH2AX foci are observed with long-term culture 29 . Our results showed that the expression levels of senescence-related genes, including p16, p21, and p53, were lower in infant BMSCs at both early and late passages compared with adult BMSCs. In addition, the expression of γH2AX, a marker of genomic instability, and the expression of SA-β-gal, a marker of cellular senescence were lower in infant BMSCs compared with adult BMSCs after seven passages. These findings suggest that the stemness of infant BMSCs may be better preserved, and replicative senescence may be reduced in late passages. The age of the donor appears to influence the stemness of BMSCs. Infant BMSCs derived from abandoned phalanges of polydactyly children could be successfully cultured and expanded in vitro while maintaining their potential. These favorable results regarding proliferation and aging reduction enhance the potential application of infant BMSCs in tissue engineering.
Oxidative stress, caused by increased ROS generation and decreased antioxidant molecules, leads to cellular aging due to the accumulation of oxidative stress-induced DNA damage and cell cycle arrest 30 . ROS plays a significant role in stem cell senescence 31 . Enhancing the expression of antioxidant enzymes or using antioxidant agents, such as nicotinamide, to neutralize ROS levels can enhance stem cell proliferation and differentiation potential 32 . In our previous study, infant ADSCs showed elevated expression of SOD genes (SOD1, SOD2, and SOD3) 27 . Similarly, infant BMSCs also exhibited higher expression of SODs, indicating that MSCs derived from young donors possess higher antioxidative abilities. We also examined other genes related to antioxidation, such as GCLM and CAT. Our findings indicated that the expression of both genes was elevated in adult BMSCs at both early and late stages. However, it appears that infant BMSCs may not rely on the activity of these two genes to combat oxidative stress, and these antioxidation-related genes may not be involved in the antioxidative ability of infant BMSCs.
Regarding differentiation potential, infant BMSCs showed a higher propensity for chondrogenic, osteogenic, neurogenic, tenogenic, and even hepatogenic differentiation compared with adult BMSCs. However, their potential for adipogenic differentiation was significantly lower. Previous studies have reported an inverse correlation between osteogenic and adipogenic lineage differentiations 33 . Enhanced osteogenic differentiation often leads to reduced adipogenic differentiation and vice versa. Furthermore, ROS have been shown to inhibit osteogenic differentiation and induce adipogenic differentiation in BMSCs 34 , which may explain the higher osteogenic potential but lower adipogenic potential observed in infant BMSCs with increased SOD expression.
In this study, we conducted an analysis of the proliferation, senescence, and differentiation properties of adult and infant BMSCs. Our findings provide valuable insights into the characteristics of these cell populations. However, further investigations are required to elucidate the underlying mechanisms involved. In addition, future studies should include in vivo experiments to validate and expand upon our findings. Furthermore, it is important to note that the common source of BMSCs in adults is typically the bone marrow from the iliac crest or the manubrium sternum. In this study, adult BMSCs were collected from excised carpal bones. This difference in the source of BMSCs may represent a limitation that could potentially restrict the applicability of our findings. On the other hand, the BMSCs were extracted from the excised carpal without visible signs of inflammation. Nonetheless, the potential impact of basal joint arthritis, leading to chronic localized inflammation, could be considered a limitation of this study. It is also worth mentioning that although we previously conducted a similar study comparing adult and infant ADSCs, it is important to recognize that there are fundamental differences between BMSCs and ADSCs. Therefore, the results and conclusions from the previous study may not directly apply to the current investigation.
Collecting BMSCs can be challenging and potentially painful for patients. In this study, we overcame this challenge by extracting BMSCs from discarded phalanges and carpal bones, which are classified as medical waste. Both adult and infant BMSCs showed a remarkable capacity for expansion in vitro. Notably, infant BMSCs obtained from excised polydactyly thumbs exhibited preserved high proliferation ability and stemness. These findings have important implications for the application of allogeneic BMSC transplantation in tissue engineering, providing a potential source of abundant and functional stem cells.
Supplemental Material
Supplemental material, sj-pptx-1-cll-10.1177_09636897231221878 for Proliferation and Differentiation Potential of Bone Marrow–Derived Mesenchymal Stem Cells From Children With Polydactyly and Adults With Basal Joint Arthritis by Shih-Han Yeh, Jin-Huei Yu, Po-Hsin Chou, Szu-Hsien Wu, Yu-Ting Liao, Yi-Chao Huang, Tung-Ming Chen and Jung-Pan Wang in Cell Transplantation
Acknowledgments
The authors thank the work that was assisted in part by the Division of the Experimental Surgery of the Department of Surgery, Taipei Veterans General Hospital.
Footnotes
Availability of Supporting Data: All data generated or analyzed during this study had been included in this published article.
Consent for Publication: Written informed consent was obtained from the patient for publication of this case report and any accompanying images. A copy of the written consent is available for review by the Editor-in-Chief of this journal.
Ethical Approval and Consent to Participate: The collection of human BMSCs was approved by the Institutional Review Board (IRB) of the Taipei Veterans General Hospital, and the protocol titles of human ethics are “Comparison and investigation of the chondrogenic differentiational potential between adult and infant bone marrow stem cells” (Approval number: 2019-08-004A) on December 17, 2019, and “Comparison and investigation of the chondrogenic differentiational potential and the role of superoxide dismutases (SODs) between adult and infant bone marrow mesenchymal stem cells” (Approval number: 2020-06-007B) on July 23, 2020, respectively. Informed consent was obtained from participants (or their parent or legal guardian in the case of children under 16) included in the study.
Statement of Human and Animal Rights: This article does not contain any studies with human or animal subjects.
Statement of Informed Consent: There are no human subjects in this article and informed consent is not applicable.
The author(s) declared no potential conflicts of interest with respect to the research, authorship, and/or publication of this article.
Funding: The author(s) disclosed receipt of the following financial support for the research, authorship, and/or publication of this article: This study was supported in part by grants from the Taipei Veterans General Hospital (V111C-231), the Ministry of Science and Technology (MOST 111-2314-B-075-057-MY3), the Taoyuan General Hospital, Ministry of Health and Welfare (PTH111068), and the Taipei City Hospital-Zhong Xiao branch (TPCH-111-49). All the funding bodies had not involved in study design, including collection, management, analysis, interpretation of data, and the decision of submission.
ORCID iD: Jung-Pan Wang  https://orcid.org/0000-0002-8427-9963
Supplemental Material: Supplemental material for this article is available online.
References
- 1. Huang TF, Yew TL, Chiang ER, Ma HL, Hsu CY, Hsu SH, Hsu YT, Hung SC. Mesenchymal stem cells from a hypoxic culture improve and engraft Achilles tendon repair. Am J Sports Med. 2013;41(5):1117–25. [DOI] [PubMed] [Google Scholar]
- 2. Tuan RS, Boland G, Tuli R. Adult mesenchymal stem cells and cell-based tissue engineering. Arthritis Res Ther. 2003;5(1):32–45. [DOI] [PMC free article] [PubMed] [Google Scholar]
- 3. Squillaro T, Peluso G, Galderisi U. Clinical trials with mesenchymal stem cells: an update. Cell Transplant. 2016;25(5):829–48. [DOI] [PubMed] [Google Scholar]
- 4. Seebach C, Henrich D, Meier S, Nau C, Bonig H, Marzi I. Safety and feasibility of cell-based therapy of autologous bone marrow-derived mononuclear cells in plate-stabilized proximal humeral fractures in humans. J Translat Med. 2016;14(1):1–11. [DOI] [PMC free article] [PubMed] [Google Scholar]
- 5. Kuroda S, Shichinohe H, Houkin K, Iwasaki Y. Autologous bone marrow stromal cell transplantation for central nervous system disorders—recent progress and perspective for clinical application. J Stem Cells Regen Med. 2011;7(1):2–13. [DOI] [PMC free article] [PubMed] [Google Scholar]
- 6. Herzog EL, Chai L, Krause DS. Plasticity of marrow-derived stem cells. Blood. 2003;102(10):3483–93. [DOI] [PubMed] [Google Scholar]
- 7. Al-Azab M, Safi M, Idiiatullina E, Al-Shaebi F, Zaky MY. Aging of mesenchymal stem cell: machinery, markers, and strategies of fighting. Cell Mol Biol Lett. 2022;27(1):69. [DOI] [PMC free article] [PubMed] [Google Scholar]
- 8. Zhou S, Greenberger JS, Epperly MW, Goff JP, Adler C, Leboff MS, Glowacki J. Age-related intrinsic changes in human bone-marrow-derived mesenchymal stem cells and their differentiation to osteoblasts. Aging Cell. 2008;7(3):335–43. [DOI] [PMC free article] [PubMed] [Google Scholar]
- 9. Sethe S, Scutt A, Stolzing A. Aging of mesenchymal stem cells. Ageing Res Rev. 2006;5(1):91–116. [DOI] [PubMed] [Google Scholar]
- 10. Murphy JM, Dixon K, Beck S, Fabian D, Feldman A, Barry F. Reduced chondrogenic and adipogenic activity of mesenchymal stem cells from patients with advanced osteoarthritis. Arthritis Rheum. 2002;46(3):704–13. [DOI] [PubMed] [Google Scholar]
- 11. Quarto R, Thomas D, Liang CT. Bone progenitor cell deficits and the age-associated decline in bone repair capacity. Calcif Tissue Int. 1995;56(2):123–29. [DOI] [PubMed] [Google Scholar]
- 12. Oreffo RO, Bennett A, Carr AJ, Triffitt JT. Patients with primary osteoarthritis show no change with ageing in the number of osteogenic precursors. Scand J Rheumatol. 1998;27(6):415–24. [DOI] [PubMed] [Google Scholar]
- 13. Leskela HV, Risteli J, Niskanen S, Koivunen J, Ivaska KK, Lehenkari P. Osteoblast recruitment from stem cells does not decrease by age at late adulthood. Biochem Biophys Res Commun. 2003;311(4):1008–13. [DOI] [PubMed] [Google Scholar]
- 14. De Bari C, Dell’Accio F, Luyten FP. Human periosteum-derived cells maintain phenotypic stability and chondrogenic potential throughout expansion regardless of donor age. Arthritis Rheum. 2001;44(1):85–95. [DOI] [PubMed] [Google Scholar]
- 15. Bergman RJ, Gazit D, Kahn AJ, Gruber H, McDougall S, Hahn TJ. Age-related changes in osteogenic stem cells in mice. J Bone Miner Res. 1996;11(5):568–77. [DOI] [PubMed] [Google Scholar]
- 16. Beane OS, Fonseca VC, Cooper LL, Koren G, Darling EM. Impact of aging on the regenerative properties of bone marrow-, muscle-, and adipose-derived mesenchymal stem/stromal cells. PLoS ONE. 2014;9(12):e115963. [DOI] [PMC free article] [PubMed] [Google Scholar]
- 17. Scharstuhl A, Schewe B, Benz K, Gaissmaier C, Buhring HJ, Stoop R. Chondrogenic potential of human adult mesenchymal stem cells is independent of age or osteoarthritis etiology. Stem Cells. 2007;25(12):3244–51. [DOI] [PubMed] [Google Scholar]
- 18. Chen TL. Inhibition of growth and differentiation of osteoprogenitors in mouse bone marrow stromal cell cultures by increased donor age and glucocorticoid treatment. Bone. 2004;35(1):83–95. [DOI] [PubMed] [Google Scholar]
- 19. Chen LJ, Chiou JY, Huang JY, Su PH, Chen JY. Birth defects in Taiwan: a 10-year nationwide population-based, cohort study. J Formos Med Assoc. 2020;119(1, pt 3):553–59. [DOI] [PubMed] [Google Scholar]
- 20. Wang JP, Liao YT, Wu SH, Huang HK, Chou PH, Chiang ER. Adipose derived mesenchymal stem cells from a hypoxic culture reduce cartilage damage. Stem Cell Rev Rep. 2021;17(5):1796–809. [DOI] [PubMed] [Google Scholar]
- 21. Hung SC, Chen NJ, Hsieh SL, Li H, Ma HL, Lo WH. Isolation and characterization of size-sieved stem cells from human bone marrow. Stem Cells. 2002;20(3):249–58. [DOI] [PubMed] [Google Scholar]
- 22. Stanco D, Caprara C, Ciardelli G, Mariotta L, Gola M, Minonzio G, Soldati G. Tenogenic differentiation protocol in xenogenic-free media enhances tendon-related marker expression in ASCs. PLoS ONE. 2019;14(2):e0212192. [DOI] [PMC free article] [PubMed] [Google Scholar]
- 23. Sweat F, Puchtler H, Rosenthal SI. Sirius red F3ba as a stain for connective tissue. Arch Pathol. 1964;78:69–72. [PubMed] [Google Scholar]
- 24. Wang JP, Hui YJ, Wang ST, Yu HH, Huang YC, Chiang ER, Liu CL, Chen TH, Hung SC. Recapitulation of fibromatosis nodule by multipotential stem cells in immunodeficient mice. PLoS ONE. 2011;6(8):e24050. [DOI] [PMC free article] [PubMed] [Google Scholar]
- 25. Hung SC, Cheng H, Pan CY, Tsai MJ, Kao LS, Ma HL. In vitro differentiation of size-sieved stem cells into electrically active neural cells. Stem Cells. 2002;20(6):522–29. [DOI] [PubMed] [Google Scholar]
- 26. Dominici M, Le Blanc K, Mueller I, Slaper-Cortenbach I, Marini F, Krause D, Deans R, Keating A, Prockop Dj, Horwitz E. Minimal criteria for defining multipotent mesenchymal stromal cells. The international society for cellular therapy position statement. Cytotherapy. 2006;8(4):315–17. [DOI] [PubMed] [Google Scholar]
- 27. Wu SH, Yu JH, Liao YT, Liu KH, Chiang ER, Chang MC, Wang JP. Comparison of the infant and adult adipose-derived mesenchymal stem cells in proliferation, senescence, anti-oxidative ability and differentiation potential. Tissue Eng Regen Med. 2022;19(3):589–601. [DOI] [PMC free article] [PubMed] [Google Scholar]
- 28. López-Otín C, Blasco MA, Partridge L, Serrano M, Kroemer G. The hallmarks of aging. Cell. 2013;153(6):1194–217. [DOI] [PMC free article] [PubMed] [Google Scholar]
- 29. Karagiannidou A, Varela I, Giannikou K, Tzetis M, Spyropoulos A, Paterakis G, Petrakou E, Theodosaki M, Goussetis E, Kanavakis E. Mesenchymal derivatives of genetically unstable human embryonic stem cells are maintained unstable but undergo senescence in culture as do bone marrow-derived mesenchymal stem cells. Cell Reprogram. 2014;16(1):1–8. [DOI] [PubMed] [Google Scholar]
- 30. Di Micco R, Krizhanovsky V, Baker D, d’Adda di Fagagna F. Cellular senescence in ageing: from mechanisms to therapeutic opportunities. Nat Rev Mol Cell Biol. 2021;22(2):75–95. [DOI] [PMC free article] [PubMed] [Google Scholar]
- 31. Weng Z, Wang Y, Ouchi T, Liu H, Qiao X, Wu C, Zhao Z, Li L, Li B. Mesenchymal stem/stromal cell senescence: hallmarks, mechanisms, and combating strategies. Stem Cells Transl Med. 2022;11(4):356–71. [DOI] [PMC free article] [PubMed] [Google Scholar]
- 32. Ok JS, Song SB, Hwang ES. Enhancement of replication and differentiation potential of human bone marrow stem cells by nicotinamide treatment. Int J Stem Cells. 2018;11(1):13–25. [DOI] [PMC free article] [PubMed] [Google Scholar]
- 33. Beresford JN, Bennett JH, Devlin C, Leboy PS, Owen ME. Evidence for an inverse relationship between the differentiation of adipocytic and osteogenic cells in rat marrow stromal cell cultures. J Cell Sci. 1992;102(pt 2):341–51. [DOI] [PubMed] [Google Scholar]
- 34. Atashi F, Modarressi A, Pepper MS. The role of reactive oxygen species in mesenchymal stem cell adipogenic and osteogenic differentiation: a review. Stem Cells Dev. 2015;24(10):1150–63. [DOI] [PMC free article] [PubMed] [Google Scholar]
Associated Data
This section collects any data citations, data availability statements, or supplementary materials included in this article.
Supplementary Materials
Supplemental material, sj-pptx-1-cll-10.1177_09636897231221878 for Proliferation and Differentiation Potential of Bone Marrow–Derived Mesenchymal Stem Cells From Children With Polydactyly and Adults With Basal Joint Arthritis by Shih-Han Yeh, Jin-Huei Yu, Po-Hsin Chou, Szu-Hsien Wu, Yu-Ting Liao, Yi-Chao Huang, Tung-Ming Chen and Jung-Pan Wang in Cell Transplantation


