

Abstract
Recently, a class of heterobifunctional small molecules called ribonuclease targeting chimeras (RiboTACs) have been developed that selectively induce degradation of RNAs in cells. These molecules function by recruiting latent ribonuclease (RNase L), an endoribonuclease involved in the innate immune response, to targeted RNA structures. The RiboTACs must activate RNase L in proximity to the RNA, resulting in cleavage of the RNA and downstream degradation. To develop and validate a new RiboTAC, several steps must be taken. First, small molecule activators that bind to RNase L must be identified. Next, since RNase L is only catalytically active upon ligand-induced homodimerization, the capability of identified small molecules to activate RNase L must be assessed. RNase L-activating small molecules should then be coupled to validated RNA-binding small molecules to construct the active RiboTAC. This RiboTAC can finally be assessed in cells for RNase L-dependent degradation of target RNAs. This chapter will provide several methods that are helpful to develop and assess RiboTACs throughout this process, including recombinant RNase L expression, methods to assess RNase L engagement in vitro such as saturation transfer difference nuclear magnetic resonance (STD NMR), an in vitro assay to assess activation of RNase L, and cellular methods to demonstrate RNase L-dependent cleavage.
Keywords: RNA, RNase, Ribonuclease targeting chimeras (RiboTACs), Induced proximity, Targeted degradation
1. Introduction
Ribonuclease targeting chimeras (RiboTACs) are a class of small molecules that selectively induce degradation of target RNAs in cells. These RiboTACs comprise two main components: an RNA-binding domain, which recognizes specific RNA structures, and a ribonuclease-recruiting domain, which brings effector ribonucleases in proximity to the target RNA. This proposed mechanism is outlined in Fig. 1A.
Fig. 1.
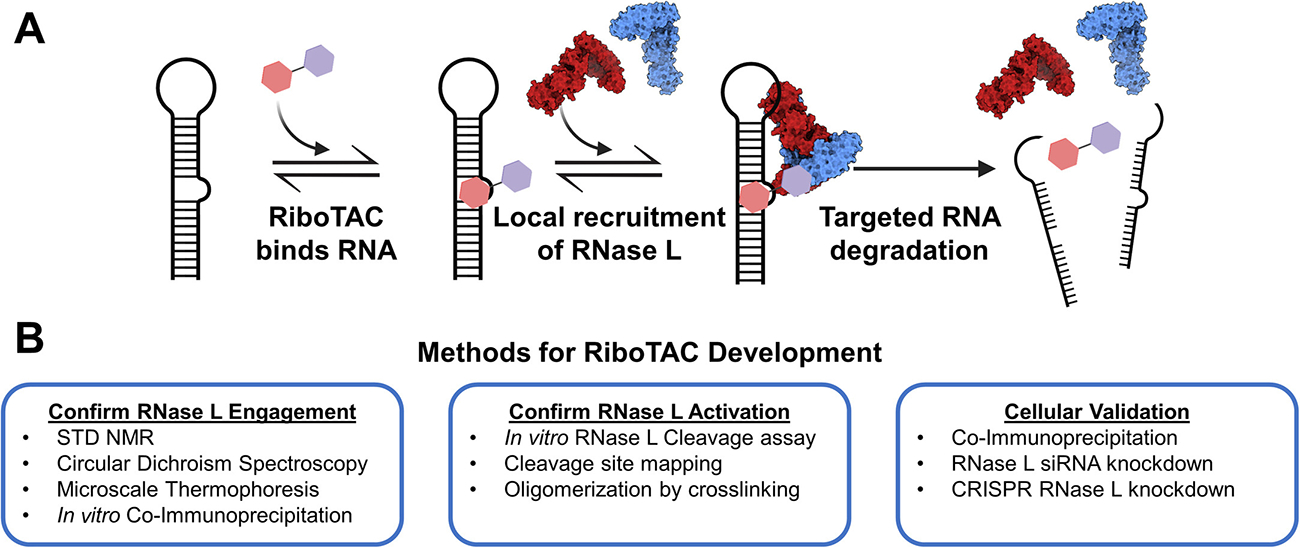
(A) Proposed mechanism of targeted RNA degradation via RiboTACs. RiboTACs contain an RNA-binding and an RNase-recruiting moieties, enabling activation of RNase L in proximity to target RNAs, resulting in the RNA’s subsequent degradation. (B) Methods detailed in this chapter to discover and validate RNase L-recruiting RiboTACs. Created with BioRender.com.
Currently, RiboTACs utilize endogenous latent ribonuclease (RNase L) as the recruited effector protein. RNase L is an endonuclease that plays an important role in the cellular innate immune response. Double-stranded RNA, which is commonly produced during viral infection, activates 2′–5′-oligoadenylate synthase (OAS) to produce 2′–5′-oligoadenylate (2′–5′A) (Rebouillat & Hovanessian, 1999). The only known cellular target of 2′–5′A is RNase L, which transforms from an inactive monomer to an active dimer upon binding of 2′–5′A (Dong & Silverman, 1995). The activated RNase L dimer subsequently cleaves viral and host single-stranded RNA (ssRNA), showing sequence-selective cleavage between the +1 and +2 nucleotides following an unpaired uridine (Floyd-Smith et al., 1981, Han et al., 2014, Wreschner et al., 1981).
To date, all RiboTACs have utilized RNase L as the recruited nuclease due to several convenient properties of the protein. First, RNase L is present in low quantities in almost every tissue type (Fredrik, Nielsen, Zwahlen, Johansson, & Persson, 2015). This enables RiboTACs to be applicable towards a broad range of cell types, increasing the disease-relevant RNA structures that are targetable. Second, RNase L is an endonuclease, meaning the enzyme can cleave in the middle of an RNA sequence (as opposed to from the ends). This enables targeting of RNA structures at any point throughout the RNA. Third, RNase L shows some modest sequence selectivity (Han et al., 2014), which can impart greater selectivity for a RiboTAC than the parent RNA binder.
However, because RNase L’s native enzymatic activity is dependent on its dimerization, RiboTACs must not only bring RNase L in proximity to the target RNA but also induce dimerization of the protein. Small molecules have been identified that both activate (Borgelt et al., 2022, Costales et al., 2020, Meyer et al., 2022, Thakur et al., 2007) and inhibit (Daou et al., 2020, Jha et al., 2011) RNase L activity, thus careful characterization of the activity of new molecules must be established. This chapter will outline several methods crucial to the development of RiboTACs, including expression of recombinant RNase L, validation of RNase L and small molecule activity in vitro, and validation of RNase L-dependent activity in cells (Fig. 1B).
2. Expression and purification of recombinant RNase L
2.1. Active GST-RNase L fusion protein expression and purification
To assess the activity of RNase L-activating small molecules or RiboTACs in vitro, it is important to be able to purify active RNase L enzyme recombinantly. Human RNase L is a notoriously difficult protein to express and purify. Some researchers have previously utilized a baculovirus expression system in insect cells (Dong et al., 1994), while others have attempted expression from Escherichia coli (E. coli) (Gupta and Rath, 2012, Han et al., 2014). In the following method, RNase L is expressed as a glutathione S-transferase (GST) fusion protein, enabling facile expression in E. coli and quick, one-step purification. The RNase L sequence was previously cloned into a pGEX-4T plasmid backbone, containing a thrombin-cleavable GST tag (Dong & Silverman, 1997). The GST fusion protein retains ribonuclease activity and remains activatable by 2′–5′A. The fusion protein can also interact with unlabeled RNase L in a 2′–5′A-dependent manner (Dong & Silverman, 1997), indicating that the GST tag does not significantly interfere with the ability to dimerize RNase L.
2.1.1. Equipment
Protein gravity columns
Incubator with controllable temperature and shaking speed
Sonicator
High-speed centrifuge
Swinging bucket rotor centrifuge
UV spectrophotometer
Centrifugal Filter, 30 kDa cutoff
2.1.2. Buffers and reagents
1 L Autoclaved LB medium (10 g NaCl, 10 g tryptone, 5 g yeast extract)
Sterile 50% (v/v) glycerol
20× NPS [0.5 M (NH4)2SO4, 1 M KH2PO4, 1 M Na2HPO4]
50× 5052 [25% (w/v) glycerol, 2.5% (w/v) glucose, 10% (w/v) α-lactose monohydrate]
1 M MgSO4
Lysis Buffer [8 mM Na2HPO4, 2 mM KH2PO4, pH 8.0, 137 mM NaCl, 2.7 mM KCl, 10 mM β-mercaptoethanol, 5 mM MgCl2, 25 μM ATP, 10% (v/v) glycerol]
Elution Buffer [50 mM Tris, pH 8.0, 150 mM NaCl, 20 mM reduced glutathione, 10% (v/v) glycerol]
2× RNase L Storage Buffer [40 mM Na+ HEPES, pH 7.4, 140 mM NaCl, 4 mM MgCl2, 2 mM DTT, 10% (v/v) glycerol]
Glutathione-Agarose Resin
Rosetta DE3 E. coli (Sigma-Aldrich 70954)
Protease Inhibitor Tablets
2.1.3. Procedure
2.1.3.1. Transformation
Day 1: Transformation.
-
1
Transform 10 ng RNase L pGEX-4T plasmid into Rosetta DE3 E. coli per the manufacturer’s protocol. Plate on an LB agar plate supplemented with 100 μg/mL ampicillin.
Note: Rosetta DE3 E. coli facilitates expression of mammalian proteins containing codons rarely used in E. coli. Other protein expression strains may be used, but lower yield may result.
-
2
Incubate overnight at 37 °C.
Day 2: Primary inoculation
-
3
Pick individual colonies from the agar plate, placing them in 15 mL conical vials with 2 mL sterile LB medium supplemented with 200 μg/mL carbenicillin, 34 μg/mL chloramphenicol, and 0.5% (w/v) glucose.
Note: Glucose in the primary inoculum helps to prevent leaky expression.
-
4
Shake at 220 rpm at 30 °C for 16 h.
Note: Incubation at 30 °C allows for slower growth, limiting the time spent at saturation.
Day 3: Glycerol stock preparation.
Mix saturated overnight primary inoculum 1:1 with sterile 50% (v/v) glycerol.
Flash freeze in liquid nitrogen.
Store at −80 °C.
Note: RNase L plasmid continues to show sufficient expression provided the glycerol stock remains frozen. However, best practice is to use a fresh transformation each time.
2.1.3.2. Expression and purification
Day 1: Primary inoculum.
Supplement 100 mL autoclaved LB medium with 100 μg/mL carbenicillin, 34 μg/mL chloramphenicol, and 0.5% (w/v) glucose in a sterile 500 mL Erlenmeyer flask.
-
Using a sterile 200 μL pipette tip, scrape from the surface of the frozen glycerol stock prepared previously, or preferably transfer a single, newly transformed colony into the LB medium.
Note: Do not allow glycerol stock to thaw when scraping. Keep frozen to allow multiple uses.
Incubate, shaking at 220 rpm, at 30 °C overnight.
Day 2: Expression.
Prepare two separate 1 L solutions of LB medium supplemented with 100 μg/mL carbenicillin and 34 μg/mL chloramphenicol in 2 L Erlenmeyer flasks.
Add 20 mL sterile 50× 5052, 50 mL sterile 20× NPS, and 1 mL 1 M MgSO4 to each 1 L LB solution.
Add 10 mL from the saturated primary inoculum from the previous day to each 1 L LB solution.
Shake at 220 rpm at 25 °C for ~24 h.
Note: When expressing RNase L, it is helpful to take a sample from the primary inoculum and the expressed culture and measure the optical density at 600 nm (OD600). Centrifuge 1 mL of both samples for 2 min at 3500g, then remove the supernatant and resuspend in enough LB medium for the OD600 of each sample to be 10. To confirm induction of RNase L expression, analyze the samples by sodium dodceyl sulfate-polyacrylamide gel electrophoresis (SDS-PAGE), where the expected size for the GST-RNase L construct is 110 kDa.
Day 3: Purification.
-
Spin down cultures at 3500g for 30 min at 4 °C.
Note: If planning to perform the purification later, scrape the cell pellet into liquid nitrogen to flash freeze and store at −80 °C. The pellet should be stored no longer than one week at −80 °C before purification.
Critical: All remaining steps should be performed at 4 °C, whether on ice, in a refrigerator, or in a cold room. Perform these steps as quickly as possible (<5 h), to avoid loss of activity.
Add 50 mL of Lysis Buffer to the cell pellet, mix gently with a stir rod and transfer to a plastic beaker.
Stir with a stir bar at 4 °C or on ice until the solution is homogenous (no discrete chunks of cell pellet remaining).
Add lysozyme to a final concentration of 1 mg/mL; stir until dissolved.
Crush one protease inhibitor pill and add to the solution; stir until dissolved.
Aliquot the sample into equal volumes in two 50 mL conical vials.
-
Place the samples on ice and sonicate using the pulse setting: on for 5 s and off for 10 s, for a total of 2 min of “on” time.
Note: Time for sonication will depend on the instrument/intensity used.
Clarify the soluble fraction of the lysate by centrifugation at 20,000g for 30 min at 4 °C.
While clarifying the lysate, wash the glutathione-agarose resin. Using fresh resin, add 10 mL resin (20 mL of the 50% slurry) to a ~90 mL protein chromatography column. Allow to drain by gravity. This 10 mL of resin is sufficient to load the entirety of the lysate from 2 L of saturated culture.
-
Equilibrate the column by adding 50 mL Lysis Buffer to the resin; let drain by gravity. Repeat once more.
Note: The lgutathione-agarose resin purifies up to 5 mg of a GST-RNase L fusion protein per mL of resin in our hands. Additional resin may improve yields but must be washed more thoroughly. Typically, the yield of the active RNase L fusion protein is limited by the expression, rather than the binding to the resin.
Carefully pour the soluble fraction of the clarified lysate onto the resin in the column. Mix the resin and lysate slurry gently with a stir rod.
Place the column at a 45° angle on a shaking plate at 4 °C. Shake at a sufficient speed (~100 rpm) to keep the resin suspended in solution without causing bubbles to form. Shake for 1 h to allow the GST-RNase L to bind to the glutathione agarose resin.
Place the column upright; drain by gravity flow at 4 °C.
Without disturbing the resin, wash the resin with ~45 mL Lysis Buffer; drain by gravity flow at 4 °C.
Repeat wash steps with Lysis Buffer until the absorbance at 280 nM (A280) as measured by a UV spectrophotometer is less than 0.01.
Add 10 mL Elution Buffer to the resin. Mix by gently pipetting with a 10 mL serological pipet.
Incubate at 4 °C for 5 min, then elute by gravity.
-
Repeat previous two steps until no more protein elutes, as monitored by a Bradford assay. Usually, four elution steps are sufficient to recover>90% of the bound protein.
Note: The BCA Protein Assay Kit (Pierce) is incompatible with the buffer components used for the purification. Further, this kit requires a 2 h incubation period. Be sure to monitor protein elution using a compatible assay.
Combine fractions, then buffer exchange into 2× Storage Buffer using centrifugal filters (cutoff 30 kDa). Combine elution fractions, mix, then separate into several filter units (e.g., if there were four elution steps, then combine the ~40 mL, and then split into four filter units, each with ~10 mL). Then, concentrate each to ~5 mL. Dilute each sample with an addition 5 mL of 2× Storage Buffer, then repeat. After 5 cycles, the protein should be in>97% 2× Storage Buffer.
Measure the concentration of buffer-exchanged protein by A280.
Add an equal volume of 50% (v/v) glycerol to aliquots of the purified protein and flash freeze in liquid nitrogen. Store at −80 °C until needed. The typical yield from 2 L of expression is 5 mg.
The purity of RNase L can be assessed by an SDS-PAGE followed by Coomassie staining. This preparation typically yields protein with greater than 90% purity (110 kDa).
Critical: RNase L loses activity with freeze-thaw cycles, when stored unfrozen (at −20 °C with glycerol), and if kept on ice for several hours. For enzymatic assays, use freshly thawed aliquots each time.
2.1.4. Troubleshooting
Problem: Insufficient expression of RNase L.
Solution: Test expression at time points up to 36 h. This protocol uses autoinduction medium, thus the time until E. coli begin to consume lactose to induce expression can vary. Additionally, if using a glycerol stock, it may be best to perform a fresh transformation.
Problem: Glutathione-agarose column does not sufficiently bind GST-RNase L fusion protein.
Solution: Increase either the amount of resin or incubation time with the resin. Ensure that the resin remains suspended during the incubation to enable complete binding of GST. If having difficulty with suspending the resin in the column, the resin/lysate solution can be transferredto a plastic beaker and incubated while stirring. After the incubation period, add this solution back to the column.
Problem: RNase L is impure.
Solution: Run a Western blot to determine whether impurities are RNase L degradation product(s) or co-purified proteins. If the former, then a fresh transformation (and possibly shorter expression times) may help. If the latter, wash the resin more thoroughly before elution.
2.2. Inactive RNase L expression and purification
For some assays, it is beneficial for RNase L to be incapable of catalyzing RNA degradation. For this, a previously described (Han et al., 2014) catalytically incompetent mutant (H672N) is most useful. The mutation eliminates the catalytic histidine residue from the active site but retains the RNA-binding capabilities of the enzyme. The H672N mutation was utilized in the only crystal structures of human RNase L, where electron density corresponding to a pyrimidine base in the active site was resolved (Han et al., 2014). The RNase L H672N mutant prepared here only contains amino acids 21–719 of the native RNase L sequence, the same as the crystallized human RNase L construct. The shortened inactive RNase L construct was cloned by AtumBio, which contains lactose-inducible expression and a human rhinovirus 3C protease-cleavable GST tag, yielding the plasmid pMDD-RNaseLInactive. Because the mutation renders RNase L catalytically incompetent, this protein can be expressed using a more standard isopropyl β-d-1-thiogalactopyranoside (IPTG)-induced protocol, as outlined below.
2.2.1. Equipment
Protein gravity column
Incubator with controllable temperature and shaking speed
Sonicator
High-speed centrifuge
Swinging bucket rotor centrifuge
UV spectrophotometer
Centrifugal Filter, 30 kDa cutoff
Fast protein liquid chromatography (FPLC) system
Preparative size exclusion column
2.2.2. Buffers and reagents
Autoclaved LB medium (10 g NaCl, 10 g tryptone, 5 g yeast extract)
Sterile 50% (v/v) glycerol
Isopropyl β-d-1-thiogalactopyranoside (IPTG; 1 M solution)
Lysis Buffer [8 mM Na2HPO4, 2 mM KH2PO4, pH 8.0, 137 mM NaCl, 2.7 mM KCl, 10 mM β-mercaptoethanol, 5 mM MgCl2, 25 μM ATP, 10% (v/v) glycerol]
Wash Buffer [20 mM Na+ HEPES, pH 7.5, 109 mM NaCl, 5 mM MgCl2, 10 mM DTT, 100 μM ATP, 10% (v/v) glycerol]
Cleavage Buffer [20 mM HEPES, pH 7.5, 109 mM NaCl, 5 mM MgCl2, 10 mM DTT, 2.8 mM ATP, 10% (v/v) glycerol]
Glutathione-Agarose Resin
PreScission Protease
Rosetta DE3 E. coli (Sigma-Aldrich 70954)
Protease Inhibitor Tablets
2.2.3. Procedure
2.2.3.1. Transformation
Day 1: Transformation.
-
Transform 10 ng of pMDD-RNaseLInactive plasmid into Rosetta DE3 E. coli per the manufacturer’s protocol. Plate on an agar plate containing 100 μg/mL ampicillin.
Note: Rosetta DE3 E. coli facilitates expression of mammalian proteins containing codons rarely used in E. coli. Other protein expression strains may be used, but lower yield may result.
Incubate overnight at 37 °C.
Day 2: Primary inoculation.
-
Pick individual colonies from the agar plate, placing them in 15 mL conical vials with 2 mL sterile LB medium supplemented with 100 μg/mL carbenicillin, 34 μg/mL chloramphenicol, and 0.5% (w/v) glucose.
Note: Glucose in the primary inoculum helps to prevent leaky expression.
Shake at 220 rpm at 30 °C for 16 h.
Note: Incubation at 30 °C allows for slower growth, limiting the time spent at saturation.
Day 3: Glycerol stock preparation.
Mix saturated overnight primary inoculum 1:1 with sterile 50% (v/v) glycerol.
Flash freeze in liquid nitrogen.
Store at −80 °C.
Note: The inactive RNase L plasmid continues to show sufficient expression provided the glycerol stock remains frozen. However, best practice is to use a fresh transformation each time.
2.2.3.2. Expression and purification
Day 1: Primary inoculum.
Supplement 100 mL autoclaved LB medium with 0.5% (w/v) glucose, 100 μg/mL carbenicillin, and 34 μg/mL chloramphenicol in a sterile 500 mL Erlenmeyer flask.
-
Using a sterile 200 μL pipette tip, scrape from the surface of the frozen glycerol stock prepared previously, or preferably transfer a single, newly transformed colony into the LB medium.
Note: Do not allow glycerol stock to thaw. Keep frozen to allow multiple uses.
Incubate, shaking at 220 rpm at 30 °C overnight.
Day 2: Expression.
Prepare two separate 1 L solutions of LB medium supplemented with 100 μg/mL carbenicillin and 34 μg/mL chloramphenicol in 2 L Erlenmeyer flasks.
Add 8 mL sterile 50% (v/v) glycerol to each 1 L LB solution.
Add 10 mL from the saturated primary inoculum from the previous day to each 1 L LB solution.
Shake at 220 rpm at 37 °C until the OD600 reaches 0.6–0.8.
Reduce the temperature in the incubator to 16 °C.
Cool until the temperature of the culture is below 20 °C.
-
Add IPTG to a final concentration of 0.2 mM.
Note: Take a sample of the culture just prior to adding IPTG. This sample can serve as the uninduced control to check for expression. Successful expression should result in a clear induced band at 106 kDa, as assessed by SDS-PAGE. The protocol described in Section 2.1 to check expression can be used here as well.
Shake at 220 rpm for ~16 h overnight at 16 °C.
Day 3: Purification.
-
1
Pellet the cells by centrifugation (3500g for 30 min at 4 °C).
Note: If planning to perform the purification later, scrape the cell pellet into liquid nitrogen to flash freeze and store at −80 °C until needed.
Critical: All remaining steps should be performed at 4 °C, whether on ice, in a refrigerator, or in a cold room.
-
2
Follow steps 2–13 from the active RNase L prep in Section 2.1.
-
3
Without disturbing the resin, pour ~45 mL Lysis buffer onto the column, drain by gravity flow at 4 °C.
-
4
Without disturbing the resin, pour ~45 mL Wash buffer onto the column, drain by gravity flow at 4 °C.
-
5
Repeat wash steps with Wash Buffer until the A280 is less than 0.01.
-
6
Add 90 mL of Cleavage Buffer to the 10 mL of resin. Mix with a stir rod and gently pour into a clean beaker.
-
7
Add 250 μL (250 units) of PreScission Protease to the solution.
Note: One unit of PreScission Protease cleaves 0.1 mg of protein in 16 h at 4 °C. If scaling this protein preparation, adjust the enzyme concentration accordingly.
-
8
Add a stir bar and spin at a speed sufficient to keep the resin suspended without causing bubbles (~120 rpm). Cover with parafilm and stir overnight ~16 h at 4 °C.
Critical: When cleaving the GST tag, the concentration of RNase L must be low (<10 μM). RNase L may begin to precipitate at concentrations over 10 μM without the GST tag, lowering yield. Any bubbles induced from stirring overnight will also result in increased precipitation.
Day 4: Purification (continued)
-
9
Pre-equilibrate a preparative size exclusion column in an FPLC system with Wash Buffer at a flow rate of 0.7 mL/min. It is helpful to do this well in advance, as this can take ~ 3 h.
-
10
Gently pour resin solution back into a clean protein chromatography column.
-
11
Collect the eluate by gravity flow. Wash once with Cleavage Buffer.
-
12
Concentrate using a centrifugal filter with a 30 kDa cutoff spin column until the concentration is ~5 mg/mL. If all prior steps performed well, you should have ~10 mL of a 5 mg/mL solution.
-
13
Centrifuge at 20,000g for 10 min to pellet any protein precipitate.
-
14
Load onto the size exclusion column and elute in Wash Buffer. Multiple injections may be required, depending on total volume from step 12.
-
15
Pool fractions containing monomeric RNase L (peak around 80 kDa)
Note: Run protein standards for the size exclusion column. Monomeric RNase L should run close to 80 kDa with a properly made standard curve.
-
16
Measure the concentration of pooled sample by A280 and flash freeze small aliquots in liquid nitrogen. The typical yield from 2 L of expression is ~10 mg after the size exclusion column.
-
17
Assess purity of the inactive RNase L by SDS-PAGE and Coomassie staining. This preparation consistently purifies RNase L to>98% homogeneity.
Critical: Inactive RNase L misfolds with freeze-thaw cycles and when stored unfrozen (at −20 °C with glycerol), so use freshly thawed aliquots each time.
2.2.4. Troubleshooting
Problem: Insufficient expression of RNase L.
Solution: Test expression with varying concentrations of IPTG. Use the lowest concentration of IPTG that enables sufficient expression. If expression issues persist, perform a fresh transformation.
Problem: Glutathione-agarose column does not sufficiently bind inactive GST-RNase L fusion protein.
Solution: Increase both the amount of resin and incubation time with the resin. Ensure that the resin remains suspended during the incubation to enable complete binding of GST. If having difficulty with suspending the resin in the column, the resin/lysate solution can be transferred to a plastic beaker and incubated while stirring (no bubbles!). After the incubation, add this solution back to the column.
Problem: RNase L is impure.
Solution: Determine whether impurities are RNase L degradation product(s) or co-purified proteins by Western blotting. If the former, then a fresh transformation (and possibly shorter expression times) may help. If the latter, wash the resin more thoroughly before elution. Common contaminants include PreScission protease, uncleaved GST-RNase L, and free GST. These can be removed by running the eluate back through fresh glutathione-agarose resin.
Problem: Solubility issues after cleavage of the GST tag.
Solution: If precipitation occurs during the overnight cleavage, increase the total volume of solution in subsequent attempts such that the protein concentration is less than 10 μM. RNase L is rather prone to aggregation, thus keeping the protein at lower concentrations in buffers containing 10% (v/v) glycerol is necessary.
3. In vitro assays to assess engagement and activation of RNase L
The first important step in RiboTAC development is to assess the ability of the RiboTAC to engage and activate RNase L in vitro. As mentioned in Section 1, RNase L is natively present as an inactive monomer in cells. RNase L is only activated upon ligand-induced dimerization (Choi et al., 2015, Malathi et al., 2005, Silverman, 2007). Because RiboTACs must activate RNase L to degrade their target RNA, it is important to demonstrate not only RiboTAC binding to RNase L, but activation as well. In Section 3.1, in vitro techniques to assess engagement of RNase L by small molecules will be described. Then, in Section 3.2, techniques to assess RNase L activation by small molecules will be discussed.
3.1. Assessment of RNase L engagement
3.1.1. Saturation transfer difference (STD) nuclear magnetic resonance (NMR) spectroscopy for small molecule screening
STD NMR is a powerful tool for screening small molecule interactions with a target macromolecule (Mayer and Meyer, 1999, Viegas et al., 2011). Since its introduction, STD NMR has been extended beyond simple assessment of binding to more informative methods, providing structural details of protein-ligand interactions, measurement of dissociation constants, and identification of the type of amino acids (aromatic, polar or aliphatic) that are in direct contact with the bound ligand through differential epitope mapping (DEEP-STD) (Monaco, Tailford, Juge, & Angulo, 2017). This detailed structural information can provide unbiased guidelines for lead optimization. STD NMR spectroscopy requires a small amount of unlabeled protein, and there is no size limitation for the target macromolecule, in contrast to traditional protein-focused NMR (Krishna & Jayalakshmi, 2008).
The Nuclear Overhauser Effect (NOE) is the basis of STD NMR. Based on the NOE, the signal intensity of a proton can be perturbed by nearby protons through cross-relaxation. In STD NMR spectroscopy, applying a selective radiofrequency pulse saturates specific protons in the protein, resulting in enhanced or reduced signal intensity of nearby protons upon relaxation of the saturated proton. The saturation propagates across the whole protein through a process called “spin diffusion.” If a small molecule is bound to the protein, the saturation will also be transferred to the ligand causing reductions of signal intensity. Different protons of the ligand will receive different levels of saturation, and those that have the closest contacts with protein will experience the greatest reduction in signal intensity. This allows epitope mapping of the bound ligand, enabling the identification of protons in the small molecule that drive interactions with the protein.
One of the drawbacks of the technique is that direct study of high-affinity ligands (Kds in the nM range) is not possible. The saturated ligand must be in fast exchange between the free and bound states. Thus, Kds in the mM to μM range are ideal to make the difference between saturated and reference (unsaturated) spectra observable (Hall et al., 2020). However, this drawback can be addressed with competitive STD NMR spectroscopy, assuming a low affinity reporter ligand is available.
STD NMR spectroscopy is a useful technique for identifying and characterizing the engagement of small molecule RNase L binders. Since the RNase L-activating small molecules identified to date are relatively weak binders (mid-micromolar potency), STD NMR spectroscopy can easily confirm their binding. Additionally, competitive STD NMR spectroscopy can be utilized to confirm that small molecule activators of RNase L compete in the same activation binding pocket as 2′–5′A. Fig. 2A outlines this NMR method, as applied to RNase L activators.
Fig. 2.

Scheme for STD NMR studies to assess compound binding. Protein is shown in surface representation and the ligand as spheres. (A) Top panel: Bound state of the ligand in relaxed state (left) with a 1H–1D NMR spectrum showing the equilibrium proton intensities of the ligand in the free state (right). Bottom panel: Excited protein upon saturation of methyl protons. Saturation spreads throughout the protein through spin diffusion (left). STD NMR (Ioff − Ion) of the bound ligand (right). Magnetization is transferred from the protein to the ligand protons which are in contact with protein surface. (B) FQ2LIST dialog is opened by typing “fq2list” into the command line of Topspin (top panel). The ellipsis and the “E” button will open the dialogs shown below. Middle panel: Dialog showing the previously saved frequency lists. Bottom panel: By selecting any of the frequency lists and using the edit button, a new frequency list can be created. In the newly created list, Line 2 corresponds to the on-resonance frequency and Line 3 to the off-resonance frequency, both in ppm.
3.1.1.1. Experimental considerations
Although the principles explained in the following sections are written for Bruker spectrometers, they can be applied to other spectrometers as well.
Pulse sequence in STD NMR
A series of low-power Gaussian-shaped pulses (stddiff) is used for selective saturation of protein protons. The reference spectrum is collected by applying a saturation pulse which is far away from any signals emanating from the small molecule or the protein (−40 or 40 ppm). This is called the off-resonance spectrum. An irradiation signal which corresponds to the protein’s methyl proton signals (0.6 ppm) is usually applied to saturate the protein (on-resonance spectrum). Care should be taken that the irradiation signals do not coincide with the ligand’s proton peaks.
Sample concentrations and buffer conditions
A successful STD NMR experiment requires the ligand concentration to be in great excess compared to the macromolecule. This is important because the observed ligand signal corresponds to the free ligand state. This will also enhance the STD NMR signal and minimize possible artifacts due to rebinding of the ligand. Practically, a ratio of 1:50–1:1000 of protein:ligand is recommended (Cutting et al., 2007, Viegas et al., 2011). Use of buffer components that have protons should be avoided as they will be observable in 1H NMR spectrum, confounding spectral interpretation. As such, phosphate buffers are recommended, provided parameters such as protein stability are not affected. Where possible, D2O should be used instead of H2O as water acts as a magnetization sink absorbing the transferred magnetization from protein and reducing the STD NMR signal. In contrast, using H2O is beneficial for DEEP-STD NMR.
Temperature effects
The rate of spin diffusion is affected by the rate of rotational diffusion of the protein, which is itself affected by temperature. The slower the protein tumbling, the faster the spin diffusion. For small proteins it might be necessary to lower the temperature to 278 K for effective saturation of protein. For ligands with affinities in the low μM range, an increase in temperature may increase the STD intensity, while low temperatures may be beneficial for weaker binders. Low temperatures will increase the residency time of the ligand within the protein binding pocket, increasing the chances of receiving saturation.
3.1.1.2. NMR spectrometer parameter set-up
Saturation frequency
On-resonance and off-resonance pulses are selected by using the “fq2list” parameter (Fig. 2B). For proteins, an on-resonance frequency of 0.6 ppm is usually used, although a standard 1H spectrum can be collected to determine the optimum frequency and the level of saturation of the protein.
Saturation time
Saturation time identifies the duration of the saturating pulse, which affects the STD intensity. Changing the saturation time can be completed by altering the “d20” parameter. For screening purposes, a saturation time of 2 s is typical.
Saturation power
Parameter “sp13w” controls the power of saturation. A value between 10 μW and 1 mW is typical, with a recommended value close to 1 mW. A STD NMR experiment with only ligand should be run to test the irradiation effect on the compound. Difference spectra should be blank if the compound is not directly irradiated.
3.1.1.3. Procedure
Prepare a 10 mM stock of the screening compound in DMSO and a 10 μM stock of RNase L in 20 mM sodium phosphate buffer, pH 7.5.
Dry 18 μL from compound stock solution by lyophilization and redissolve in 10 μL of deuterated DMSO (d6-DMSO)
Combine 30 μL of D2O, 30 μL of 20× NMR buffer (200 mM sodium phosphate, pH 7.5 and 2 mM EDTA), and 510 μL of H2O to a final volume of ~580 μL.
Set the temperature of the NMR probe to 298 K.
Create a new experiment (Ctrl + N) or use the automation interface of topspin, set the buffer to 10% D2O–90% H2O and set the experiment to STD (stddiff.3) with stddiffgp⁎ for solvent suppression.
Lock the spectrometer to D2O, tune and match (atma) and shim (topshim).
Set the on- and off-resonance saturation frequencies (fq2list) to 0.6 and −40 ppm respectively, creating a new frequency list.
Set the saturation time and delay time to 2 s (d20 2:d1 2).
Run a short STD NMR experiment, setting the receiver gain manually (rg 128) and check for acceptable signal to noise quality. Values between 32 and 256 can be selected for “rg”. Be careful with automatic set up of receiver gain, as overestimation of the receiver gain can occur.
- Set the number of scans to 64 (ns 64) and run the experiment (zg).
- Analyze the compound only data according to section 3.1.1.4. Make sure to obtain a blank spectrum.
Add an appropriate aliquot of RNase L such that the ligand:protein ratio is 1:50–1:1000, repeating the aforementioned steps.
3.1.1.4. Data extraction and analysis
An STD NMR experiment is a pseudo-2D experiment, meaning the on- and off-resonance spectra are recorded on different planes. The following steps describe the analysis of the resulting data (shown in Fig. 2B):
Extract and transform the on-resonance spectrum with the command, efp 1 2, placing the data from the first pseudo plane into the second process slot. Phase the spectrum before saving it.
Reopen the 2D spectrum and transform the off-resonance spectrum and save it to process slot 3, efp 2 3. Phase the spectrum before saving.
Enter into multidisplay mode while the off-resonance spectrum is open and add the on-resonance spectrum. Use the Δ symbol to obtain the difference spectrum and save it to process slot 4.
This spectrum can then be compared to off-resonance spectrum to assess the binding of the ligand to RNase L.
3.1.1.5. Troubleshooting
Problem: The STD NMR signal is weak.
Solution: H2O can act as a magnetization sink. Replacing H2O with D2O can help to increase signal.
Problem: The protein is insufficiently saturated (which can occur for smaller proteins).
Solution: Lowering the temperature close to 278 K can help.
3.1.2. Circular dichroism
Another way to assess small molecule binding to RNase L is by circular dichroism (CD). Circular dichroism is a spectroscopic technique that measures the difference in absorption between left and right circularly polarized light to give information about protein secondary structures (Greenfield, 2006). Upon ligand binding, RNase L undergoes conformational rearrangements to facilitate dimerization that can be detected by CD (Fig. 3). The CD spectra of protein with and without ligand can be compared to assess if a binding interaction that facilitates RNase L conformational rearrangement is occurring.
Fig. 3.

Overview of how circular dichroism (CD) can be employed to assess RNase L dimerization. (A) Diagram outlining how circular dichroism functions. In brief, ultraviolet (UV) light is circularly polarized and passed through the sample. Chiral molecules in the sample will differentially absorb either right- or left-polarized light, and this difference is measured by the spectrophotometer. (B) A diagram illustrating how circular dichroism detects changes in RNase L conformations upon ligand binding. Because RNase L undergoes a significant conformational change upon ligand-induced dimerization, ligand-bound and apo-RNase L interact differently with the polarized light, which can be detected as a shift in the CD spectrum. Schematics were created with BioRender.com.
3.1.2.1. Equipment
CD Spectrometer
Quartz Spectrophotometer Cell, 1 mm
Centrifugal Filter, 30 kDa cutoff
3.1.2.2. Reagents
Inactive RNase L
1× CD Buffer (80 mM K2HPO4, 20 mM KH2PO4, pH 7.0, and 50 mM KF)
RNase L binding compound
3.1.2.3. Procedure
Set wavelength scan from 190 to 260 nm.
Blank instrument with 400 μL of 1× CD Buffer with 0.1% (v/v) DMSO.
- Buffer exchange the inactive RNase L into 1× CD Buffer using a centrifugal filter with a 30 kDa cutoff. Desired final concentration of inactive RNase L is 10 μM in 400 μL of 1× CD Buffer per sample to be tested.
- To avoid precipitation of the inactive RNase L, six buffer exchanges are recommended where an equal volume of 1× CD Buffer is added to inactive RNase L, and the resultant solution concentrated by 2-fold (to the original volume of RNase L). Six buffer exchanges result in a final buffer solution that is 98% 1× CD Buffer.
Collect spectra from 190 to 260 nm.
Dilute the RNase L binding compound to a final concentration of 75 μM [0.1% (v/v) DMSO final concentration] into 400 μL of inactive RNase L (10 μM) prepared in 1× CD Buffer.
Collect spectra using a wavelength scan from 190 to 260 nm.
3.1.2.4. Data analysis
Graph millidegrees (mdeg; a unit of ellipticity) as a function of wavelength.
Compare the spectrum of RNase L alone to the spectrum of RNase L with RNase L binding compound. A shift in the spectra [either in x-axis positioning (≥2 nm) or amplitude along the y-axis (≥1 mdeg)] (Andrews and Tretton, 2020, Miles et al., 2021) upon compound addition indicates a change in the difference between left and right circularly polarized light, and hence a change in RNase L conformation. The wavelength at which this shift occurs can provide information about the type of conformational change being induced. Since dimeric RNase L is mostly α-helical, the 208–222 nm range of the spectrum is the most important to assess (Greenfield, 2006).
Note: Noise if often high from 190 to 200 nm and thus spectral changes in this area should be considered carefully as they may not be indicative of binding.
3.1.2.5. Troubleshooting
- Peaks are not observed in the spectrum of the apo protein:
- Buffer conditions may not be compatible for proper RNase L folding. Ensure CD Buffer was freshly prepared and that protein has been adequately exchanged into 1× CD Buffer to remove contaminating regents from the RNase L storage buffer.
- RNase L precipitates during buffer exchange:
- Add larger volumes of 1× CD Buffer to maintain protein solubility.
- Protein concentrations>10 μM may cause aggregation and hence precipitation.
DMSO concentrations should be ≤0.1% (v/v), as higher concentrations can distort CD measurements.
3.1.3. Microscale thermophoresis
Microscale thermophoresis (MST) is a sensitive and automated assay that can be applied to measure the binding interactions between the RiboTAC and RNA, as compared to the small molecule binder from which the RiboTAC is derived. Such studies reveal if the RNase L-recruiting molecule was attached to a position within the small molecule that does not affect molecular recognition. Briefly, one component of the system (in the case of this example, the RNA) is fluorescently labeled by a Cy5 dye at the 5′ end, while the RiboTAC and small molecule binder are unlabeled. The RNA and the RiboTAC or binder are pre-mixed and loaded into a capillary where the Cy5 fluorescence intensity is monitored in real time. Upon irradiation by an infra-red (IR) laser, the change in temperature induces the flow of solution within the capillary, where the rate of flow is different for unbound RNA compared to bound RNA. This difference in the rate of flow leads to changes in the observed Cy5 fluorescence signal, which is indicative of binding interactions with the RNA. A diagram for this assay is shown in Fig. 4. This assay can be performed in multiple formats including (i) single dose screening; (ii) dose range to afford Kd; and (iii) competitive binding with another unlabeled RNA construct.
Fig. 4.

A diagram outlining the rationale for MST experiments that assess RiboTAC binding to RNA. The change in shape/size of the RNA upon binding to the small molecule changes the flow rate in an MST capillary. Created with BioRender.com.
3.1.3.1. Equipment
MST instrument
MST capillary
Microcentrifuge tubes (RNase-free)
3.1.3.2. Reagents
1× Folding Buffer (50 mM Tris–HCl, pH 7.4, and 100 mM NaCl)
Cy5-labeled RNA
RiboTAC and small molecule binder of interest
3.1.3.3. Procedure
Fold Cy5-labeled RNA in 1× Folding Buffer by heating at 95 °C for 1 min, followed by snap cooling on ice for 10 min
- Mix the following components in an RNase-free microcentrifuge tube with a total volume of 35 μL and the final concentration of DMSO being ≤0.2% (v/v).
- Cy5-labeled RNA (5 nM final concentration)
- RiboTAC or small molecule (0–50 μM, depending on the expected affinity of the interaction)
Incubate at room temperature in the dark for 30 min
Load into the MST capillary (10 μL each, n = 3 replicates).
- Measure the thermophoresis by using the MST Monolith instrument per the manufacturer’s guide, which is detailed as steps below.
- Select the MST power for the experiment from the 20%, 40%, 80% options. This is the power of IR laser used to heat the capillary, and therefore higher laser power generally yields stronger signals. However, higher laser power can also increase background noise, and it is recommended to test all options with any new assay system and choose the one affording the optimal signal to noise ratio.
- Complete a cap scan before starting the thermophoresis experiment. The cap scan measures the fluorescence signals of each capillary. All samples should have initial fluorescence signals within 10% of the control capillary containing only the Cy5-labeled RNA. Large variances in fluorescence signals across the samples or asymmetrical peaks from the cap scan can be caused by pipetting errors or aggregates, both of which must be resolved before initiating the experiment (see section 3.1.3.5 for tips).
- Once the cap scan is complete, the instrument can measure thermophoresis automatically. It can be programmed to complete multiple readings of the same sample as technical replicates. However, it is not recommended to measure the same sample more than three times due to potential photobleaching.
At least two independent experiments should be completed to ensure reproducible dose-dependent changes with values ≥5.
3.1.3.4. Data analysis
For single dose screening experiments, the values (normalized fluorescence, which is the fluorescence value measured in real time during thermophoresis normalized to the initial value measured from the cap scan) from the vehicle (no RiboTAC) can be compared directly with the values from the experimental group (with RiboTAC). A value ≥5 is typically considered as indiactive of binding while a is considered as no detectable binding (noise).
For dose response experiments, the Monolith Analysis software (pre-installed with the instrument) can be used directly to afford EC50 and/or values. Eq. (1) is used for the fitting.
| (1) |
3.1.3.5. Troubleshooting and helpful tips
Large variance of fluorescence signals in the cap scan could be caused by pipetting errors and/or aggregation. Try repeating the sample preparation with careful pipetting. A brief centrifugation can be performed while samples are in the microcentrifuge tubes to visually inspect for precipitation. Aggregation may be resolved by: (i) adding detergent such as Tween-20 up to 0.5% (v/v); (2) adding bovine serum albumin and/or yeast tRNA to reduce non-specific interactions; and (3) increasing the DMSO concentration up to 1% (v/v). Refer to the manufacturer’s troubleshooting guide for more details.
can either increase or decrease upon the binding event. This is due to conformational changes of binding complexes that may increase or decrease the rate of flow. Either direction of change indicates a binding event.
3.1.4. Assessment of RiboTAC, RNA, and RNase L engagement in vitro via co-immunoprecipitation
In vitro co-immunoprecipitation assesses RNA and RNase L engagement by a RiboTAC. The proposed RiboTAC mechanism of action outlined in Fig. 1 suggests that a ternary complex forms between RNase L, the RiboTAC, and the target RNA. If this complex forms, then pull-down of RNase L should enrich the target RNA in a RiboTAC-dependent manner. In this experiment, an RNase L antibody is immobilized on magnetic beads while the RNA target of the RiboTAC is radioactively labeled. If the RiboTAC induces the ternary complex, then the radioactively labeled RNA will be co-immunoprecipitated with RNase L (Meyer et al., 2022). A diagram for this experiment is shown in Fig. 5.
Fig. 5.
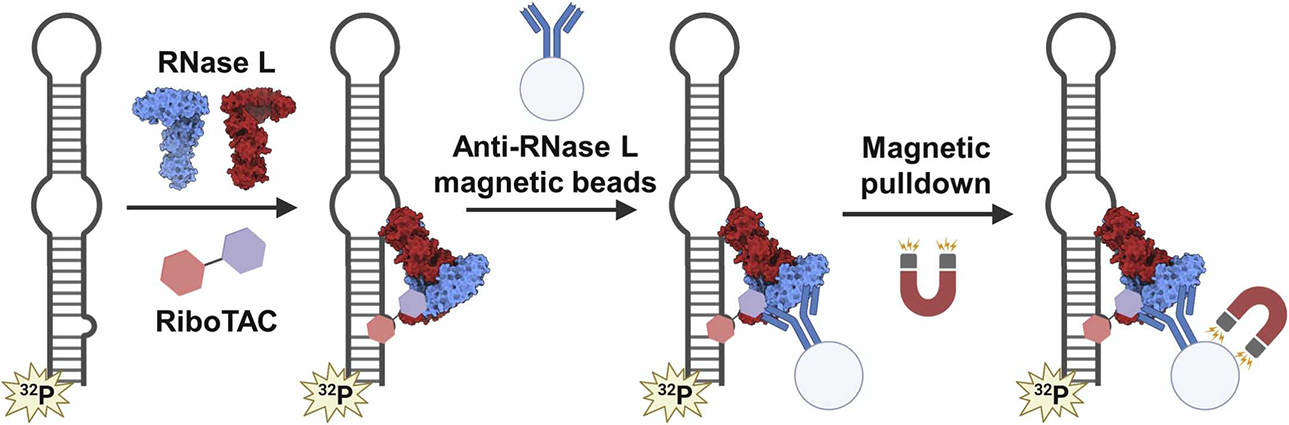
Workflow for in vitro co-immunoprecipitation assay. Recombinant inactive RNase L is incubated with the RiboTAC and radiolabeled target RNA, then pulled down via magnetic Dynabeads displaying an anti-RNase L antibody. Created with BioRender.com.
3.1.4.1. Equipment
Magnetic tube racks
Microcentrifuge tubes (RNase-free)
Liquid Scintillation Counter
3.1.4.2. Reagents
RiboTAC target RNA with 5′ end lacking a phosphate
[γ-32P] ATP
10× T4 Polynucleotide Kinase Buffer
T4 Polynucleotide Kinase
2× Orange G Loading Dye [3.3 mM Tris–HCl, pH 8, 12.5% (w/v) glycerol, 10 mM EDTA, 0.02% (w/v) Orange G dye]
300 mM NaCl
Glycogen, RNA-Grade
1× RNase L Assay Buffer (50 mM Tris–HCl, pH 7.4, and 100 mM NaCl)
700 mM β-mercaptoethanol (prepared fresh)
5 mM ATP, pH 7.4
100 mM MgCl2
Inactive RNase L
22× RiboTAC stocks (1:1 DMSO:H2O)
Dynabeads Protein A (Life Technologies, 10001D)
Anti-RNase L primary antibody (Cell Signaling Technology, D4B4J)
1× Phosphate Buffered Saline with 0.02% (v/v) Tween-20 (PBST), pH 7.4
Nuclease-free H2O
3.1.4.3. Procedure
Radioactively labeling RNA
- Combine the following reagents in a microcentrifuge tube:
- 1 nmol of the target RNA lacking a phosphate on the 5′ end. If the RNA was produced by in vitro transcription, first remove the triphosphate with alkaline phosphatase. The phosphatase is then removed by phenol–chloroform extraction and ethanol precipitation.
- 3 μL of 10× T4 Polynucleotide Kinase Buffer
- 0.4 μL of [γ-32P] ATP
- 2 μL of 10 units/μL T4 Polynucleotide Kinase
- H2O up to 30 μL
Incubate at 37°C for 45 min
Add 2× Orange G Loading Dye
Separate RNA from excess [γ-32P] ATP on a denaturing polyacrylamide gel of the appropriate percentage.
Use UV shadowing or phosphorimaging to visualize the labeled RNA.
Excise the radiolabeled RNA and place in a microcentrifuge tube containing 500 μL of 300 mM NaCl. Tumble or shake the tube for at least 4 h at 4 °C.
Centrifuge the microcentrifuge tube at 16,000g for 15 min to pellet the gel. Transfer the supernatant containing the radiolabeled RNA into a clean 2.0 mL microcentrifuge tube.
Add 1.5 mL of 100% ethanol and 1 μL of glycogen to the RNA solution.
Place solution at −80 °C for 30 min to precipitate RNA.
Centrifuge sample at 4 °C at the maximum speed for 15 min.
- Remove the ethanol solution, being careful not to disturb the RNA pellet.
- Leave tubes open for 15 min to allow residual ethanol to evaporate or briefly place in a vacuum concentrator.
- Dissolve the RNA in 25 μL of nuclease-free H2O.
Measure the radioactive signal of the radiolabeled RNA via liquid scintillation counting.
In vitro co-immunoprecipitation of RNA and RNase L
- Fold the target RNA in 1× RNase L Assay Buffer (20 μL per sample) by heating at 95 °C for 1 min, followed by snap cooling on ice for 10 min.
- Each sample should contain 20,000 counts per minute (cpm).
- After RNA is folded, add the following reagents to the tube containing the RNA:
- β-mercaptoethanol to a final concentration of 7 mM
- ATP to a final concentration of 50 μM
- MgCl2 to a final concentration of 1 mM
Aliquot 20 μL of the folded RNA solution into microcentrifuge tubes.
Prepare 22× stock solutions of RiboTAC to be tested in 1:1 DMSO:H2O.
Add 1 μL of 22× RiboTAC stock solution to each sample.
Incubate samples for 15 min at room temperature.
Prepare 4.4 μM stock solution of inactive RNase L in RNase L Storage Buffer lacking glycerol.
Add 1 μL of inactive RNase L stock to each sample.
Incubate samples for 1 h at room temperature.
- Prepare Dynabeads Protein A/anti-RNase L antibody complex.
- Resuspend Dynabeads by vortexing gently for 45 s.
- Transfer Dynabeads to a fresh tube (10 μL per sample).
- Place tube in the magnetic rack and remove the supernatant.
- Wash Dynabeads with 1× PBST [1× PBS with 0.02% (v/v) Tween-20].
- Prepare a 1:10 dilution of anti-RNase L primary antibody in 1× PBST (100 μL per sample). Add an equimolar amount of the antibody to the loading capacity of the beads.
- Add the antibody solution prepared in (e) to the Dynabeads, and incubate the samples with rotation for 10 min.
- Place the tube on the magnetic rack and remove the supernatant.
- Resuspend the Dynabeads with 1× PBST.
- Aliquot 10 μL of bead solution per sample into clean microcentrifuge tubes.
- Place tubes on magnetic rack and remove the supernatant.
- Save an aliquot of the beads to verify the antibody is associated with the beads, which can be assessed via Western blotting.
Add samples from Step 9 to the Dynabeads/antibody complexes aliquoted in step 10i.
Tumble samples overnight at 4 °C.
Place tubes on magnetic rack and transfer supernatant to fresh tubes.
- Wash samples gently with 20 μL of 1× PBST.
- Note: Wash gently to avoid disrupting the complex. Add PBST slowly down the side of the tube. Gently pipette up and down twice to resuspend the beads.
Place tubes on magnetic rack, and combine supernatant with supernatant from step 13.
Quantify radioactivity associated with the beads and the supernatant using liquid scintillation counting.
3.1.4.4. Data analysis
- Relative RNA enrichment is calculated by comparing the radioactive signal associated with the beads (RNA co-immunoprecipitated with RNase L) versus the total radioactive signal (signal from the beads plus signal from the supernatant) [Eq. (2)].
(2)
3.2. Assessment of RNase L activation
3.2.1. Monitoring RNase L activation via a dually labeled RNA substrate
In this section, we outline a detailed procedure for a fluorescence-based in vitro RNA cleavage assay that has been routinely used to assess small molecule induction of RNase L dimerization and activity (Han et al., 2012, Thakur et al., 2007). In this assay, an RNA construct with preferred RNase L cleavage sites (unpaired uridines) is dually labeled with fluorescein (6-FAM) on the 5′ end and a black hole quencher (BHQ) on the 3′ end (Thakur et al., 2007). When incubated with monomeric RNase L, the RNA will remain intact (not cleaved) and thus FAM fluorescence will be quenched. However, upon addition of molecules that activate RNase L, the endonuclease will dimerize and cleave the RNA, separating the FAM and BHQ. Thus, RNA cleavage can be read-out as a function of increasing FAM fluorescence, as shown in Fig. 6A. If a molecule cannot activate RNase L, then no increase in FAM fluorescence will be observed upon addition. The simplicity of this assay makes it amenable to high-throughput screening of potential RNase L activators.
Fig. 6.

Overview of in vitro RNA activation assay. (A) A dually-labeled model RNA can be utilized in an in vitro RNase L FRET cleavage assay. Addition of molecules that activate RNase L results in degradation of the model RNA. The degradation of the RNA frees the 5′FAM fluorescent label from quenching by 3′BHQ, resulting in an increased FAM fluorescence signal. (B) A heatmap showing fluorescence signal as a function of 2′–5′A4 and RNase L concentration. Red indicates higher fluorescence while green indicates lower fluorescence. The outlined box could be chosen as the optimal concentration, due to the highest signal over background (when compared to the rightmost column lacking 2′–5′A4). (C) Mock data for a successful RNase L activator. 2′–5′A4 typically yields a much larger signal than small molecule activators. RNase L activators should show a dose-dependent increase in fluorescence, but no change in the absence of RNase L.
3.2.1.1. Equipment
Fluorescence plate reader capable of excitation at 485 nm (with filter cut-off at 495 nm) and emission detection at 520 nm
Microcentrifuge tubes (RNase-free)
Plate-compatible centrifuge
384-well low volume non-binding plates (Corning, catalog no. 4514)
Critical: This assay is incompatible with low-, medium- and high-binding plates.
3.2.1.2. Reagents
5′ 6-FAM – UUAUCAAAUUCUUAUUUGCCCCAUUUUUUUGGUUUA – 3′ BHQ (model RNA)
5′-[Phos][rA2–5][rA2–5][rA2–5][rA]-3′ (2′–5′A4)
55× compound stocks (1:1 DMSO:H2O)
1× RNase L Assay Buffer (50 mM Tris–HCl, pH 7.4, and 100 mM NaCl)
700 mM β-mercaptoethanol (prepared fresh)
5 mM ATP, pH 7.4
100 mM MgCl2
Recombinant active RNase L (GST-RNase L; see Section 2.1 for its preparation)
3.2.1.3. Procedure
Matrix assay for optimization of RNase L concentration
Because specific activity of RNase L can vary from batch to batch and decreases over time, it is important to first identify an RNase L concentration with the best signal to noise ratio. The following procedure optimizes FAM signal by varying 2′–5′A4 and RNase L concentration. We recommend creating a matrix in which the RNase L concentration is varied from 0 to 400 nM in 2-fold dilution (11 total RNase L concentrations) and 2′–5′A4 concentration is varied from 0 to 400 nM in 2-fold dilution (11 total 2′–5′A4 concentrations). Thus, with controls, the matrix is composed of 121 conditions (wells). Ideally, the reactions should be assembled by placing the plate on ice. Example data for this matrix assay can be found in Fig. 6B.
- Fold model RNA in 1× RNase L Assay Buffer by heating at 95 °C for 1 min, followed by snap cooling on ice for 10 min
- The final concentration of RNA in the assay is ~100 nM.
- Fold two solutions of RNA; ~400 μL of 200 nM RNA and ~1.2 mL of 100 nM RNA (see note in ii).
- The final volume (once reagents in step 2 are added) should be 400 μL for the 200 nM solution and 1.2 mL for the 100 nM solution. ⁎Excess volume is already included in the calculations.
- After the RNA is folded, add the following reagents to the tube containing the RNA:
- β-mercaptoethanol to a final concentration of 7 mM
- ATP to a final concentration of 50 μM
- MgCl2 to a final concentration of 1 mM
Prepare 110 μL of 800 nM active RNase L in 1× RNase L Assay Buffer.
Add 20 μL of 200 nM of folded RNA to the wells in column 1, down to Row K, excluding A1.
Add 10 μL of 200 nM RNA to wells A2–A11.
Add 10 μL of 100 nM RNA solution to the remaining wells, B2–B11 through row K (100 wells in total).
- Add 10 μL of active RNase L prepared in Step 3 to wells A2–A11. The concentration of RNase L and RNA in these wells is 400 nM and 100 nM, respectively.
- Note: RNase L can self-dimerization, and activation has been observed at concentrations around 100 nM, and a KM of ~400 nM in the absence of 2′–5′A has been suggested (Han et al., 2012). Concentrations where self-activation is observed cannot be used to assess RNase L activation by small molecules. This matrix allows experimental determination of the concentrations at which self-activation occurs.
With a multichannel pipettor, serially dilute the samples 1:10 (10 μL). Transfer 10 μL from wells A2–A11 to B2-B11, then B2-B11 to C2-C11, and so forth until reaching J2-J11. Row J will contain 0.781 nM RNase L (ten 1:1 serial dilutions). Row K will contain 0 nM RNase L.
Add 20 μL of 200 nM RNA solution prepared in step 2 to well A1.
Add 20 μL of active RNase L prepared in Step 3 to well A1. The concentration of RNase L and RNA in this well is 400 nM and 100 nM, respectively.
Serially dilute (1:1, 20 μL aliquoted from each well) down column 1 until reaching Row J. Row J will contain approximately 0.78 nM RNase L. Row K will contain 0 nM RNase L.
Add 0.5 μL of 16 μM 2′–5′A4 to each well in column 1 (A1–K1). The final concentration of 2′–5′A4 in these wells is 400 nM.
Serially dilute (1:1, 10 μL aliquoted from each well) across the rows from Column 1 until Column 10, where the final concentration of 2′–5′A4 is approximately 0.78 nM. Do not add 2′–5′A4 to Column 11, as this serves as a no 2′–5′A4 control (assesses background cleavage at each RNase L concentration).
Cover the plate with an adhesive seal.
Briefly centrifuge the plate (1100g, 1 min).
- Remove the seal and record fluorescence to obtain a t = 0 measurement. We use the following parameters when measuring fluorescence with a Tecan Infinite M1000 Pro, but these parameters will depend on the plate reader.
- Excitation: 485 nm, with 495 nm cut-off
- Emission: 520 nm
- Gain: 100
Incubate plate in the dark at room temperature.
Measure fluorescence every 15 min up to 120 min to determine the timepoint with the best signal to noise ratio. Ensure that the same parameters used in Step 16 for t = 0 are used here.
3.2.1.4. Data analysis
Analyze the matrix to assess which RNase L and 2′–5′A4 concentrations yield the greatest signal to noise ratio between the samples with and without 2′–5′A4. The goal is to find a concentration of RNase L at which there is minimal background cleavage (i.e., no or minimal (<10%) signal increase over time from the wells containing RNA and RNase L but lacking 2′–5′A4), but enough RNase L to induce cleavage of the model RNA upon addition of 2′–5′A4. We typically observe that the optimal concentration of RNase L is between 5 and 15 nM.
- Normalize data to the wells containing RNA and RNase L (vehicle) but lacking 2′–5′A4, at the chosen timepoint as shown in Equation 3. This controls for any background cleavage present.
(3)
3.2.1.5. Troubleshooting
The concentration of RNase L must be chosen very carefully. The increase in fluorescence in the absence of activator must not exceed 10% as compared to or it will mask the activation by the small molecule. As noted above, RNase L can self-dimerize and self-activate at concentrations around 100 nM (Han et al., 2012).
-
FAM fluorescence intensity is dependent on pH. Therefore, it is important to ensure that the pH of all buffers and components are ~7.5.
Dissolving ATP, if not the sodium salt, yields an acidic pH. Be sure to adjust the pH to 7.5.
High concentrations of DMSO may affect RNA structure. Final DMSO percentage should be kept to ≤1% (v/v).
This assay can be adapted to validate RiboTAC target engagement and RNase L activation by appending the FAM and BHQ dyes to the 5′ and 3′ ends of a target RNA, respectively.
3.2.1.6. Procedure
In vitro RNA cleavage assay to assess small molecule activators of RNase L
- Fold model RNA in 1× RNase L Assay Buffer by heating at 95 °C for 1 min, followed by snap cooling on ice for 10 min.
- Fold enough RNA to accommodate all samples, 33 μL per sample. The final concentration of the RNA in the assay is 100 nM.
While RNA is cooling, prepare 50× stock solutions (5 μL is sufficient for 7 replicates, we recommend completing the assay in triplicate) of compound in 50% (v/v) DMSO.
- After the RNA is folded, add the following reagents:
- β-mercaptoethanol to a final concentration of 7 mM
- ATP to a final concentration of 50 μM
- MgCl2 to a final concentration of 1 mM
Aliquot 29.4 μL of RNA solution into the appropriate number of tubes for the number of samples being tested.
- Add 0.6 μL of 55× compound solutions prepared in Step 2 to the RNA aliquots prepared in Step 4.
- Note: A good positive control is 2′–5′A4, informed by the matrix above.
Incubate solutions for 15 min at room temperature.
Add 3 μL active RNase L (concentration with minimal background cleavage determined from matrix assay in the previous section). Total sample volume should now be 33 μL.
Pipette thoroughly to mix samples. Immediately transfer 10 μL into triplicate wells of a 384-well plate.
Cover plate with adhesive seal.
Centrifuge the plate briefly (1100g, 1 min).
- Remove the seal and record fluorescence to obtain a t = 0 measurement. We use the following parameters when measuring fluorescence with a Tecan Infinite M1000 Pro, but these parameters will depend on the plate reader.
- Excitation: 485 nm, with 495 nm cut-off
- Emission: 520 nm
- Gain: 100
Incubate plate in the dark at room temperature for the length of time that gives best signal to noise ratio, as determined previously, usually ~1 h.
Measure fluorescence using the same parameters as in Step 11.
Note: The percent increase observed by small molecule activation of RNase L is typically about 20% of that observed for 2′–5′A4.
3.2.1.7. Data analysis
Activation of RNase L can be assessed by comparing the relative fluorescence units (RFU) for samples with compounds versus the vehicle-treated sample. If RNase L was activated and cleaved the model RNA, the RFUs will dose-dependently increase with compound concentration (Fig. 6C). If RNase L was not activated, no change in RFUs, compared to the vehicle, will be observed. Data can be reported either as RFUs or as percent increase in fluorescence relative to the initial time point, as shown in Eq. (4):
If desired, the data can be further normalized to vehicle, particularly if background cleavage is observed. Here, the percent increase in fluorescence observed in the vehicle at a particular time point can be subtracted from the percent increase in fluorescence observed at the same time point for a small molecule activator of interest.
3.2.1.8. Helpful tips and troubleshooting
Please refer to the Troubleshooting tips described for “Matrix Assay for Optimization of RNase L Concentration”, particularly those directed at selection of RNase L concentration and background cleavage.
Intrinsic fluorescence of compounds can interfere with the assay read-out. Check compounds for interference before beginning the experiment.
- Always run the following controls to determine whether a compound interferes with assay read-out:
- RNA alone
- RNase L alone
- Compound alone
- RNA + RNase L
- RNA + compound
- RNase L + compound
This assay can be adapted to validate RiboTAC target engagement and RNase L activation by appending the FAM and BHQ dyes to the 5′ and 3′ ends of a target RNA construct, respectively.
3.2.2. Mapping the RNA cleavage site using radioactively labeled RNA
While the in vitro RNA cleavage assay described in Section 3.2.1 measures RNase L-induced RNA cleavage, it gives no information regarding the RNA cleavage site in a RiboTAC-targeted RNA. The following gel electrophoresis assay allows the cleavage site to be mapped to a precise nucleotide within the target RNA sequence. Fig. 7 shows mock data for a successful cleavage site mapping experiment.
Fig. 7.

Representative gel analysis for RNA cleavage site mapping. The hydrolysis ladder affords a band for each nucleotide in the RNA construct while RNase T1 cleavage identifies guanosine residues. Incubation of RNase L and the target RNA with increasing concentrations of the RiboTAC results in a cleaved product corresponding to the site of cleavage, the intensity of which increases as a function of RiboTAC concentration. Non-specific hydrolysis/degradation of the RNA is common but will not change as a function of RiboTAC concentration. Created with BioRender.com.
3.2.2.1. Equipment
Gel electrophoresis chamber for long PA gels (39 cm in length)
Storage phosphor screen
Phosphorimager
3.2.2.2. Reagents
•RiboTAC target RNA
[γ-32P] ATP
10× T4 Polynucleotide Kinase Buffer
T4 Polynucleotide Kinase, 10,000 U/mL
NaCl solution (0.3 M)
Glycogen, RNA-Grade
1× RNase L Assay Buffer (50 mM Tris–HCl, pH 7.4, 100 mM NaCl)
700 mM β-mercaptoethanol (prepared fresh)
5 mM ATP, pH 7.4
100 mM MgCl2
Active RNase L
22× RiboTAC stocks [prepared in 50% (v/v) DMSO]
2× Loading Buffer (8 M urea, 20 mM disodium EDTA dihydrate, 2 mM Tris-Base, pH 8, 0.5 mg/mL bromophenol blue, 0.5 mg/mL xylene cyanole)
1× Alkaline Hydrolysis Buffer (50 mM NaHCO3, pH 9.2, and 1 mM EDTA)
1× T1 Buffer (7 M urea, 20 mM sodium citrate, pH 5 and 1 mM EDTA)
RNase T1
3.2.2.3. Procedure
Radiolabel and purify the RNA as described in Section 3.1.4.
- Fold radiolabeled RNA in 1× RNase L Assay Buffer by heating at 95 °C for 1 min, followed by snap cooling on ice for 10 min
- Each sample should have ~20,000 cpm.
While the RNA is cooling, prepare 22× stock solutions of RiboTACs in 50% (v/v) DMSO.
- After the RNA is folded,add the following reagents to the tube containing the RNA:
- β-mercaptoethanol to a final concentration of 7 mM
- ATP to a final concentration of 50 μM
- MgCl2 to a final concentration of 1 mM
Aliquot 9.4 μL of RNA solution into the appropriate number of tubes for the number of samples being tested.
- Add 0.5 μL of 22× RiboTAC solutions prepared in Step 3 to the RNA aliquots prepared in Step 5. Typical RiboTAC concentrations in this assay range from 0 μ to 50 μM, depending on RiboTAC solubility.
-
aNote: Include samples in which no compound is added. Other important controls include the RNA-binding module from which the RiboTAC is derived and the RNase L activating molecule alone (the other component of the RiboTAC).
-
a
Incubate samples for 15 min at room temperature.
- Add 1.1 μL of 150 nM active RNase L to each sample (15 nM final concentration; adjust as appropriate based on the outcome of the matrix assay described in “Matrix Assay for Optimization of RNase L Concentration”).
-
bNote: Include samples in which no RNase L is added.
-
b
Incubate samples for 1 h at room temperature.
Add 11 μL of 2× Loading Buffer to stop the reaction.
- During the incubation in Step 9, generate hydrolysis and T1 ladders:
- Hydrolysis Ladder (cleaves after every nucleotide)
- Add 20,000 cpm of radiolabeled RNA to 11 μL of 1× Alkaline Hydrolysis Buffer and heat at 95 °C for 3 min
- Add 11 μL of 2× Loading Buffer and immediately place on ice to stop the reaction.
- T1 Ladder (cleaves after G residues)
- Add 20,000 cpm of radiolabeled RNA to 11 μL of 1× T1 Buffer and 1 μL of T1 enzyme.
- Incubate for 30 min at room temperature.
- Add 11 μL of 2× Loading Buffer and immediately place on ice to stop the reaction.
- Resolve the RNA fragments generated by cleavage on a denaturing polyacrylamide gel of the appropriate percentage based on the RNA’s length using the following parameters:
- 70 W for ~2 h (such that individual nucleotides can be resolved)
Wrap gel in plastic wrap.
Expose a phosphor screen to the gel overnight at 4 °C.
Image with a phosphorimager.
3.2.2.4. Data analysis
The site of RNase L-induced cleavage will appear as a band that dose-dependently increases in intensity as a function of RiboTAC concentration. If a dose-dependent change is not observed the band is likely due to spontaneous hydrolysis or background RNase L cleavage.
-
Quantify the amount of position of RNA cleavage should be using image analysis software.
% RNA cleavage should be calculated by comparing the radioactive signal from each band to the total radioactive signal for that lane, as in Eq. (5)
3.2.2.5. Helpful tips
If the signal is too weak to visualize by phosphorimaing, increase the cpms of the radiolabeled RNA per sample.
The RNase L concentration and incubation time may need to be optimized depending on the activity of the RNase L. (Less active RNase L will require longer incubation times).
3.2.3. RNase L oligomerization as assessed by Western blot
While the in vitro RNA cleavage assays may suggest RNase L is being activated, which natively requires dimerization, it is important to directly assess RNase L dimerization experimentally. By using a cross-linking reagent to capture dimerized or oligomerized RNase L, these complexes can be visualized by Western blotting (Dong and Silverman, 1995, Thakur et al., 2007). Crosslinking enables the cross-linked dimeric complexes to be separated by SDS-PAGE followed by Western blotting (Fig. 8).
Fig. 8.

Assessing RNase L dimerization by Western blotting. (A) Diagram outlining the procedure for RNase L dimerization, as assessed by Western blotting. RNase L is incubated with a ligand to induce dimerization (either 2′–5′A4, small molecule, or a RiboTAC). Dimethyl suberimidate is added to the solution, which covalently cross-links the RNase L dimers via their exposed lysine residues. (B) After crosslinking with dimethyl suberimidate, monomeric and cross-linked RNase L is separated by SDS-PAGE and then quantified by Western blotting. A representative blot with relevant controls is shown. Schematics were created with BioRender.com.
3.2.3.1. Equipment
Vertical gel electrophoresis chamber
Gel-to-membrane protein transfer chamber
Western blot imager
3.2.3.2. Reagents
1× Assay Buffer (50 mM HEPES, pH 7.4, 70 mM NaCl, 2 mM MgCl2)
700 mM β-mercaptoethanol (prepared fresh)
5 mM ATP, pH 7.4
Dimethyl suberimidate dihydrochloride
0.4 M triethanolamine solution, pH 8.5
Active RNase L
25× RiboTAC stocks [prepared in 50% (v/v) DMSO]
5× Laemmli Buffer [312.5 mM Tris–HCl, pH 6.8, 10% (w/v) SDS, 25% (w/v) glycerol, 0.5% (w/v) bromophenol blue, 10% (v/v) β-mercaptoethanol]
SDS-PAGE Protein Ladder
1× Running Buffer [25 mM Tris-Base, pH 8.3, 192 mM glycine, 0.1% (w/v) SDS]
1× Transfer Buffer [25 mM Tris-Base, pH 8.3, 192 mM glycine, 20% (v/v) methanol]
PVDF 0.45 μm blotting membrane
1× TBST Buffer [20 mM Tris-Base, pH 7.6, 150 mM NaCl, 0.1% (w/v) Tween-20]
Anti-RNase L primary antibody (Cell Signaling Technology, D4B4J)
Anti-rabbit IgG secondary antibody linked to horseradish peroxidase (HRP)
SuperSignal West Pico Plus Chemiluminescent Substrate (Pierce Biotechnology, 34578)
3.2.3.3. Procedure
- Add β-mercaptoethanol and ATP to final concentrations of 7 mM and 50 μM, respectively, to the 1× Assay Buffer.
- The volume required for each sample is 25 μL.
Aliquot 18 μL buffer prepared in Step 1 into each sample tube.
- Add inactive RNase L to each sample to a final concentration of ~400 nM.
-
aNote: The crosslinking efficiency of dimethyl suberimidate dihydrochloride with RNase L is low. To circumvent this problem, 400 nM of RNase L is used, even though it is within the self-dimerization range of RNase L. It is rare to observe crosslinked dimers in vehicle-treated samples, however, if a faint band is observed the remaining samples can be normalized tovehicle-treated samples.
-
a
- Add 1 μL of 25× RiboTAC stocks to each aliquot.
-
bNote: Also include 2′–5′A4 as a positive control and RNase L alone as a negative control.
-
b
Incubate samples for 15 min at room temperature.
Prepare a 12 mg/mL solution of dimethyl suberimidate dihydrochloride in 0.4 M triethanolamine, pH 8.5.
Add 1 μL of the solution prepared in step 6 to each sample.
Incubate for 90 min at room temperature.
Quench cross-linking reaction by adding 5 μL of 5× Laemmli Buffer to each sample.
Heat samples at 95 °C for 5 min
Resolve cross-linked complexes by SDS-PAGE with 5% (w/v) polyacrylamide stacking layer; 8% (w/v) polyacrylamide resolving layer. Typical volatages and run times are 150 V. and ~90 min. Monitor by observing migration of the protein ladder.
- Transfer proteinto PVDF membrane in 1× Transfer Buffe using a voltage of 100 V. Typical transfer times are ~1 h.
-
cNote: Activate PVDF membrane with methanol before setting up the transfer.
-
c
Wash membrane in 1× TBST Buffer for 5 min
Block the membrane in 5% (w/v) milk in 1× TBST Buffer for 30 min
Incubate the membrane with anti-RNase L primary antibody (diluted 1:2000) in 5% (w/v) milk (w/v) in 1× TBST Buffer overnight at 4 °C.
Wash membrane in 1× TBST Buffer for 10 min
Repeat Step 16 for a total of three washes.
Incubate membrane with anti-rabbit IgG secondary antibody linked to HRP (diluted 1:4000) in 1× TBST Buffer containing 5% (w/v) milk for 1 h at room temperature.
Wash membrane in 1× TBST Buffer for 10 min
Repeat step 19 for a total of three washes.
Incubate membrane in SuperSignal West Pico Plus Chemiluminescent Substrate for 10 min, protected from light.
Image chemiluminescent signal using a Western Blot imager.
3.2.3.4. Data analysis
Percent dimerization or oligomerization should be assessed as the intensity of the dimeric band and oligomeric bands (see Section 3.2.3.5) relative to the total RNase L signal.
| (6) |
3.2.3.5. Troubleshooting
Higher order oligomers of RNase L are sometimes observed in cross-linking experiments. If RNase L dimers do not comprise the major species observed upon cross-linking, consider reducing the time of the cross-linking reaction, the concentration of the cross-linking reagent, or the concentration of RNase L. High molecular weight complexes (oligomers) do not resolve well by SDS-PAGE and may lead to unreliable quantification.
4. Cellular assays to assess targeted RNA degradation
Here we describe biological assays used to support the mode of action by which RiboTACs recruit RNase L to degrade the target transcript in live cells, including co-immunoprecipitation, siRNA knockdown of RNase L, and CRISPR knockdown of RNase L. These validation experiments should be completed after establishing dose-dependent reduction of the RNA target by real-time quantitative polymerase chain reaction (RT-qPCR; Fig. 9A). If the target is an mRNA, dose-dependent reduction of the encoded protein should also be established, whether by Western blotting, enzyme-linked immunosorbent assay (ELISA), or other complementary method. The first assay, co-immunoprecipitation, utilizes an anti-RNase L antibody to pull-down the target RNA in the presence of a RiboTAC molecule, similar to the in vitro co-immunoprecipitation described in Section 3.1.4. The co-immunoprecipitation experiment can provide evidence of interactions amongst the three components required for targeted degradation: RNase L, target RNA, and the RiboTAC. The latter two assays use either siRNA or CRISPR to knock down the expression of RNase L in cells as a loss-of-function experiment. If the RiboTAC indeed recruits RNase L to degrade the target transcript, an ablation of target degradation is expected when RNase L levels are knocked down (Fig. 9B). Collectively, these two assays provide evidence supporting the RNase L dependency of the observed target degradation.
Fig. 9.

Mock data demonstrating an ideal siRNA knockdown experiment to demonstrate RNase L-dependent targeted RNA degradation. (A) Dose-dependent reduction of the target RNA induced by a RiboTAC, as determined by RT-qPCR. (B) Left, Addition of an RNase L-targeting siRNA should reduce RNase L expression in both vehicle- and RiboTAC-treated samples relative to a Ctrl siRNA. Right, only cells treated with both the RiboTAC and Ctrl siRNA should show decreased levels of the target RNA. Cells treated with both the RiboTAC and RNase L-targeting siRNA should show little to no decrease, relative to vehicle-treated samples.
4.1. General equipment
Sterile tissue culture hoods and incubators suitable for maintaining the cell lines of interest
Sterile tissue culture supplies including conical vials, filtered pipette tips, tissue culture dishes and plates
Centrifuge
Magnetic rack compatible with Dynabeads
RNase-free microcentrifuge tubes and pipette tips
Thermocycler
Real-time qPCR thermocycler
NanoDrop UV-Vis spectrophotomer
4.2. Co-immunoprecipitation of target RNA by RiboTAC and anti-RNase L antibodies
4.2.1. Reagents
M-PER Mammalian Protein Extraction Reagent (Thermo Fisher; 78501)
Mammalian Protease Inhibitor Cocktail Set
Primary anti-RNase L antibody (Cell Signaling Technology, D4B4J)
Primary anti-β-actin antibody
Dynabeads Protein A (Thermo Fisher; 10001D)
1× Dulbecco’s phosphate-buffered saline (DPBS), pH 7.4
4.2.2. Procedure
Seed cells into 6-well plates such that they reach ~50% confluency after overnight incubation.
Once the cells reach ~50% confluency, remove the growth medium and replace with fresh medium containing the RiboTAC (typically 1–10 μM).
Treat the cells, typically for 48 h.
Remove the medium and wash with 1× DPBS.
Lyse the cells by adding 0.1 mL of M-PER Mammalian Protein Extraction Reagent supplemented with a mammalian protease inhibitor cocktail per the manufacturer’s protocol. Centrifuge at 13,000g for 15 min at 4 °C, and collect the supernatant.
- Incubate the supernatant with Dynabeads Protein A that are bound to either primary anti-RNase L antibody or primary anti-β-actin antibody (1:500 dilution) per the manufacturer’s protocol at 4 °C for 12 h.
- Note: Save a portion of the beads to verify antibody conjugation to the beads.
Wash the beads with 1× DPBS supplemented with 0.02% (v/v) Tween-20 (DPBST) three times.
Isolate the RNA associated with the beads by using a Zymo Research Quick RNA Mini Prep Kit (or similar kit) per the manufacturer’s protocol. Add the RNA Lysis Buffer directly to the beads (300 μL per sample) and load the mixture to the column, and then proceed in the same manner as the manufacturer’s protocol.
Quantify the amount and quality of RNA isolated by UV-Vis absorbance using a NanoDrop UV-Vis spectrophotometer.
Reverse transcribe approximately 200–600 ng of total RNA using an appropriate kit, for example a qScript cDNA Synthesis Kit (QuantaBio), per the manufacturer’s recommended protocol.
Complete qPCR amplification using commercially available Taqman Real-Time PCR Assays (Thermo Fisher) per the manufacturer’s recommended protocol or by using Power SYBR Green Master Mix (Life Technologies) and appropriate primers.
Note: qPCR primers should be validated by performing amplification with different cDNA input amounts (n = 5 with 2-fold dilutions) to perform linear regression analysis of Ct as a function of cDNA dilution (R2 should be>0.9 and slope>0.9). A no template control (no cDNA) and no RT control (total RNA that did not undergo reverse transcription as input in the qPCR reaction) should also be included, where the Ct values should be undetermined under qPCR assay conditions.
4.2.3. Data analysis
- All samples are normalized relative to a housekeeping gene (GAPDH or 18S for mRNAs and pre-microRNAs; U6 for microRNAs) by using the ΔΔCt method, as previously reported (Livak & Schmittgen, 2001). Specifically, the ΔCt value for each sample was calculated by using Eq. (7), followed by the calculation of ΔΔCt by Eq. (8). Fold enrichment is calculated by using Eq. (9).
(7) (8) (9)
4.2.4. Troubleshooting
To verify that the antibody successfully bound to the Dynabeads in Step 6, an aliquot of the sample can be incubated with secondary HRP conjugated antibodies at 1:2000 dilution at room temperature for 1 h, followed by washing as described in Step 7. The chemiluminescence signal can then be measured by using the SuperSignal West Pico PLUS Chemiluminescent Substrate (Thermo Fisher) per manufacturer’s instructions. A minimum three-fold signal above background is required.
The immunoprecipitation experiment can also be completed as a competition assay with the binding compound from which the RiboTAC is derived. Increasing concentrations of the binding compound should reduce the amount of RNA target immunoprecipitated by RNase L.
4.3. RNase L knockdown using siRNA
4.3.1. Reagents
RNase l-targeting siRNA-1 (Santa Cruz Biotechnology, sc-45965) or RNase l-targeting siRNA-2 (GE HeaIthcare Dharmacon, Inc., SMARTpool: ON-TARGETplus RNASEL siRNA)
Control siRNA-1 (Santa Cruz Biotechnology, sc-37007)
Control siRNA-2 (GE Healthcare Dharmacon, Inc., ON-TARGETplus Non-targeting siRNA)
Lipofectamine RNAiMAX reagent (Invitrogen, 13778150)
RNA Mini Prep Kit
TaqMan MicroRNA Reverse Transcription Kit (Applied Biosystems, 4366596)
qScript cDNA Synthesis Kit (QuantaBio, 95047–500)
High Capacity RNA-to-cDNA Kit (Applied Biosystems, 4387406)
RNase L antibody (1:5000 dilution; Cell Signaling Technology, D4B4J)
Power SYBR Green Master Mix (Life Technologies, 4367659)
TaqMan Fast Advanced Master Mix (Life Technologies 4444557)
- Target-appropriate primers for RT-qPCR
- Either purchased TaqMan primers (use TaqMan Fast Advanced Master Mix for RT-qPCR)
- Or designed primers (use Power SYBR Green Master Mix for RT-qPCR)
- RNase L Fwd: GCTCATTTGTACTGCGTTATGC
- RNase L Rev: CATTTTCTCAAGGAAAAGGC
384-well PCR system
4.3.2. Procedure
- Seed cells and culture at 37 °C with 5% CO2.
- As an example, for an experiment in which MDA-MB-231 cells are treated for 48 h, each well of a 6-well plate is seeded with 0.3 million cells per well (affording a confluency of ~30%). However, seeding density will vary depending on the cell type, length of experiment, and size of the plate used.
Transfect cells with either the control or RNase L-targeting siRNA at a concentration ranging from 40 nM to 100 nM using Lipofectamine RNAiMAX reagent, per the manufacturer’s protocol.
Incubate cells between 2 and 5 h to reach efficient transfection of the siRNA.
Treat cells with RiboTAC compounds, preferably in dose-response, for typically 24–48 h.
After treatment, extract total RNA and purify the RNA using a Zymo Quick RNA Mini Prep Kit (or similar kit) per the manufacturer’s protocol.
Use approximately 200 ng of total RNA in subsequent reverse transcription reactions, performed using TaqMan MicroRNA Reverse Transcription Kit (Applied Biosystems) for microRNA evaluation or using a qScript cDNA Synthesis Kit (QuantaBio) or High-Capacity RNA-to-cDNA Kit (Applied Biosystems) for mRNA evaluation.
A 384-well PCR system can be used to complete qPCR experiments with Power SYBR Green Master Mix (Life Technologies) or TaqMan Fast Advanced Master Mix.
4.3.3. Data analysis
All samples are normalized relative to a housekeeping gene (GAPDH or 18S for mRNAs and pre-microRNAs; U6 for microRNAs) by using the ΔΔCt method, as previously reported (Livak & Schmittgen, 2001). Specifically, the ΔCt value for each sample was calculated by using Eq. (7), followed by the calculation of ΔΔCt by Eq. (8).
- Compare the relative abundance of samples treated with control siRNA to samples treated with RNase L-targeting siRNA.
- To confirm involvement of RNase L in cleavage of the target RNA, cells treated with the RNase L-targeting siRNA should show a significant increase in the abundance of the RNA target compared to cells treated with the control siRNA.
Notably, the abundance of the target RNA should be similar in untreated cells and in cells treated with the RNase L-targeting siRNA. Further, the RiboTAC’s activity should be similar in cells without transfection of any siRNA and in cells transfected with a control siRNA.
4.3.4. Troubleshooting
To validate that RNase L is properly knocked down using the RNase L-targeting siRNA, RNase L expression is measured in two different assays. First, RNase L mRNA abundance is measured by RT-qPCR and normalized to a housekeeping gene as mentioned above. RNase L abundance in cells treated with the RNase L siRNA should be significantly reduced compared to cells treated with the control siRNA. RNase L protein expression is also measured using Western blotting where abundance should be significantly reduced.
4.4. RiboTAC assessment in cells using CRISPR RNase L knockdown
4.4.1. Reagents
- Cell lines CRISPR-modified will the following guide (g)RNAs (Transomic Technologies):
- Control targeting sequence of gRNA: GGAGCGCACCAUCUUCUUCA
- Vector: pCLIP-All-hCMV-Puro
- Cells express wild-type RNase L abundance
- RNase L-Targeting sequence of gRNA: AUUUGUACUGCGUUAUGCAG
- Vector: pCLIP-All-hCMV-Puro
- Cells express reduced RNase L abundance
1000× RiboTAC stocks (DMSO)
6-well tissue culture plates
RNA Mini Prep Kit
TaqMan MicroRNA Reverse Transcription Kit (Applied Biosystems, 4366596)
qScript cDNA Synthesis Kit (QuantaBio, 95047–500)
High Capacity RNA-to-cDNA Kit (Applied Biosystems, 4387406)
RNase L antibody (1:5000 dilution; Cell Signaling Technology, D4B4J)
Power SYBR Green Master Mix (Life Technologies, 4367659)
TaqMan Fast Advanced Master Mix (Life Technologies 4444557)
- Target-appropriate primers for RT-qPCR
- Either purchased TaqMan primers (use TaqMan Fast Advanced Master Mix for RT-qPCR)
- Or designed primers (use Power SYBR Green Master Mix for RT-qPCR)
- RNase L Fwd: GCTCATTTGTACTGCGTTATGC
- RNase L Rev: CATTTTCTCAAGGAAAAGGC
384-well PCR system
4.4.2. Procedure
- Seed cells expressing both an RNase L-targeting CRISPR gRNA and a control CRISPR gRNA in 6-well plates and culture overnight at 37 °C with 5% CO2.
- Seeding density will vary depending on the cell type used.
Upon reaching ~30% confluency, remove medium and replace with fresh medium containing the RiboTAC of interest [0.1% (v/v) DMSO final concentration].
Incubate cells with compound in dose response for the appropriate length of time for the experiment (usually 24–48 h). Treatment length will depend on cell type and compound activity.
Remove medium and wash cells with 1× DPBS.
Harvest total RNA using a Zymo Quick RNA Mini Prep kit (or similar kit) per the manufacturer’s protocol.
Use approximately 200 ng of total RNA in subsequent reverse transcription reactions using TaqMan MicroRNA Reverse Transcription Kit (Applied Biosystems) for microRNAs or a qScript cDNA Synthesis Kit (QuantaBio) or High-Capacity RNA-to-cDNA Kit (Applied Biosystems) for mRNAs.
An Applied Biosystems QuantStudio5 384-well PCR system can be used to complete qPCR experiments with Power SYBR Green Master Mix (Life Technologies) or TaqMan Fast Advanced Master Mix.
4.4.3. Data analysis
All samples are normalized relative to a housekeeping gene (GAPDH or 18S for mRNAs and pre-microRNAs; U6 for microRNAs) by using the ΔΔCt method, as previous reported (Livak & Schmittgen, 2001) as indicated in (7), (8).
- Compare the relative RNA abundance between samples from cells expressing wild-type and reduced RNase L abundance.
- To confirm involvement of RNase L in cleavage of the target RNA, samples from control CRISPR gRNA expressing cells should show a significant reduction in the abundance of the RNA target compared to samples from cells expressing the RNase L-targeting CRISPR gRNA.
4.4.4. Troubleshooting
To validate that RNase L is properly knocked down in the CRISPR-modified cells, please see the Troubleshooting section for Section 4.3.
5. Conclusions
The methods contained herein enable the identification, development, and validation of small molecule RiboTACs. With these experiments, small molecules that bind and activate RNase L, induce a ternary complex, and selectively degrade target RNAs in cells can be identified. These methods have been tailored towards RNase L, as all RiboTACs utilized to date have recruited this enzyme. However, other ribonucleases may be recruited by future RiboTACs, which will necessitate adaptation of these methods toward the new effector protein.
References
- Andrews SS, & Tretton J (2020). Physical principles of circular dichroism. Journal of Chemical Education, 97(12), 4370–4376. [Google Scholar]
- Borgelt L, Haacke N, Lampe P, Qiu X, Gasper R, Schiller D, et al. (2022). Smallmolecule screening of ribonuclease L binders for RNA degradation. Biomedicine & Pharmacotherapy, 154, 113589. [DOI] [PubMed] [Google Scholar]
- Choi UY, Kang J-S, Hwang YS, & Kim Y-J (2015). Oligoadenylate synthase-like (OASL) proteins: Dual functions and associations with diseases. Experimental & Molecular Medicine, 47(3), e144. [DOI] [PMC free article] [PubMed] [Google Scholar]
- Costales MG, Aikawa H, Li Y, Childs-Disney J, Abegg D, Hoch DG, et al. (2020). Small-molecule targeted recruitment of a nuclease to cleave an oncogenic RNA in a mouse model of metastatic cancer. Proceedings of the National Academy of Sciences of the United States of America, 117(5), 2406–2411. [DOI] [PMC free article] [PubMed] [Google Scholar]
- Cutting B, Shelke SV, Dragic Z, Wagner B, Gathje H, Kelm S, et al. (2007). Sensitivity enhancement in saturation transfer difference (STD) experiments through optimized excitation schemes. Magnetic Resonance in Chemistry: MRC, 45, 720–724. [DOI] [PubMed] [Google Scholar]
- Daou S, Talukdar M, Tang J, Dong B, Banerjee S, Li Y, et al. (2020). A phenolic small molecule inhibitor of RNase L prevents cell death from ADAR1 deficiency. Proceedings of the National Academy of Sciences of the United States of America, 117(40), 24802–24812. [DOI] [PMC free article] [PubMed] [Google Scholar]
- Dong B, & Silverman RH (1995). 2–5A-dependent RNase molecules dimerize during activation by 2–5A. The Journal of Biological Chemistry, 270(8), 4133–4137. [DOI] [PubMed] [Google Scholar]
- Dong B, & Silverman RH (1997). A bipartite model of 2–5A-dependent RNase L. The Journal of Biological Chemistry, 272(35), 22236–22242. [DOI] [PubMed] [Google Scholar]
- Dong B, Xu L, Zhou A, Hassel BA, Lee X, Torrence PF, et al. (1994). Intrinsic molecular activities of the interferon-induced 2–5A-dependent RNase. The Journal of Biological Chemistry, 269(19), 14153–14158. [PubMed] [Google Scholar]
- Floyd-Smith G, Slattery E, & Lengyel P (1981). Interferon action: RNA cleavage pattern of a (2′-5′) oligoadenylate—Dependent endonuclease. Science, 212(4498), 1030–1032. Methods for the study of ribonuclease targeting chimeras (RiboTACs) 297 [DOI] [PubMed] [Google Scholar]
- Fredrik P, Nielsen J, Gunnar VH, Zwahlen M, Johansson F, Persson L, et al. (2015). Tissue-based map of the human proteome. Science (New York, N. Y.), 347(6220), 1260419. [DOI] [PubMed] [Google Scholar]
- Greenfield NJ (2006). Using circular dichroism spectra to estimate protein secondary structure. Nature Protocols, 1(6), 2876–2890. [DOI] [PMC free article] [PubMed] [Google Scholar]
- Gupta A, & Rath PC (2012). Expression, purification and characterization of the interferon-inducible, antiviral and tumour-suppressor protein, human RNase L. Journal of Biosciences, 37(1), 103–113. [DOI] [PubMed] [Google Scholar]
- Hall JL, Sohail A, Cabrita EJ, Macdonald C, Stockner T, Sitte HH, et al. (2020). Saturation transfer difference NMR on the integral trimeric membrane transport protein GltPh determines cooperative substrate binding. Scientific Reports, 10(1), 16483. [DOI] [PMC free article] [PubMed] [Google Scholar]
- Han Y, Donovan J, Rath S, Whitney G, Chitrakar A, & Korennykh A (2014). Structure of human RNase L reveals the basis for regulated RNA decay in the IFN response. Science, 343(6176), 1244–1248. [DOI] [PMC free article] [PubMed] [Google Scholar]
- Han Y, Whitney G, Donovan J, & Korennykh A (2012). Innate immune messenger 2–5A tethers human RNase L into active high-order complexes. Cell Reports, 2(4), 902–913. [DOI] [PubMed] [Google Scholar]
- Jha BK, Polyakova I, Kessler P, Dong B, Dickerman B, Sen GC, et al. (2011). Inhibition of RNase L and RNA-dependent protein kinase (PKR) by sunitinib impairs antiviral innate immunity. The Journal of Biological Chemistry, 286(30), 26319–26326. [DOI] [PMC free article] [PubMed] [Google Scholar]
- Krishna NR, & Jayalakshmi V (2008). Quantitative analysis of STD NMR spectra of reversibly forming ligand–receptor complexes. In Peters T (Ed.). Bioactive conformation II (pp. 15–54). Berlin Heidelberg: Springer. [DOI] [PubMed] [Google Scholar]
- Livak KJ, & Schmittgen TD (2001). Analysis of relative gene expression data using real-Time auantitative PCR and the 2-ΔΔCT method. Methods, 25(4), 402–408. [DOI] [PubMed] [Google Scholar]
- Malathi K, Paranjape JM, Bulanova E, Shim M, Guenther-Johnson JM, Faber PW, et al. (2005). A transcriptional signaling pathway in the IFN system mediated by 2′-5′-oligoadenylate activation of RNase L. Proceedings of the National Academy of Sciences of the United States of America, 102(41), 14533–14538. [DOI] [PMC free article] [PubMed] [Google Scholar]
- Mayer M, & Meyer B (1999). Characterization of ligand binding by saturation transfer difference NMR spectroscopy. Angewandte Chemie (International Ed. in English), 38(12), 1784–1788. [DOI] [PubMed] [Google Scholar]
- Meyer SM, Tanaka T, Zanon PRA, Baisden JT, Abegg D, Yang X, et al. (2022). DNA-encoded library screening to inform design of a ribonuclease targeting chimera (RiboTAC). Journal of the American Chemical Society, 144(46), 21096–21102. [DOI] [PMC free article] [PubMed] [Google Scholar]
- Miles AJ, Janes RW, & Wallace BA (2021). Tools and methods for circular dichroism spectroscopy of proteins: A tutorial review. Chemical Society Reviews, 50(15), 8400–8413. [DOI] [PMC free article] [PubMed] [Google Scholar]
- Monaco S, Tailford LE, Juge N, & Angulo J (2017). Differential epitope mapping by STD NMR spectroscopy to reveal the nature of protein-ligand contacts. Angewandte Chemie (International Ed. in English), 56(48), 15289–15293. [DOI] [PMC free article] [PubMed] [Google Scholar]
- Rebouillat D, & Hovanessian AG (1999). The human 2′,5′-oligoadenylate synthetase family: Interferon-induced proteins with unique enzymatic properties. Journal of Interferon & Cytokine Research, 19(4), 295–308. [DOI] [PubMed] [Google Scholar]
- Silverman RH (2007). A scientific journey through the 2–5A/RNase L system. Cytokine & Growth Factor Reviews, 18(5), 381–388. [DOI] [PMC free article] [PubMed] [Google Scholar]
- Thakur CS, Jha BK, Dong B, Das Gupta J, Silverman KM, Mao H, et al. (2007). Small-molecule activators of RNase L with broad-spectrum antiviral activity. Proceedings of the National Academy of Sciences of the United States of America, 104(23), 9585–9590. [DOI] [PMC free article] [PubMed] [Google Scholar]
- Viegas A, Manso J, Nobrega FL, & Cabrita EJ (2011). Saturation-transfer difference (STD) NMR: A simple and fast method for ligand screening and characterization of protein binding. Journal of Chemical Education, 88(7), 990–994. [Google Scholar]
- Wreschner DH, McCauley JW, Skehel JJ, & Kerr IM (1981). Interferon action—Sequence specificity of the ppp (A2′ p)nA-dependent ribonuclease. Nature, 289(5796), 414–417. [DOI] [PubMed] [Google Scholar]