Abstract
The KHA1 gene corresponding to the open reading frame YJL094c (2.62 kb) encoding a putative K+/H+ antiporter (873 amino acids) in Saccharomyces cerevisiae was disrupted by homologous recombination. The core protein is similar to the putative Na+/H+ antiporters from Enterococcus hirae (NAPA gene) and Lactococcus lactis (LLUPP gene) and the putative K+/H+ exchanger from Escherichia coli (KEFC gene). Disruption of the KHA1 gene resulted in an increased K+ accumulation and net influx without a significant difference in efflux, as well as an increased growth rate, smaller cells, and twice the cell yield per glucose used. Flow cytometry analysis showed an increase of the DNA duplication rate in the mutant. Kinetic studies of 86Rb+ uptake showed the same saturable system for wild-type and disruptant strains. Mutant cells also produced a greater acidification of the medium coincident with an internal pH alkalinization and showed a higher oxygen consumption velocity. We speculate that higher K+ accumulation and increased osmotic pressure accelerate the cell cycle and metabolic activity.
Three distinct genes encoding putative Na+/H+ antiporters have been identified by the yeast genome sequencing project (7). One of these, NHA1, was recently cloned from a multicopy genomic library by selection for increased sodium tolerance (24). Disruption of NHA1 confers significant Na+ sensitivity in a strain lacking the PMR2 locus. A protein (NHX1) with homology to amiloride-sensitive Na+/H+ exchangers (NHE1 to NHE4) in animal cells (1) was encoded by the yeast gene YDR456w, is probably localized in the yeast vacuole, and is involved in sodium tolerance (20). A PMA1 mutant strain with NHX1 disrupted lost the ability to sequester sodium in the vacuole. A third yeast gene, YJL094c (18), exhibited homology to genes encoding putative Na+/H+ exchangers from Enterococcus hirae (28) and Lactococcus lactis (17) and a putative K+/H+ exchanger from Escherichia coli (19).
It is known from experiments with yeast membrane vesicles that there is a K+-Na+/H+ exchange system in the plasma membrane of yeast (4, 25). In the present work, we characterize the YJL094c gene and show that it probably encodes the putative K+/H+ antiporter; therefore, we have named it KHA1 (potassium/hydrogen ion antiporter 1). The KHA1 (YJL094c) gene may play a vital physiological role in the regulation of intracellular pH, in K+ accumulation, in cell volume control, and possibly in the activation of growth factors.
MATERIALS AND METHODS
Strains and mutant construction.
The wild-type strains used were W303-1A (MATa ade2-1 can1-100 his3-11,15 leu2-3,112 trp1-1 ura3-1) and R757 (MATα his4-15 lys9 ura3-52). An internal fragment of the YJL094c open reading frame (ORF) was obtained by PCR with two specific oligodeoxynucleotides. Oligodeoxynucleotide F (TTAGCCAGTCATGCTCAG) was derived from the 5′ sequence at position 396 in the KHA1 gene. Oligodeoxynucleotide R (CCTCCAAAGCAAGAATACAA) was derived from the 3′ sequence at position 1214 in the KHA1 gene. Total DNA from Saccharomyces cerevisiae W303-1A was used as a template for amplification by PCR, which was carried out in a Coy TempCycler II with the following program: one denaturing cycle for 10 min at 94°C, followed by 25 cycles of denaturation for 30 s at 94°C, annealing for 45 s at 55°C, and extension for 2 min at 72°C. An 818-nucleotide (nt) PCR product was obtained, gel purified, and ligated into the pCRII vector (Invitrogen). This subclone was sequenced by primer extension with a Sequenase V.2 kit (United States Biochemicals). An EcoRI fragment carrying the original PCR product was obtained from the pCRII clone and subcloned into Yip352 (10) digested with the same enzyme. The resulting plasmid was digested with BglII at the naturally occurring site in the KHA1 gene at position 809 to produce a linearized plasmid that carries fragments of 412 and 406 nt as recombinant ends. The linearized plasmid was then used to transfect strains W303-1A and R757. Potential mutant transformants were recognized by their altered growth on YPAD plates containing 1 M KCl or 1 M NaCl, at different pH values (4.0, 6.0, and 8.0).
Southern and Northern analysis.
The agarose gel containing BglII- and EcoRI-digested DNA from the wild-type strains and six independent kha1::URA3 mutants was denatured and transferred to a nylon membrane as described previously (26). The DNA blot was probed with the 818-nt PCR fragment labeled with [α-32P]dCTP. The same pattern was observed for the W303-1A and R757 mutants, clearly indicating that the construction had been inserted in the wild-type genomic sequence of KHA1.
Northern analysis was carried out as previously described by González et al. (8). Total yeast RNA of the wild-type and kha1::URA3 strains previously analyzed by Southern blotting was extracted from cells grown to the log phase (optical density at 600 nm [OD600], 0.6 to 1.0) in 200 ml of medium, as described by Struhl and Davis (27).
Growth, cell composition, and glucose metabolism.
YPAD medium contained 2% glucose, 1% peptone, 1% yeast extract, and 50 mg of adenine sulfate per liter. Growth took place at 30°C on a gyrotory shaker, and for most experiments the cells were collected near glucose exhaustion after 12 to 16 h. As specified, certain experiments were performed with starved cells (resuspension in water and 18 h of additional shaking). For cells in the exponential growth phase (see Table 1), a subculture was monitored from an initial OD600 of 0.02 with hourly sampling of OD, cell counts, wet weight, biomass, glucose consumption, ethanol production, and internal K+ content.
TABLE 1.
Characteristics of wild-type and kha1::URA3 strainsa
| Strain | Duplication time (h)b | Cell counts (106 cells)c | Wet wt (mg)c | Biomass (mg)c | Amt (mg/ml) of:
|
Cell size (μm) | Internal [K+] (mM) | Fermentation rate (μg of ethanol/min/mg) | Respiration rate (natg of O2/min/mg) | |
|---|---|---|---|---|---|---|---|---|---|---|
| Glucose consumed | Ethanol produced | |||||||||
| Wild type | 1.58 | 1.7 | 1.83 | 0.65 | 4.41 | 2.78 | 7.8 | 150 | 9.02 | 0.6 |
| kha1::URA3 | 1.38 | 2.15 | 2.1 | 0.98 | 15.54 | 7.47 | 6.47 | 295 | 11.31 | 1.6 |
For the determination of cell counts, wet weight, biomass, and cell size, cells were grown near glucose exhaustion (14 h). Ethanol production and glucose consumption were measured in the supernatant after harvesting the cells. For measurement of the internal K+ content, cells grown for 14 h were harvested by centrifugation and washed twice with distilled water and the K+ content was measured as described in Materials and Methods. For fermentation and respiration rates, cells grown for 14 h were starved and ethanol production and oxygen consumption were measured as described in Materials and Methods.
Duplication time was obtained by linear regression analysis from the semilogarithmic OD growth curves.
Per milligram of glucose used minus ethanol produced.
The cells were counted in a Neubauer cytometer. For biomass determination, centrifuged cells were disrupted with 1.0 ml of 10% trichloroacetic acid for 10 min at room temperature, washed twice with distilled water, and weighed. Ethanol production was measured spectrophotometrically during growth by monitoring the reduction of NAD+ by alcohol dehydrogenase (3), using the supernatant after centrifuging the cells (see below). The glucose remaining in the medium was measured by the reduction of NADP+ with ATP, hexokinase, and glucose-6-phosphate dehydrogenase (12).
To measure the internal K+ content, 100 mg of cells grown for 14 h was disrupted by incubation with 10 ml of 2 mM cetyltrimethylammonium bromide (CTAB) for 10 min at room temperature. The suspension was centrifuged, and the cation concentration in the supernatant was determined with a Zeiss PF5 flame photometer.
The fermentation rate was measured by monitoring ethanol production. Cells (50 mg [wet weight] of starved cells) were incubated for 10 min in 2 mM morpholineethanesulfonic acid–triethanolamine (MES-TEA) (pH 6)–50 mM glucose (final volume, 2 ml). After centrifugation and adequate dilution, the supernatant was used to measure ethanol as described above.
O2 consumption was measured by monitoring its concentration at 30°C with a Clark electrode in a closed thermostated chamber connected to an oxygen monitor and computer, by using a mixture containing 50 mg of starved cells in 3.0 ml of 2 mM tartrate-MES-TEA buffer (pH 6.0)–50 mM glucose.
Cell synchrony and flow cytometry.
The cells were synchronized as described by Heichman and Roberts (9). Logarithmically growing cells were incubated in the presence of 5 μg of α-factor per ml for 2 h at 25°C. Pronase E (10 μg/ml) was added, and the cells were released from α-factor arrest by being transferred to YPAD medium without additions and incubated for a further 6 h at 30°C.
Yeast cells were prepared for flow cytometry analysis by a modification of the procedure of Lew et al. (15). Cultures were fixed in 70% ethanol overnight at 4°C and digested with RNase A for 4 h at 37°C and then with pepsin for 1 h at 37°C. The cells were stained with 50 μg of propidium iodide per ml overnight at 4°C. The samples were diluted and sonicated for 15 s. Fluorescence was measured with a Becton Dickinson FACScan and analyzed using CELL-Quest software.
86Rb+ transport and K+ uptake in the medium.
86Rb+ transport was measured in whole cells, by adding 50 mg of starved cells (100 μl) to 900 μl of 2 mM MES-TEA buffer (pH 6.0)–50 mM glucose and incubating the mixture for 2 min. Then 86Rb+ was added to a concentration of 0.1, 0.2, 0.3, 0.4, 0.5, 1, 2, 3, 4, or 5 mM, and incubation was carried out for a further 2 min. Aliquots of 100 μl were taken, filtered through a cellulose nitrate filter (mean pore diameter, 0.45 μm; Millipore), and washed once with 10 ml of 100 mM KCl. The filters were dried and transferred to scintillation vials with 5 ml of a scintillation cocktail, and the radioactivity was measured in a liquid scintillation counter.
Potassium uptake was measured by continuously recording the extracellular concentration with a potassium selective electrode connected to an ion analyzer (Beckman SelectIon 2000) and computer, with a mixture containing 100 mg of cells in 10 ml of 2 mM tartrate-MES-TEA buffer (pH 6.0). The changes were calibrated by additions of 10 μM KCl.
External and internal pH.
Proton pumping was measured by monitoring the absorbance change of bromocresol purple (4 μg per ml) at 487 to 586 nm in a dual-wavelength spectrophotometer (DW2 Olis conversion), with a mixture containing 25 mg of starved cells in 2.0 ml of 2 mM tartrate-MES-TEA buffer (pH 6.0) plus 50 mM glucose. The changes were calibrated by additions of 100 mM HCl.
The internal pH was measured by monitoring the fluorescence changes of the starved cell suspensions after loading them with pyranine. Electroporation was performed as previously reported (23), with a Bio-Rad Gene Pulser with a pulse controller attachment. The cell suspension (0.7 ml, containing 350 mg [wet weight] of cells) plus 20 μl of 100 mM pyranine was placed in a cell with a 0.4-mm gap, and one pulse of 1.5 kV, 25 μF, and 200 Ω was applied, with a duration of about 3.0 ms. The cells were centrifuged and then washed three times with distilled water by centrifugation in a microcentrifuge for 10 s, resuspended in the original ratio (0.5 g of cells per ml of water), and used as described for the individual experiments. A modification to the initially reported procedure (23) was included (11): final alkalinization of the cells was achieved by the addition of 100 mM NH4OH instead of 100 mM Tris base.
Membrane potential.
The membrane potential was estimated as described previously (22) by monitoring the fluorescence changes of 3,3′-dipropylthiacarbocyanine [DiSC3(3); Molecular Probes] at 540 to 590 nm. The cyanine was added after incubation of the starved cells in 2 mM tartrate-MES-TEA (pH 4.0 or 6.0) plus 10 μM carbonyl cyanide m-chlorophenylhydrazone (CCCP), 100 μM CaCl2, and 50 mM glucose.
RESULTS AND DISCUSSION
Gene and disruption.
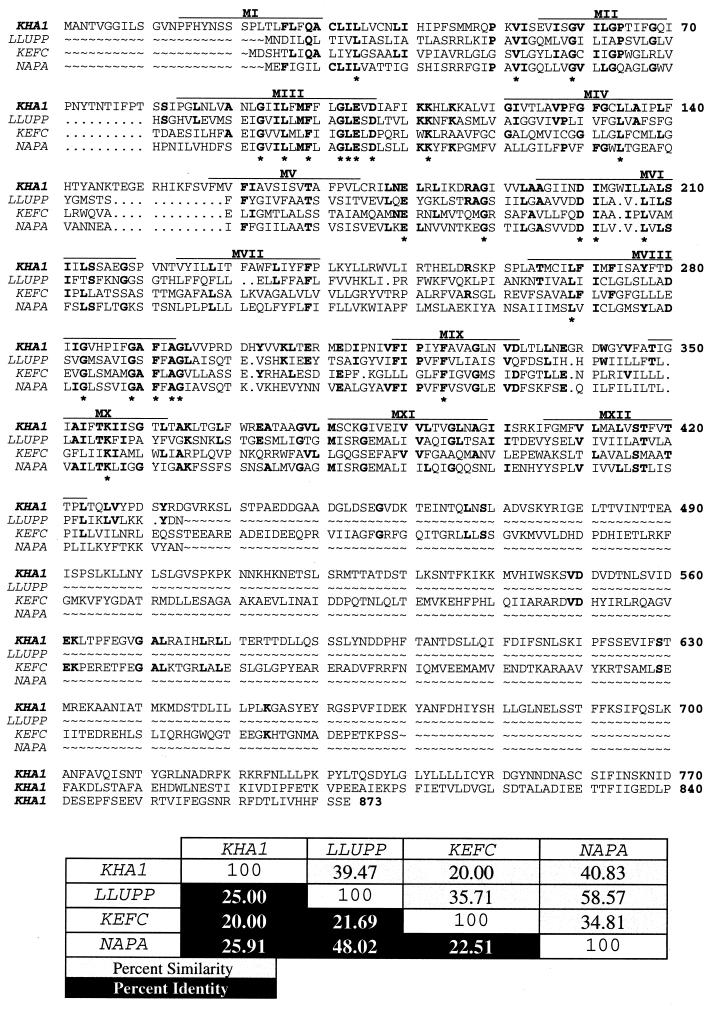
Figure 1 shows the deduced amino acid sequence for the YJL094c gene (18), here named KHA1, and comparison with three related genes. The KHA1 product would contain 873 amino acid residues and have a molecular weight of 97.1 kDa and an isoelectric point of 6.0. Its hydropathy profile, using a window of 19 amino acids and the algorithm of Kyte and Doolittle (13), showed 10 to 12 possible membrane-spanning domains.
FIG. 1.
Alignment of the protein sequences, percent similarity, and percent identity for S. cerevisiae K+/H+ KHA1, L. lactis Na+/H+ LLUPP, E. coli K+/H+ KEFC, and E. hirae Na+/H+ NAPA. Amino acid residues identical in all four proteins are indicated by asterisks, amino acid residues identical in two or three proteins are indicated in bold, and putative transmembrane domains are indicated by an overline. Solid boxes indicate percent identity, and shaded boxes indicate percent similarity.
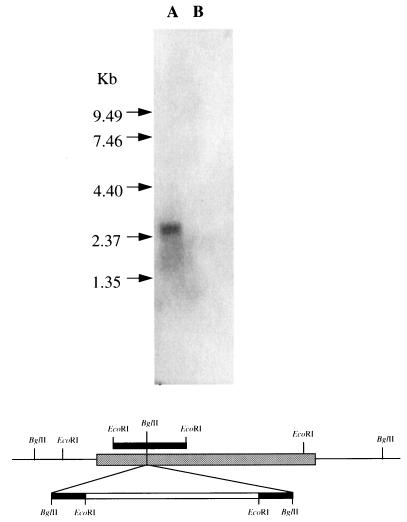
As described in Materials and Methods, an internal fragment of KHA1 was obtained by PCR and cloned into Yip352 (URA3). After linearization at its BglII site the plasmid was transformed into wild-type strains W303-1A and R757 with selection for uracil prototrophy. The mutant phenotype was recognized by its fast growth and large colonies on plates of high pH and/or salt concentration. Chromosomal DNA was isolated from six nominal kha1::URA3 mutants in each genetic background, and the disruption was confirmed by Southern analysis (results not shown). The analyses which follow were done with one of the W303-1A mutants. KHA1 mRNA was found in the parental strain, showing that the gene was expressed, and was not detected in the mutants (Fig. 2).
FIG. 2.
Northern blot of total RNA obtained from the wild-type (lane A) and kha1::URA3 (lane B) strains, and schematic representation of the 2.62-kb fragment carrying the KHA1 ORF. Arrows correspond to a 0.4- to 9.4-kb RNA ladder from GIBCO BRL. The solid box indicates the PCR fragment; the shaded box indicates the complete KHA1 ORF; and the open box indicates the Yip352 plasmid. The RNA filter was probed with the 32P-labeled PCR fragment.
Growth and metabolism.
As implied by obtaining the mutants in haploid strains on normal YNB medium with glucose, kha1 disruption is not lethal. As shown in Table 1, the mutant strain is altered in several characteristics. The doubling time in normal YPAD medium was a little shorter in the mutant than the parental strain, and its yield of cells, expressed as cell number, wet weight, or biomass, appeared to be considerably higher during the whole growth curve. The cells in the exponential phase were a little smaller, ethanol production was 2.6 times higher, the fermentation rate was elevated by 25%, and the respiration rate was threefold higher. Most strikingly, considering the proposed role of YJL094c in K+ metabolism, the mutant contained twice the concentration of K+ as the wild type, and this difference was observed throughout the growth curve. The external pH changes over the growth period (pH 6.0 initially and pH 5.0 at ca. 12 h) were similar in the mutant and wild type.
Flow cytometry analysis was also performed. Cells synchronized in the G1 phase with α-factor contained a uniform 1C DNA content (results not shown); 6 h after release with pronase, the wild type contained similar 1C and 2C populations while the mutant was largely 2C, an indication of more rapid DNA replication in the mutant.
Potassium ion movements.
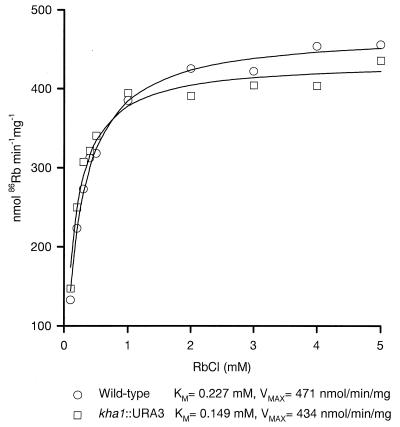
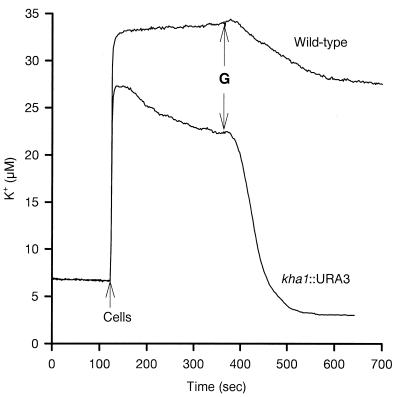
K+ uptake (as assessed with 86Rb+) could be described as a single saturable system with similar Vmax and Km in the mutant and wild type (Fig. 3). External K+ movement is shown in Fig. 4: addition of cells to a K+-free medium resulted in a K+ efflux which was slightly greater in the wild type than in the mutant; reuptake upon glucose addition was slow and partial in the wild type but rapid and complete in the mutant.
FIG. 3.
Kinetics of 86Rb transport in disruptant and wild-type strains. The cells (50 mg [wet weight]) were preincubated for 2 min in 2 mM MES-TEA (pH 6)–50 mM glucose. After preincubation, variable concentrations of 86Rb were added, to measure its transport with an incubation time of 2 min, as described in Materials and Methods. The most probable lines and Km and Vmax values were obtained by the nonlinear regression method.
FIG. 4.
Changes of the potassium concentration in the cell suspensions. K+ changes were monitored with a selective K+ electrode in a mixture containing 50 mg of cells and 2 mM tartrate-MES-TEA buffer (pH 6.0) in a final volume of 10.0 ml at 30°C. The tracing started at 2 min with the addition of cells, and 50 mM glucose (G) was added at 6 min, as indicated. The changes were calibrated by additions of 10 μM KCl.
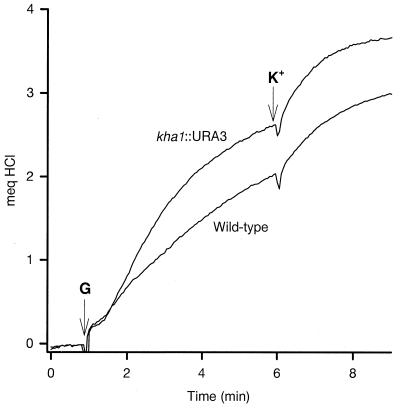
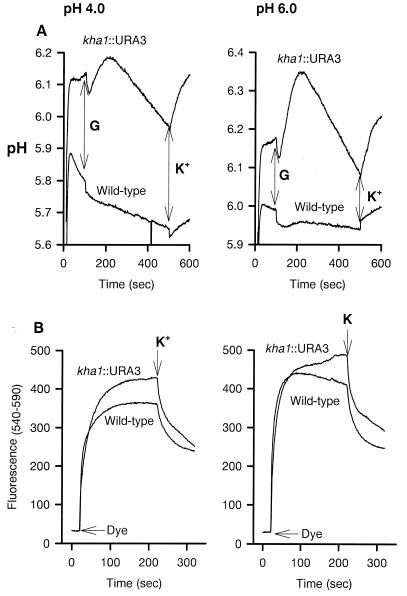
The external pH change is shown in Fig. 5. As previously determined (5), glucose metabolism and the activity of the H+-ATPase (21) cause external acidification in the wild type, and the effect was somewhat sharper in the mutant. Internal pH and membrane potential determinations are shown in Fig. 6. The internal pH was higher in the mutant than in the wild type; this difference was observed both before and after glucose addition, although the perturbations caused by glucose addition were quite different in the two strains. Membrane potential, as measured by fluorescence of DiSC3(3), was higher in the mutant than in the wild type (inside negative) and was decreased by the addition of external potassium in both strains.
FIG. 5.
Changes of the pH of cell suspensions. pH changes were monitored by the absorbance changes of 8 μg of bromcresol purple at 487 to 586 nm in a mixture containing 25 mg of cells and 2 mM tartrate-MES-TEA buffer (pH 6.0) in a final volume of 2.0 ml at 30°C. The tracing started at 1 min with the addition of 50 mM glucose (G), and 15 mM KCl (K+) was added at 6 min, as indicated. The changes were calibrated by additions of 100 mM HCl.
FIG. 6.
Internal pH (A) and membrane potential (B). (A) Changes of the internal pH in intact cells as indicated by the fluorescence changes of electroporated pyranine are shown. Incubation was performed in 2 mM tartrate-MES-TEA buffer (pH 4.0 and 6.0) as indicated. Pyranine was loaded into the cells by electroporation (1.5 kV, 200 Ω, 25 μF). The tracing was started by the addition of 25 mg of cells; 50 mM glucose (G) was added at 80 s, and 15 mM KCl (K+) was added at 500 s. To obtain a reference of maximum and minimum fluorescence, 10 μl of 2 N NH4OH or 10 μl of 50% propionic acid were added, respectively, to the incubation mixture after the tracing and the values obtained were recorded and used to adjust the curve. Fluorescence was recorded at room temperature at 460 to 520 nm. (B) Membrane potential variations as indicated by the fluorescence changes of DiSC3(3) are shown. Incubation was performed in same buffer plus 100 μM CaCl2 and 10 μM CCCP. The tracing was started by the addition of 0.5 μM of the cyanine after 20 s, followed by 15 mM KCl (K+) at 200 s, as indicated. Fluorescence was recorded at 540 to 590 nm.
Comments.
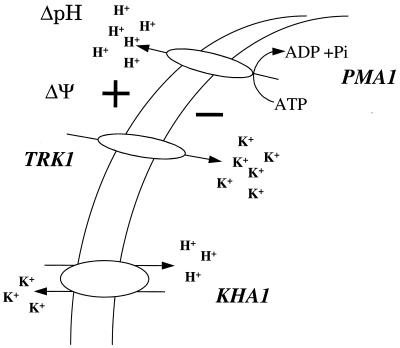
The KHA1 gene resembles that of other known cation/proton antiporters, is expressed in yeast, and probably encodes a K+/H+ exchanger. The sequence similarity is highest in the N-terminal part, and we speculate that the C-terminal portion may have a special function. The key indication for KHA1 function is the approximate doubling of the K+ content in the mutant. According to the scheme in Fig. 7, the elevated K+ concentration is probably related to normal K+ entry but impairment of K+ exit by proton exchange and hence to the somewhat higher internal pH. Lower external pH and higher membrane potential would follow. A more detailed explanation of the various curves is not possible, in part because the scheme omits known elements such as outward-rectifying potassium channels (2) and in part because glucose causes an initial and transient acidification by various means, such as formation of the phosphorylated intermediates of glycolysis (11, 14, 23) and acidic products such as carbonic acid, as well as activation of the electrogenic H+-ATPase; these processes occur simultaneously but with different time courses and directions, and some of them are more rapid in the mutant. To the degree that the primary impairment in the mutant is K+/H+ exchange, it appears that this process may be a key determinant of basic phenomena such as rate of growth, fermentation, and cell cycle. The specific ways in which these various processes are affected by the K+/H+ impairment remain to be shown. We favor the view that the higher K+ concentration itself, and thus the higher osmotic pressure, is the key determinant (as considered for the cell cycle [6, 16]) and that more rapid cell cycle results in more rapid metabolism.
FIG. 7.
Proposed role of KHA1. Active transport of K+ at the plasma membrane is driven by the H+-ATPase PMA1 via the ΔΨ-coupled carrier TRK1. Changes expected as a result of disruption of the gene and absence of the KHA1 protein are described in the text. Essentially, the kha1::URA3 mutant should show (i) no changes in the initial rate or kinetic constants of the uptake system TRK1, (ii) a higher accumulation of K+ because of the absence of one of the efflux systems for the cation, (iii) a greater increase of the internal pH and a greater decrease of the external pH upon the addition of K+, and (iv) a greater decrease of the membrane potential upon the addition of K+.
ACKNOWLEDGMENTS
We thank Diego González-Halphen for critical comments on the manuscript, Alejandro Zentella Dehesa and Fernando López Casillas for helpful discussions, and José Esparza López for technical assistance with cell cytometry. We are grateful to Gerardo Coello and Ana María Escalante for their assistance in the computer analyses of the DNA sequences.
This work was partially supported by grants IN207696, from the Dirección General de Asuntos del Personal Académico of this University, and 400346-5-3282PN, from the Consejo Nacional de Ciencia y Tecnología, de México.
REFERENCES
- 1.André B. An overview of membrane transport protein in Saccharomyces cerevisiae. Yeast. 1995;11:1575–1611. doi: 10.1002/yea.320111605. [DOI] [PubMed] [Google Scholar]
- 2.Bertl A, Slayman C L, Gradmann D. Gating and conductance in an outward-rectifying K+ channel from the plasma membrane of Saccharomyces cerevisiae. J Membr Biol. 1993;132:183–199. doi: 10.1007/BF00235737. [DOI] [PubMed] [Google Scholar]
- 3.Beutler H O. Ethanol. In: Bergmeyer H U, editor. Methods of enzymatic analysis—1984. 3rd ed. Weinheim, Germany: Verlag Chemie; 1984. pp. 598–606. [Google Scholar]
- 4.Camarasa C, Prieto S, Ros R, Salmon J, Barré P. Evidence for a selective and electroneutral K+/H+-exchange in Saccharomyces cerevisiae using plasma membrane vesicles. Yeast. 1996;12:1301–1313. doi: 10.1002/(SICI)1097-0061(199610)12:13%3C1301::AID-YEA18%3E3.0.CO;2-A. [DOI] [PubMed] [Google Scholar]
- 5.Conway E J, O’Malley E. The nature of the cation exchanges during yeast fermentation, with formation of 0.02N-H ion. Biochem J. 1946;40:59–67. [PMC free article] [PubMed] [Google Scholar]
- 6.Degols G, Shiozaki K, Russel P. Activation and regulation of the Spc1 stress-activated protein kinase in Schizosaccharomyces pombe. Mol Cell Biol. 1996;16:2870–2877. doi: 10.1128/mcb.16.6.2870. [DOI] [PMC free article] [PubMed] [Google Scholar]
- 7.Goffeau A, et al. The yeast genome directory. Nature. 1997;387(Special issue):5–105. [PubMed] [Google Scholar]
- 8.González A, Membrillo-Hernández J, Olivera H, Aranda C, Macino G, Ballario P. Cloning of the yeast gene coding for the glutamate synthase small subunit (GUS2) by complementation of Saccharomyces cerevisiae and Escherichia coli glutamate auxotrophs. Mol Microbiol. 1992;6:301–308. [PubMed] [Google Scholar]
- 9.Heichman K A, Roberts J M. The yeast CDC16 and CDC27 genes restrict DNA replication to once per cell cycle. Cell. 1996;85:39–48. doi: 10.1016/s0092-8674(00)81080-6. [DOI] [PubMed] [Google Scholar]
- 10.Hill J E, Myers A M, Koerner T J, Tzagoloff A. Yeast/E. coli shuttle vectors with multiple unique restriction sites. Yeast. 1986;2:163–167. doi: 10.1002/yea.320020304. [DOI] [PubMed] [Google Scholar]
- 11.Höfer M, Calahorra M, Peña A. Assessment of ΔμH+ in Schizosaccharomyces pombe: intracellular inclusion of impermeable agents by electroporation. Folia Microbiol. 1996;41:98–100. doi: 10.1007/BF02816357. [DOI] [PubMed] [Google Scholar]
- 12.Kunst A, Draeger B, Ziegenhorn J. d-Glucose. In: Bergmeyer H U, editor. Methods of enzymatic analysis—1984. 3rd ed. Weinheim, Germany: Verlag Chemie; 1984. pp. 163–171. [Google Scholar]
- 13.Kyte J, Doolittle R F. A simple method for displaying the hydropathic character of a protein. J Mol Biol. 1982;157:105–132. doi: 10.1016/0022-2836(82)90515-0. [DOI] [PubMed] [Google Scholar]
- 14.Lagunas R. Sugar transport in Saccharomyces cerevisiae. FEMS Microbiol Rev. 1993;104:229–242. doi: 10.1016/0378-1097(93)90598-v. [DOI] [PubMed] [Google Scholar]
- 15.Lew D J, Marini N J, Reed S I. Different G1 cyclins control the timing of cell cycle commitment in mother and daughter cells of the budding yeast S. cerevisiae. Cell. 1992;69:317–327. doi: 10.1016/0092-8674(92)90412-6. [DOI] [PubMed] [Google Scholar]
- 16.Marshall C J. MAP kinase kinase kinase, MAP kinase kinase and MAP kinase. Curr Opin Genet Dev. 1994;4:82–89. doi: 10.1016/0959-437x(94)90095-7. [DOI] [PubMed] [Google Scholar]
- 17.Martinussen J, Hammer K. Cloning and characterization of upp, a gene encoding uracil phosphoribosyltransferase from Lactococcus lactis. J Bacteriol. 1994;176:6457–6463. doi: 10.1128/jb.176.21.6457-6463.1994. [DOI] [PMC free article] [PubMed] [Google Scholar]
- 18.Miosga T, Witzel A, Zimmermann F K. Sequence and function analysis of a 9.46 kb fragment of Saccharomyces cerevisiae chromosome X. Yeast. 1994;10:965–973. doi: 10.1002/yea.320100712. [DOI] [PubMed] [Google Scholar]
- 19.Munro A W, Ritchi G Y, Lamb A J, Douglas R M, Booth I R. The cloning and DNA sequence of the gene for the glutathion-regulated potassium-efflux system KefC of Escherichia coli Mol. Microbiol. 1991;5:607–616. doi: 10.1111/j.1365-2958.1991.tb00731.x. [DOI] [PubMed] [Google Scholar]
- 20.Nass R, Cunningham K W, Rao R. Intracellular sequestration of sodium by a novel Na+/H+ exchanger in yeast is enhanced by mutation in the plasma membrane H+-ATPase. J Biol Chem. 1997;272:26145–26152. doi: 10.1074/jbc.272.42.26145. [DOI] [PubMed] [Google Scholar]
- 21.Peña A, Cinco G, Gómez-Puyou A, Tuena M. Effects of the pH of the incubation medium on glycolysis and respiration in Saccharomyces cerevisiae. Arch Biochem Biophys. 1972;153:413–425. doi: 10.1016/0003-9861(72)90359-1. [DOI] [PubMed] [Google Scholar]
- 22.Peña A, Uribe S, Pardo J P, Borbolla M. The use of a cyanine dye in measuring membrane potential in yeast. Arch Biochem Biophys. 1984;231:217–225. doi: 10.1016/0003-9861(84)90381-3. [DOI] [PubMed] [Google Scholar]
- 23.Peña A, Ramírez J, Rosas G, Calahorra M. Proton pumping and the internal pH of yeast cells, measured with pyranine introduced by electroporation. J Bacteriol. 1995;177:1017–1022. doi: 10.1128/jb.177.4.1017-1022.1995. [DOI] [PMC free article] [PubMed] [Google Scholar]
- 24.Prior C, Potier S, Souciet J-L, Sychrova H. Characterization of the NHA1 gene encoding a Na+/H+-antiporter of the yeast Saccharomyces cerevisiae. FEBS Lett. 1996;387:89–93. doi: 10.1016/0014-5793(96)00470-x. [DOI] [PubMed] [Google Scholar]
- 25.Ramírez J, Peña A, Montero-Lomelí M. K+/H+ exchange in reconstituted yeast plasma membrane vesicles. Biochim Biophys Acta. 1996;1285:175–182. doi: 10.1016/s0005-2736(96)00153-8. [DOI] [PubMed] [Google Scholar]
- 26.Sambrook J, Fritsch E F, Maniatis T. Molecular cloning: a laboratory manual. 2nd ed. Cold Spring Harbor, N.Y: Cold Spring Harbor Laboratory; 1989. [Google Scholar]
- 27.Struhl A, Davis R W. Transcription of the his3 gene region in Saccharomyces cerevisiae. J Mol Biol. 1981;152:535–552. doi: 10.1016/0022-2836(81)90267-9. [DOI] [PubMed] [Google Scholar]
- 28.Waser M, Hess-Bienz D, Davies K, Solioz M. Cloning and disruption of a putative Na-H antiporter gene of Enterococcus hirae. J Biol Chem. 1992;267:5396–5400. [PubMed] [Google Scholar]


