

Abstract
Bacterial (meningococcal) meningitis is a devastating infectious disease with outbreaks occurring annually during the dry season in locations within the ‘Meningitis Belt’, a region in sub-Saharan Africa stretching from Ethiopia to Senegal. Meningococcal meningitis occurs from December to May in the Sahel with large epidemics every 5–10 years and attack rates of up to 1000 infections per 100,000 people. High temperatures coupled with low humidity may favor the conversion of carriage to disease as the meningococcal bacteria in the nose and throat are better able to cross the mucosal membranes into the blood stream. Similarly, respiratory diseases such as influenza and pneumonia might weaken the immune defenses and add to the mucosa damage. Although the transmission dynamics are poorly understood, outbreaks regularly end with the onset of the rainy season and may begin anew with the following dry season. In this paper, we employ a generalized additive modeling approach to assess the association between number of reported meningitis cases and a set of weather variables (relative humidity, rain, wind, sunshine, maximum and minimum temperature). The association is adjusted for air quality (dust, carbon monoxide), as well as varying degrees of unobserved time-varying confounding processes that co-vary with both the disease incidence and weather. We present the analysis of monthly reported meningitis counts in Navrongo, Ghana, from 1998–2008.
Keywords: Africa, Ghana, GAM, Humidity, Meningitis, Temperature, Weather
1. INTRODUCTION: MENINGITIS IN AFRICA
Meningitis is endemic across the Sahel region of Africa. In locations within the ‘meningitis belt’, a region in sub-Saharan Africa stretching from Ethiopia to Senegal (Figure 1), outbreaks of meningococcal meningitis (Neisseria meningitides) occur annually during the dry season (Lapeyssonnie 1963; Greenwood 1999). Meningococcal meningitis typically occurs between December and May in the Sahel, with large, periodic epidemics every 2–10 years. The historical attack rates range from 10 to 1,000 infections per 100,000 people, with a case fatality rate of approximately 10 % (Greenwood et al. 1987; Moore et al. 1989). Although there are several subtypes of Neisseria meningitides, called serogroups, most epidemics are attributed to the meningococci of serogroup A. The levels of endemicity observed regularly in the Sahel region would be considered epidemic in the developed world (Molesworth et al. 2003).
Figure 1.
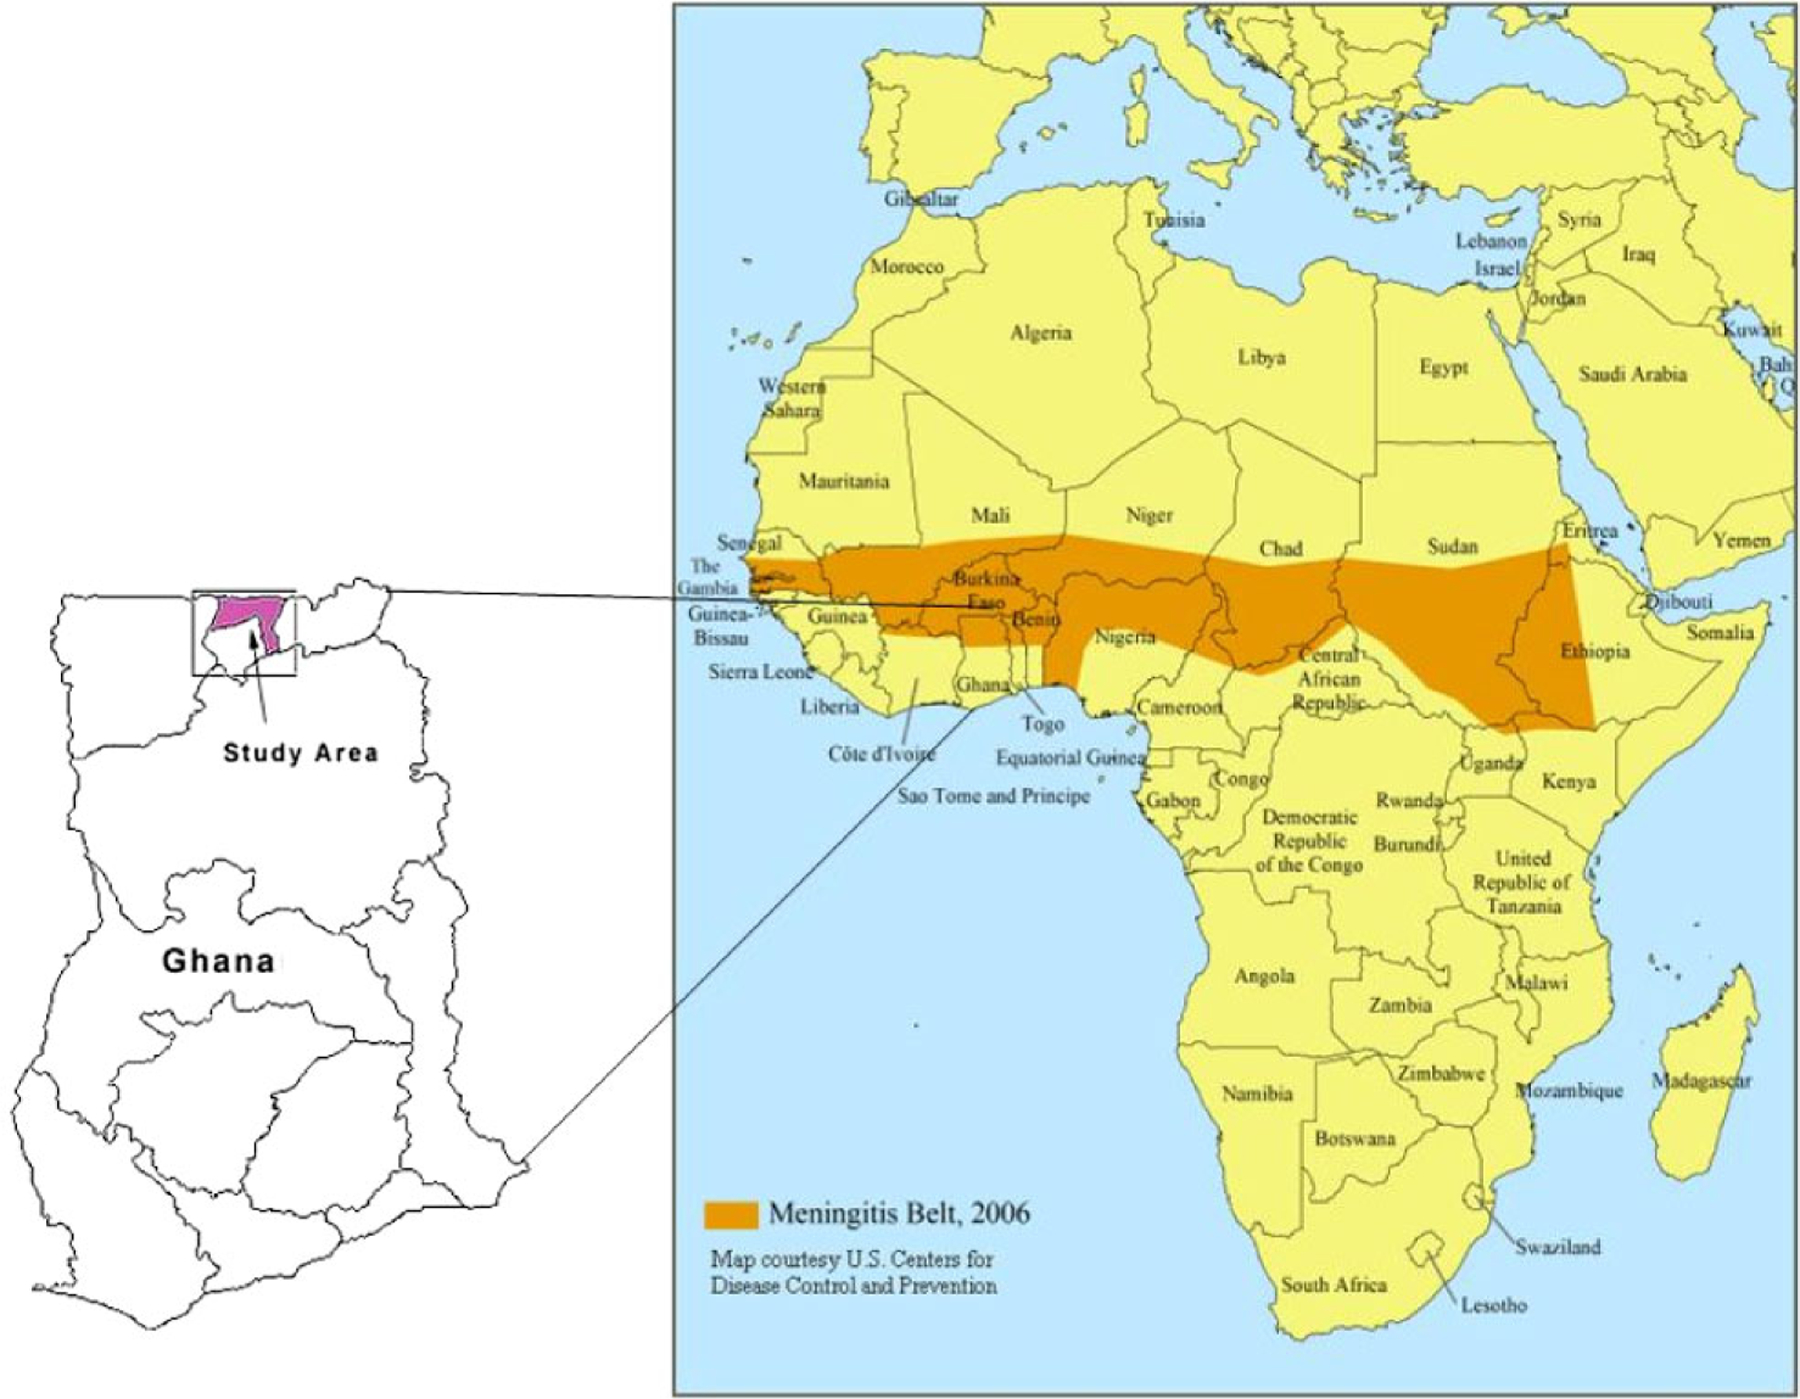
The African Meningitis Belt map (courtesy of CDC), and the enlarged map of Ghana, with the study region shaded.
The dynamics of the transmission of meningitis in the Sahel are poorly understood, and likely the result of a myriad of interacting factors, such as new strain introduction, population susceptibility to a new serogroup, previous infections which may predispose a person to meningitis, socio-economic status, migration, and environmental conditions. Nonethe-less, several studies point to the importance of weather-related influences on disease-transmission. Early research by Lapeyssonnie (1963) noted the occurrence of epidemics during the dry, dusty season, and it is hypothesized that high temperatures coupled with low humidity may favor the conversion of benign meningococcal meningitis bacteria in the nose and throat to a pathogenic by damaging the mucosa and lowering the immune defense (Greenwood et al. 1984; Moore 1992; Greenwood 1999). Since then, several other researchers have hypothesized links between weather and meningitis, most notably Cheesbrough et al. (1995), Molesworth, Cuevas, and Thomson (2002), Besancenot, Boko, and Oke (1997), Molesworth et al. (2003). Sultan et al. (2005a, 2005b, 2005c, 2007), Yaka et al. (2008), Roberts (2008), Thomson et al. (2006), and Cuevas et al. (2007). It is fairly well accepted that outbreaks in areas of hyperendemicity tend to end abruptly with the increased humidity associated with the onset of the rainy season, and may begin anew with the following dry season.
Importance of the relationship between weather and meningitis is particularly high-lighted within the context of climate change, where global warming and altered precipitation patterns may indicate favorable conditions for meningitis spread in the future. Based on the ensemble mean of 21 models, the near-surface temperatures in sub-Saharan Africa are projected to continue warming at a rate of about 0.25–0.35 degree Celsius per decade, with temperatures at the end of the 21st century about 3 degree Celsius warmer than at the beginning of the century (Christensen et al. 2007; Trenberth et al. 2007). Rainfall projections based on ensemble means of two most recent IPCC AR4 models are highly uncertain (Christensen et al. 2007), with half of the models projecting an increase, and half decrease in the annual rainfall for the region. Consequently, the decreasing rainfall trends and more severe drought conditions that were observed in the region during the 20th century (Trenberth et al. 2007) may continue in the 21st century.
In addition to weather variables (such as relative humidity) thought to be related to meningitis incidence, disease and pollution may contribute to incidence of meningitis. It has been observed that outbreaks of meningitis are often preceded by high incidence of respiratory diseases such as pneumococcal pneumonia, which may weaken the immune system and further damage the mucous membranes (Moore et al. 1990). In the northern region of Ghana, Hodgson et al. (2001) found that exposure to smoke from cooking fires increased the risk of contracting meningococcal meningitis. This increased risk suggests that exposure to elevated concentrations of air pollutants, such as carbon monoxide (CO) and particulate matter, may be linked to illness. However, more research is needed to better understand other potential sources of pollution and their relative contributions to illness. Sources of air pollutants in the region occur at local scales (e.g., cooking, local dust) and regional scales (e.g., biomass burning, large-scale dust events), and their linkages to meningitis are not well understood.
The current efforts in controlling meningitis are mostly focused on vaccination, and therefore identifying populations at risk using epidemiological and microbiological surveillance as well as forecasting systems, remains a public health priority. As a part of that effort, understanding the role that weather variables play in a meningitis outbreak is crucial. Reliable weather forecasts may be used to guide vaccine allocation before the meningitis season starts, and coordinate other intervention strategies. However, as an infectious disease, meningitis is spread through contact, and consequently, behavior of the population, contact networks, and social activity are all expected to be related to incidence of meningitis. These “societal and behavioral processes”, may also be related to weather, as they are often seasonal in nature. For example, farm workers often migrate from northern to southern Ghana during the Sahelian dry season to help with the harvest in the south (Hayden et al. forthcoming). Hence, these processes are potentially time-varying confounders, and failure to account for them could result in biased estimates of weather effects, and potentially futile interventions.
The research presented in this paper is a step toward the goal of understanding the association between several key weather variables and meningitis outbreaks, and providing a basis for further development of reliable disease activity forecasts in an effort to reduce the spread of meningitis. This paper focuses on assessing the relative impact of environmental factors, including weather, on meningitis, via a generalized additive model (GAM) framework, linking meningitis case counts to a set of weather variables (relative humidity, rain, wind, sunshine, maximum and minimum temperature), while adjusting for several air quality variables (dust, CO emissions from fires) as well as for the unobserved time-varying confounding processes. We present the results based on 11 years of meningitis outbreak and meteorological data in Navrongo, Ghana (Figure 1).
2. DATA
The data were collected by researchers (and co-authors) at the Navrongo Health Research Centre (NHRC). The NHRC is located in Navrongo, near Ghana’s northern border with Burkina Faso, in the Kassena-Nankana District (KND) of the Upper East Region of Ghana (Leimkugel et al. 2007), as shown in Figure 1. The savannas of Sahelian Africa, where KND is situated, experience two main weather seasons: wet season from June to October and a dry season for the rest of the year. The population size is approximately 140,000, and most inhabitants live in rural areas, except for approximately 20,000 residents who live in the city of Navrongo (Nyarko et al. 2002).
The epidemiological data included total monthly counts of meningitis and pneumonia each month over the 11-year period, from 1998 to 2008. The cases were laboratory-confirmed at the Navrongo Health Research Centre, which serves as the reference laboratory for the Upper East Region of Ghana. The meteorological data were collected from the local Navrongo weather station which is operated by the Ghana Meteorological Services. Weather variables included daily dust status, number of sunshine hours, maximum and minimum temperature, relative humidity, rain quantity, and wind speed. Given that meningitis case counts were aggregated on the monthly scale, the weather data were provided as monthly totals or averages (percents in the case of categorical variables, such as dust). All data were collected and entered into an electronic database by the NHRC researchers. In addition to the observed weather variables, the CO emission estimates (in grams of CO per day) were produced by the Fire Inventory model (FINNv1; Wiedinmyer et al. 2011), developed at the National Center for Atmospheric Research (NCAR). The FINNv1 was used to generate daily CO emission estimates for a small area of Northern Ghana, based on satellite observations of active fires. These daily CO values were averaged for each month to form the monthly average “CO per day” variable used in the analysis.
Little is known about other processes related to the spread of meningitis as an infectious disease, such as migration, social contacts, and overall population health and immunity levels. Human migration patterns vary during the year, and are largely driven by harvesting schedules. Ghana also has a meningitis vaccination campaign, which varies from year to year in its success rate. Between 1997 and 2002, yearly vaccination was available to the entire KND district, while between 2003 and 2005 the vaccine was available to smaller groups (Leimkugel et al. 2007). For the purposes of our analysis, all these patterns can be considered time-varying confounders, while their yearly averages can be viewed as a part of the fixed year-specific factors, discussed in more detail in the next section.
3. GENERALIZED ADDITIVE MODELS FOR MENINGITIS
In order to estimate the effects of important weather variables with minimal bias, adjustment for the many confounders that may be related to both meningitis and to the weather variables is necessary. This includes confounders that are relatively unchanging during the year (such as population characteristics, or whether a vaccination campaign was in place), as well as those that change during the course of the year (behavioral and social factors, migration, vaccine uptake over time, etc.).
To estimate the effects of weather variables and adjust for possible static and time-varying confounders, we employ the generalized additive modeling framework (Hastie and Tibshirani 1999). While generalized additive models have been widely used as a standard method in studies of air pollution and health over the last decade (see for example Schwartz 1994a, 1994b; Dominici et al. 2000, 2004; Peng, Dominici, and Louis 2006; Zibman 2009), the current paper presents one of the first instances of using GAM in the arena of infectious diseases.
As a more flexible alternative to generalized linear models, generalized additive models (GAM) are capable of flexibly modeling the relationship between incidence and weather, by including a semiparametric smooth function of time as a proxy for time-varying confounding processes. These time-varying confounders include complex social and behavioral processes (e.g. vaccination uptake and migration) and health patterns (respiratory illness, influenza, immunity) which co-vary with both the meningitis incidence and with weather. These processes are assumed to vary slowly relative to the weather predictors of interest, and will thus tend to capture more the seasonal variation in incidence. For example, relative humidity can change drastically from month to month, but processes like migration tend to change more slowly as they are likely linked to seasonal variation.
3.1. Model Specification
We use GAM to assess the association between reported meningitis outbreak severity and a set of weather variables (relative humidity, rain, wind, sunshine, maximum and minimum temperature), while adjusting for several air quality proxy variables (dust, CO), as well as for the unobserved time-varying confounding processes. Time-varying unobserved confounders are proxied by a flexible function of time, modeled as a low-degree cubic spline that slowly varies over time. The coefficients of the spline bases were estimated jointly with the other parameters in the model. As the outcomes in our model are the monthly counts of reported meningitis cases, the log was chosen as the link function (Hastie and Tibshirani 1999).
The outcome modeled is the monthly number of lab-confirmed reported meningitis cases, Yjt (where j = 1,…,11 denotes the year, and t = 1,…, 12 denotes the month within each year). The outcome Yjt is modeled as a Poisson distributed random variable with the mean μ jt, where
| (1) |
Here, g(t) is a smooth function of time across the 12 months that estimates the effect of all unobserved time-varying confounding processes, related both to the incidence of meningitis and to the weather. Note that this function also captures the seasonality effect in a flexible way. In some models, attempts to deal with seasonality involve including a fixed effect indicator for each month, or a sine function over the course of 12 months. Our function g(t) can be viewed as a smoothed analogue of the month-specific effects.
The function g(t) is assumed to have the same shape each year. However, we allow each year to have its own fixed intercept, capturing the differences in incidence between years that are due to static unobserved confounders such as population changes, population health, serogroup prevalence, vaccination campaigns, and general socio-economic conditions in the region.
In addition to the year-specific intercepts, the vector of coefficients β contains the effects of weather and pollution variables and exposures collected in the covariate matrix Xjt: total monthly rain amount (in millimeters), maximum daily temperature for the month (degree Celsius), monthly average relative humidity measured at 3 pm (percent), monthly average number of sunshine hours in a day, monthly average of daily wind speed (kilometers per hour), percent of days with dust, and CO emissions from fires (grams CO per day). We will also examine the interaction between temperature and relative humidity. The pairwise scatterplots of variables are shown in Appendix.
Besides the variables describing the physical environment, we also consider including the number of cases of pneumonia in the preceding months as a proxy for respiratory health. This variable will be used to test the hypothesis that weakened immune system and damaged mucosa ultimately play a role in meningitis incidence.
4. RESULTS
4.1. Full GAM
We start with the full model, which includes all weather and pollution covariates, year-specific intercepts, and the year-long smooth function of time, g(t), represented by cubic splines. This function is taken to represent yearly seasonality, and the basic seasonality shape is assumed to stay the same each year. The year-specific intercepts accommodate differential baseline risk from year to year, due to strain-specific and average population characteristics that do not vary over the course of the year.
A subset of variables (CO emissions, humidity, rain, minimum temperature, wind speed, and pneumonia cases) thought to have a longer-term effect on the risk of meningitis are lagged, allowing us to understand the relationship between these variables and meningitis incidence in the months that follow. Only the first two lags (values from the previous month and from two months ago) were considered. The best set of lags for all variables was chosen based on the AIC criterion, based on the model with g(t) with 4 degrees of freedom. The first lag was found to be most significant for all variables except pneumonia, for which the second lag was the most powerful predictor of meningitis incidence. The variables whose effect is thought to be more immediate, such as dust (under the assumption that it irritates the throat immediately), maximum temperature (under the assumption that it causes dehydration and discomfort), and sunshine (generally associated with temperature) were not lagged.
The model was fit by maximizing the penalized log-likelihood. The estimated linear effects for the full model are summarized in Table 1. We fit two versions of the full GAM models: one with a very flexible 8-degree-of-freedom function of time over 12 months, and the other with a more rigid 4-degree-of-freedom function of time. As expected, the more degrees of freedom the yearly function g(t) has, the more variance is allowed to be explained by the time-varying confounders. However, the stronger predictors are expected to remain strong across the models with different smoothness assumptions about g(t).
Table 1.
GAM model estimates for models with 8 and 4 degrees of freedom.
| 8 dof GAM | 4 dof GAM | |||||
|---|---|---|---|---|---|---|
| Predictor | Coef. | St. error | z-stat | Coef. | St. error | z-stat |
| Max temp (curr. month; degree C) | 0.181 | 0.074 | 2.44 | 0.337 | 0.075 | 4.51 |
| CO (prev. month; g CO/day) | 0.013 | 0.003 | 3.68 | 0.008 | 0.003 | 2.53 |
| % Dusty days (curr. month; %) | 1.785 | 0.490 | 3.64 | 1 .100 | 0.498 | 2.21 |
| Humidity at 3 pm (prev. month; %) | −0.015 | 0.019 | −0.81 | −0.027 | 0.018 | −1.46 |
| Rain (prev. month; mm) | −0.005 | 0.005 | −1.04 | −0.005 | 0.005 | −0.99 |
| Min temp (prev. month; degree C) | −0.087 | 0.109 | −0.80 | −0.052 | 0.110 | −0.47 |
| Wind speed (prev. month; km/hr) | 0.098 | 0.221 | 0.44 | 0.073 | 0.217 | 0.34 |
| Sunshine (curr. month; hours) | 0.110 | 0.132 | 0.84 | 0.028 | 0.132 | 0.21 |
| Pneumonia cases (2 months ago) | −0.007 | 0.033 | −0.21 | 0.033 | 0.033 | 0.99 |
As we see from Table 1, the higher levels of current month temperature, sunshine, percent of dusty days, as well as previous month’s CO emissions and wind, tend to co-occur with the higher meningitis incidence. On the other hand, higher levels of previous months’ minimum temperature, relative humidity and rain are associated with lower levels of meningitis incidence. All estimated weather effects preserve their signs in the two models, and maximum temperature, relative humidity, dust and CO emissions seem most persistently associated with incidence. As expected, the significance of the predictors is slightly higher in the 4-degree model, although the results from the two models appear to be qualitatively the same.
More specifically, the 4-degree model estimates that for every one degree Celsius increase in monthly average maximum temperature, holding other variables constant, the log of the mean number of meningitis cases increases by 0.181—or equivalently, the mean number of cases increases approximately by 20 %. Consequently, a 10 degree Celsius increase in the monthly average maximum temperature is associated with the 6-fold increase in the mean monthly number of meningitis cases, holding all other variables in the model constant. Similarly, every one percent increase in relative humidity is associated with approximately 2.7 % decrease in the log of mean number of cases in the 4-degree model, holding all else constant, implying a 72 % reduction in expected monthly meningitis counts with every 20 % increase in relative humidity. Given that the relative humidity was observed to range between 6 % and 73 % during the course of the year, this magnitude of change is not uncommon.
The most significant predictors in the full model seem to be the current month maximum temperature, total number of days with dust, the previous month average relative humidity at 3pm, as well as burning biomass as captured by the CO emissions from fires. It is interesting to note that the burning precedes the dust from the Sahara by one or two months. It is possible that the previous month CO emissions are capturing in part the past cumulative effects of other variables, as they are a result from a model using a variety of meteorological and physical processes from preceding months in addition to the satellite observations of burning biomass. Furthermore, most other air pollutants directly emitted from fires will roughly scale to CO, so the CO emissions in our model may be acting as a proxy for other pollutants related to smoke. Current month CO, minimum temperature, rain and humidity were not significantly related to the incidence, given other variables in the model. Similarly, previous month maximum temperature, sunshine, and dust, as well as the interactions between relative humidity and temperature, were not found to be significant.
Pneumonia cases were most significant when lagged by 2 months, given other variables in the model. This variable, like CO, may also be capturing to some degree the cumulative negative effects of other previous months’ variables. Interestingly, pneumonia cases appear to be almost orthogonal to the rest of the variables in the model: removing it from the model resulted in negligible change in the estimated coefficients.
The model fit is best illustrated in Figure 2. Apart from failing to capture very small outbreaks, year-specific intercepts and time-varying g(t) allow the model to track the actual number of cases over the course of 11 years very closely. There is very little difference in fitted values between the GAM models with 4 and 8 degrees of freedom.
Figure 2.
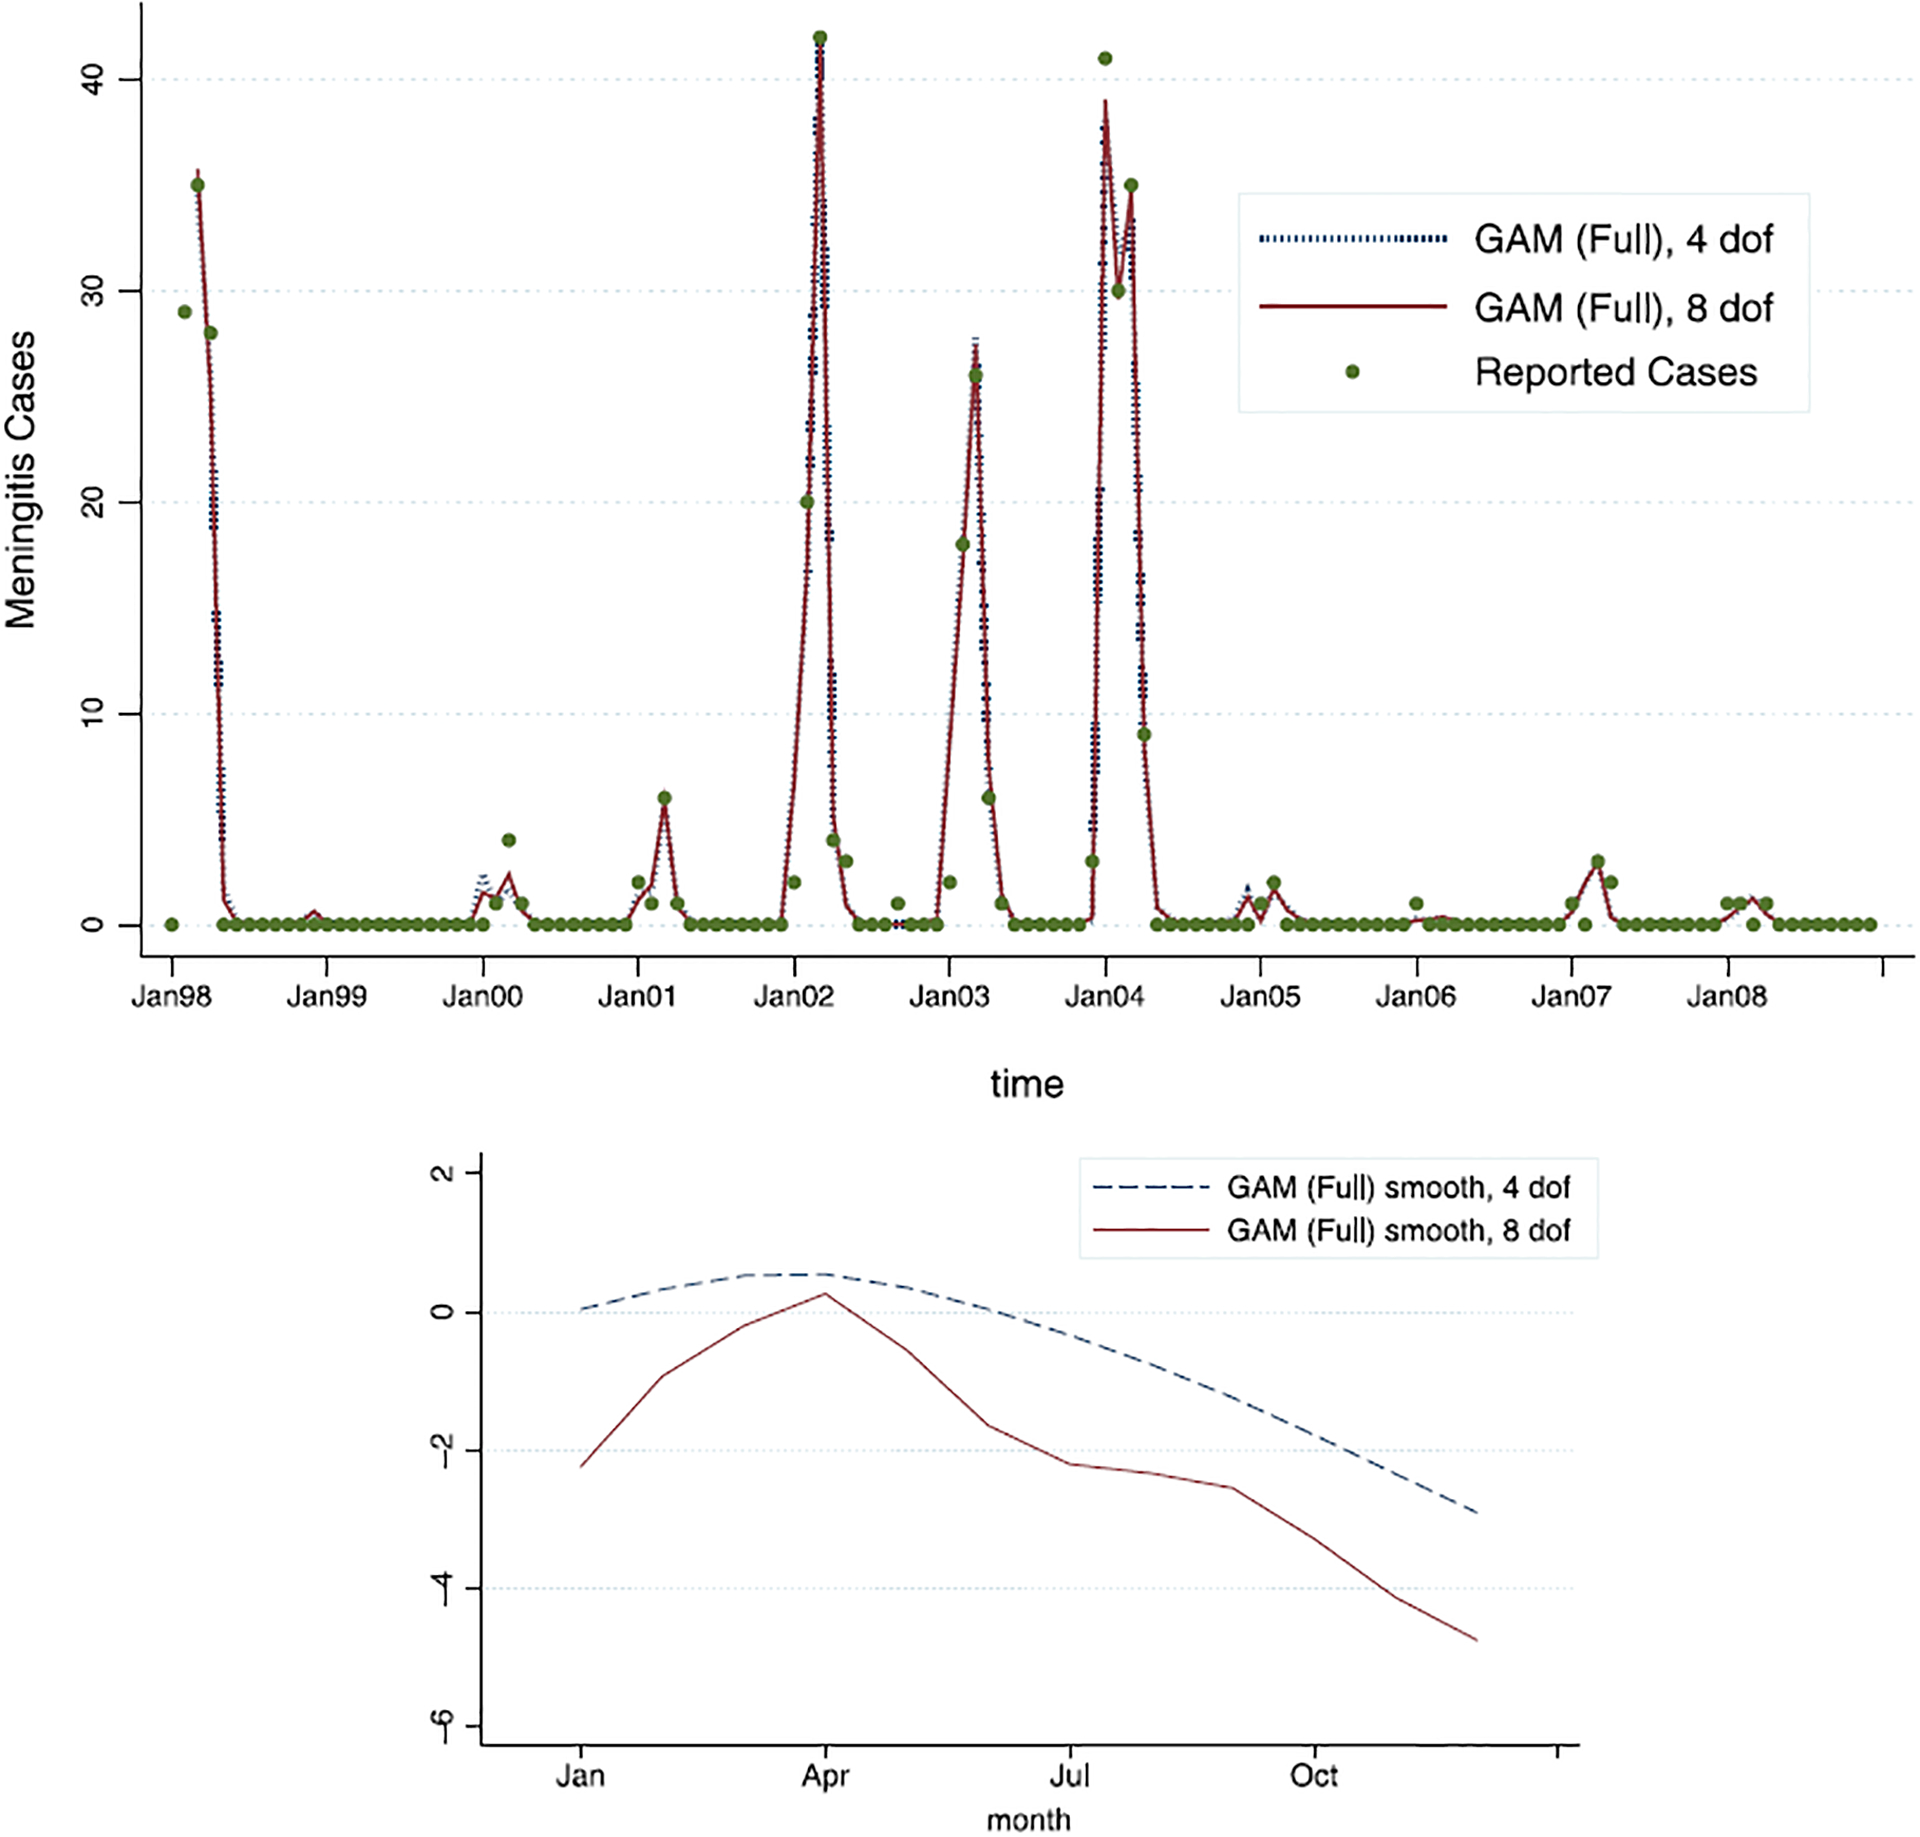
The GAM (full model) fit for the model with 4 degrees of freedom (dashed line) and the model with 8 degrees of freedom (full line); as can be seen, very little difference is observed in model fit. The estimated smooth functions of time, ĝ(t), across 12 months, show slight difference.
The smooth function of time, g(t), was fit with cubic smoothing splines, first with 4 and then with 8 degrees of freedom. These estimated functions of time (without year-specific intercepts) are given in Figure 2. It is notable that the basic shape of the estimated function is relatively stable across the two models: after the first quarter (January–March), it appears to be roughly linearly decreasing for the rest of the year. That corresponds to the higher underlying risk of meningitis from January until March, and then a continual decay (given all the other predictors in the model) from April to December. This estimated unobserved effect captures the auto-correlation and seasonality of the meningitis epidemic, and matches the conventional wisdom about the epidemic seasonality.
Note that g(t) is not required to “wrap around”, and thus we do not require December’s estimate to be close to January’s estimate. The g(t) function is instead allowed to be shifted up and down for each year by the value of the year-specific intercept, mitigating the December–January gap. There is much variation in the incidence from year to year, which can perhaps best be captured by the range of the year-specific intercepts (relative to the first year): they range from −8.9 to 0.33 (on the log scale). This strongly suggests that there are factors that vary from year to year, such as average immunity, serogroup prevalence, vaccine availability, among others, which influence the size of the epidemic.
4.2. Reduced GAM
Results thus far suggest that a more parsimonious GAM model with fewer predictors might be appropriate. To that end, we fit a reduced GAM with the 4-degree-of-freedom semiparametric g(t), without some of the redundant or collinear variables. Common sense suggests that Navrongo rain is redundant if temperature and humidity are in the model. Likewise, sunshine is related to temperature. From Appendix and Table 1, it appears that wind speed and sunshine are not powerful predictors, given other variables in the model. In fact, rain, wind speed and sunshine are strongly related to dust, humidity, and temperature. We will thus require the final model to contain current maximum temperature and dust, past month’s humidity and CO, and pneumonia from two months prior as the predictors. The other 4 variables will be selected into the model based on the overall AIC.
The results from the winning reduced model (among 16 candidate models) with 4 degrees of freedom are shown in Table 2. The model fit and estimated g(t) are shown in Figure 3. As we see, the results from the restricted model are qualitatively similar to the full model, with maximum current month’s temperature now even more significantly related to the meningitis incidence. Relative humidity and minimum temperature from previous month still appear to act “protectively” as they are negatively associated with meningitis case counts. Current month’s percent of dusty days, and CO emissions from last month are both still positively associated with meningitis counts, although dust is not as significant in the reduced model as it was in the full model. Similarly, pneumonia from 2 months ago appears to be significantly positively associated with meningitis incidence.
Table 2.
Model estimates for the reduced GAM model with 4 degrees of freedom.
| Predictor | Coef. | St. error | z-stat |
|---|---|---|---|
| Max temp (current month) | 0.461 | 0.068 | 6.80 |
| Min temp (previous month) | −0.103 | 0.082 | −1.26 |
| Humidity at 3 pm (previous month) | −0.017 | 0.014 | −1.16 |
| % Dusty days (current month) | 0.547 | 0.391 | 1.40 |
| CO emissions (previous month) | 0.006 | 0.002 | 2.61 |
| Pneumonia cases (2 months ago) | 0.082 | 0.027 | 3.01 |
Figure 3.
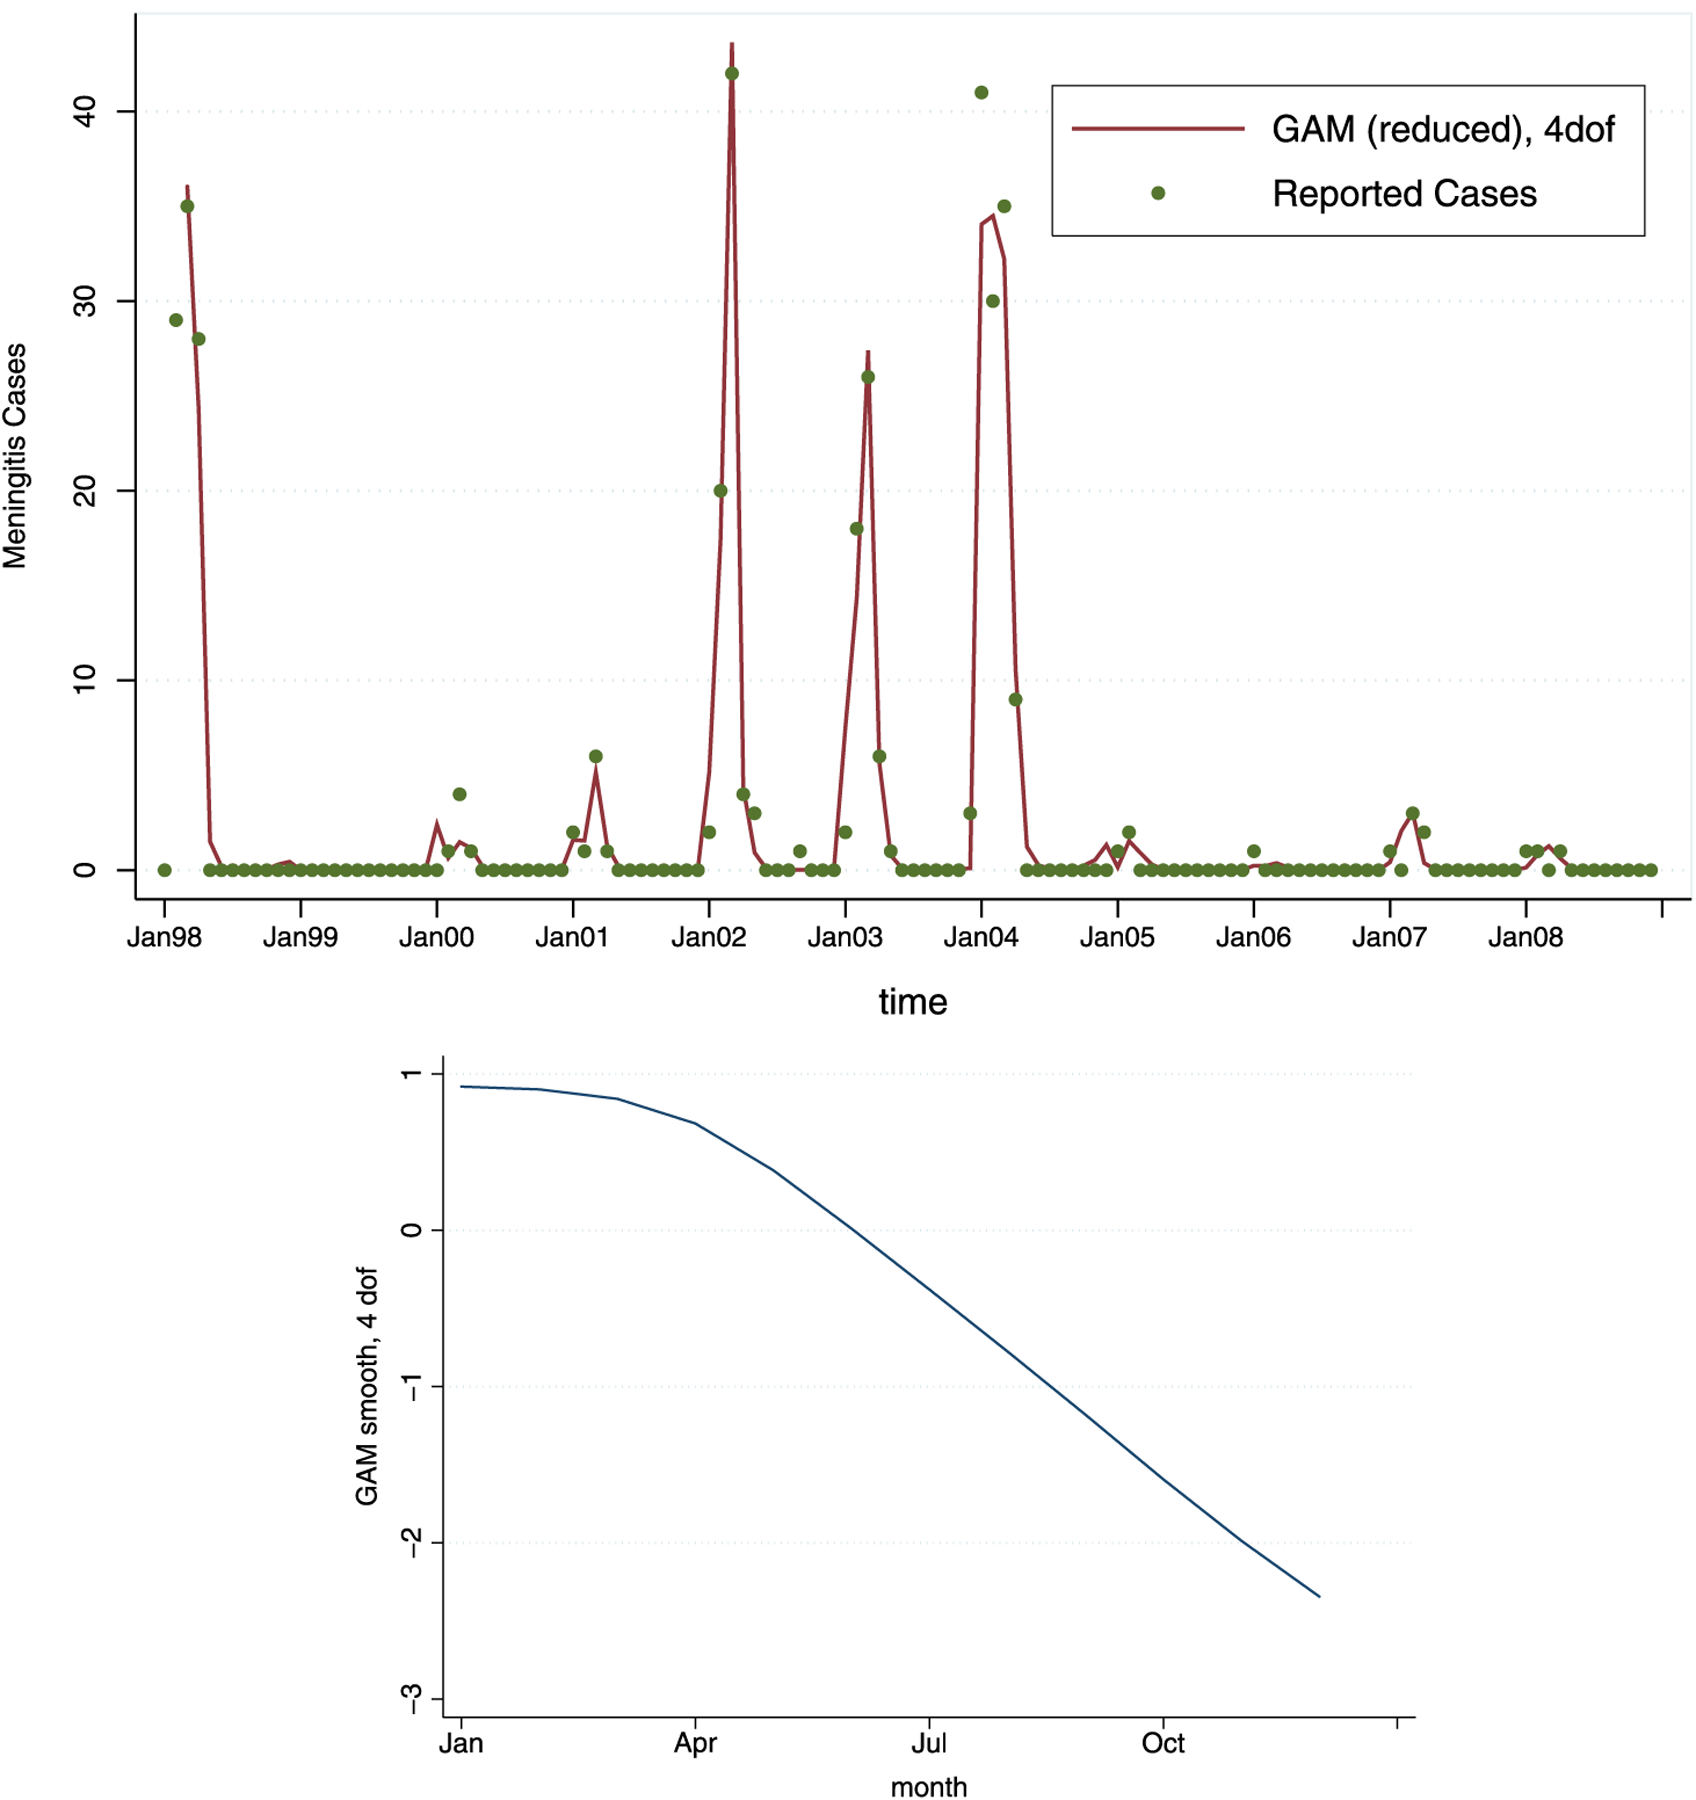
The reduced GAM fit for the model and the estimated smooth function of time, ĝ(t) (with 4 degrees of freedom) across 12 months.
4.3. GAM with Lagged Predictors
We also consider alternative versions of GAM that use only lagged predictors. Although the best model with only lagged variables is not as powerful in terms of explaining variation in the case counts as the best model with both current and lagged predictors (the deviance is greater by 50 %), a model that uses lagged variables could be used for (very) short-term prediction of the behavior of the outbreak within the epidemic season. To this end, we propose two 4 degree-of-freedom models—the first one using only the weather and pollution variables, and the second one with the pneumonia counts added. Due to strong dependence between minimum and maximum temperatures from the same month given the other variables in the model, we have excluded previous month’s maximum temperature, as the previous month’s minimum temperature appears to have a stronger effect on incidence. In fact, replacing previous month’s maximum temperature with the average number of sunshine hours appears to result in a stronger model (reducing the deviance by 15 %), while leaving all other effects approximately unchanged. Excluding dust and wind speed also changes the fit of this model by a minute amount (deviance further changes by approximately 1 %). Given these results, we present only the best reduced model with lagged covariates. Adding pneumonia seems to contribute significantly to the model, changing the deviance by 8 %. The results are shown in Table 3, and Figure 4.
Table 3.
Estimates from the two 4-degree-of-freedom GAM models with lagged predictors only: with pneumonia as a predictor, and without.
| Without Pneumonia | With Pneumonia | |||||
|---|---|---|---|---|---|---|
| Predictor | Coef. | St. error | z-stat | Coef. | St. error | z-stat |
| Rain (previous month) | −0.017 | 0.005 | −3.50 | −0.019 | 0.005 | −3.52 |
| Min temp (previous month) | −0.180 | 0.043 | −4.18 | −0.249 | 0.055 | −4.53 |
| Humidity at 3 pm (previous month) | −0.040 | 0.017 | −2.41 | −0.038 | 0.017 | −2.25 |
| Sunshine Hours (previous month) | 0.323 | 0.075 | 4.31 | 0.299 | 0.096 | 3.11 |
| CO emissions (previous month) | 0.005 | 0.002 | 2.20 | 0.005 | 0.002 | 2.55 |
| Pneumonia cases (2 months ago) | - | - | - | 0.055 | 0.027 | 2.05 |
Figure 4.
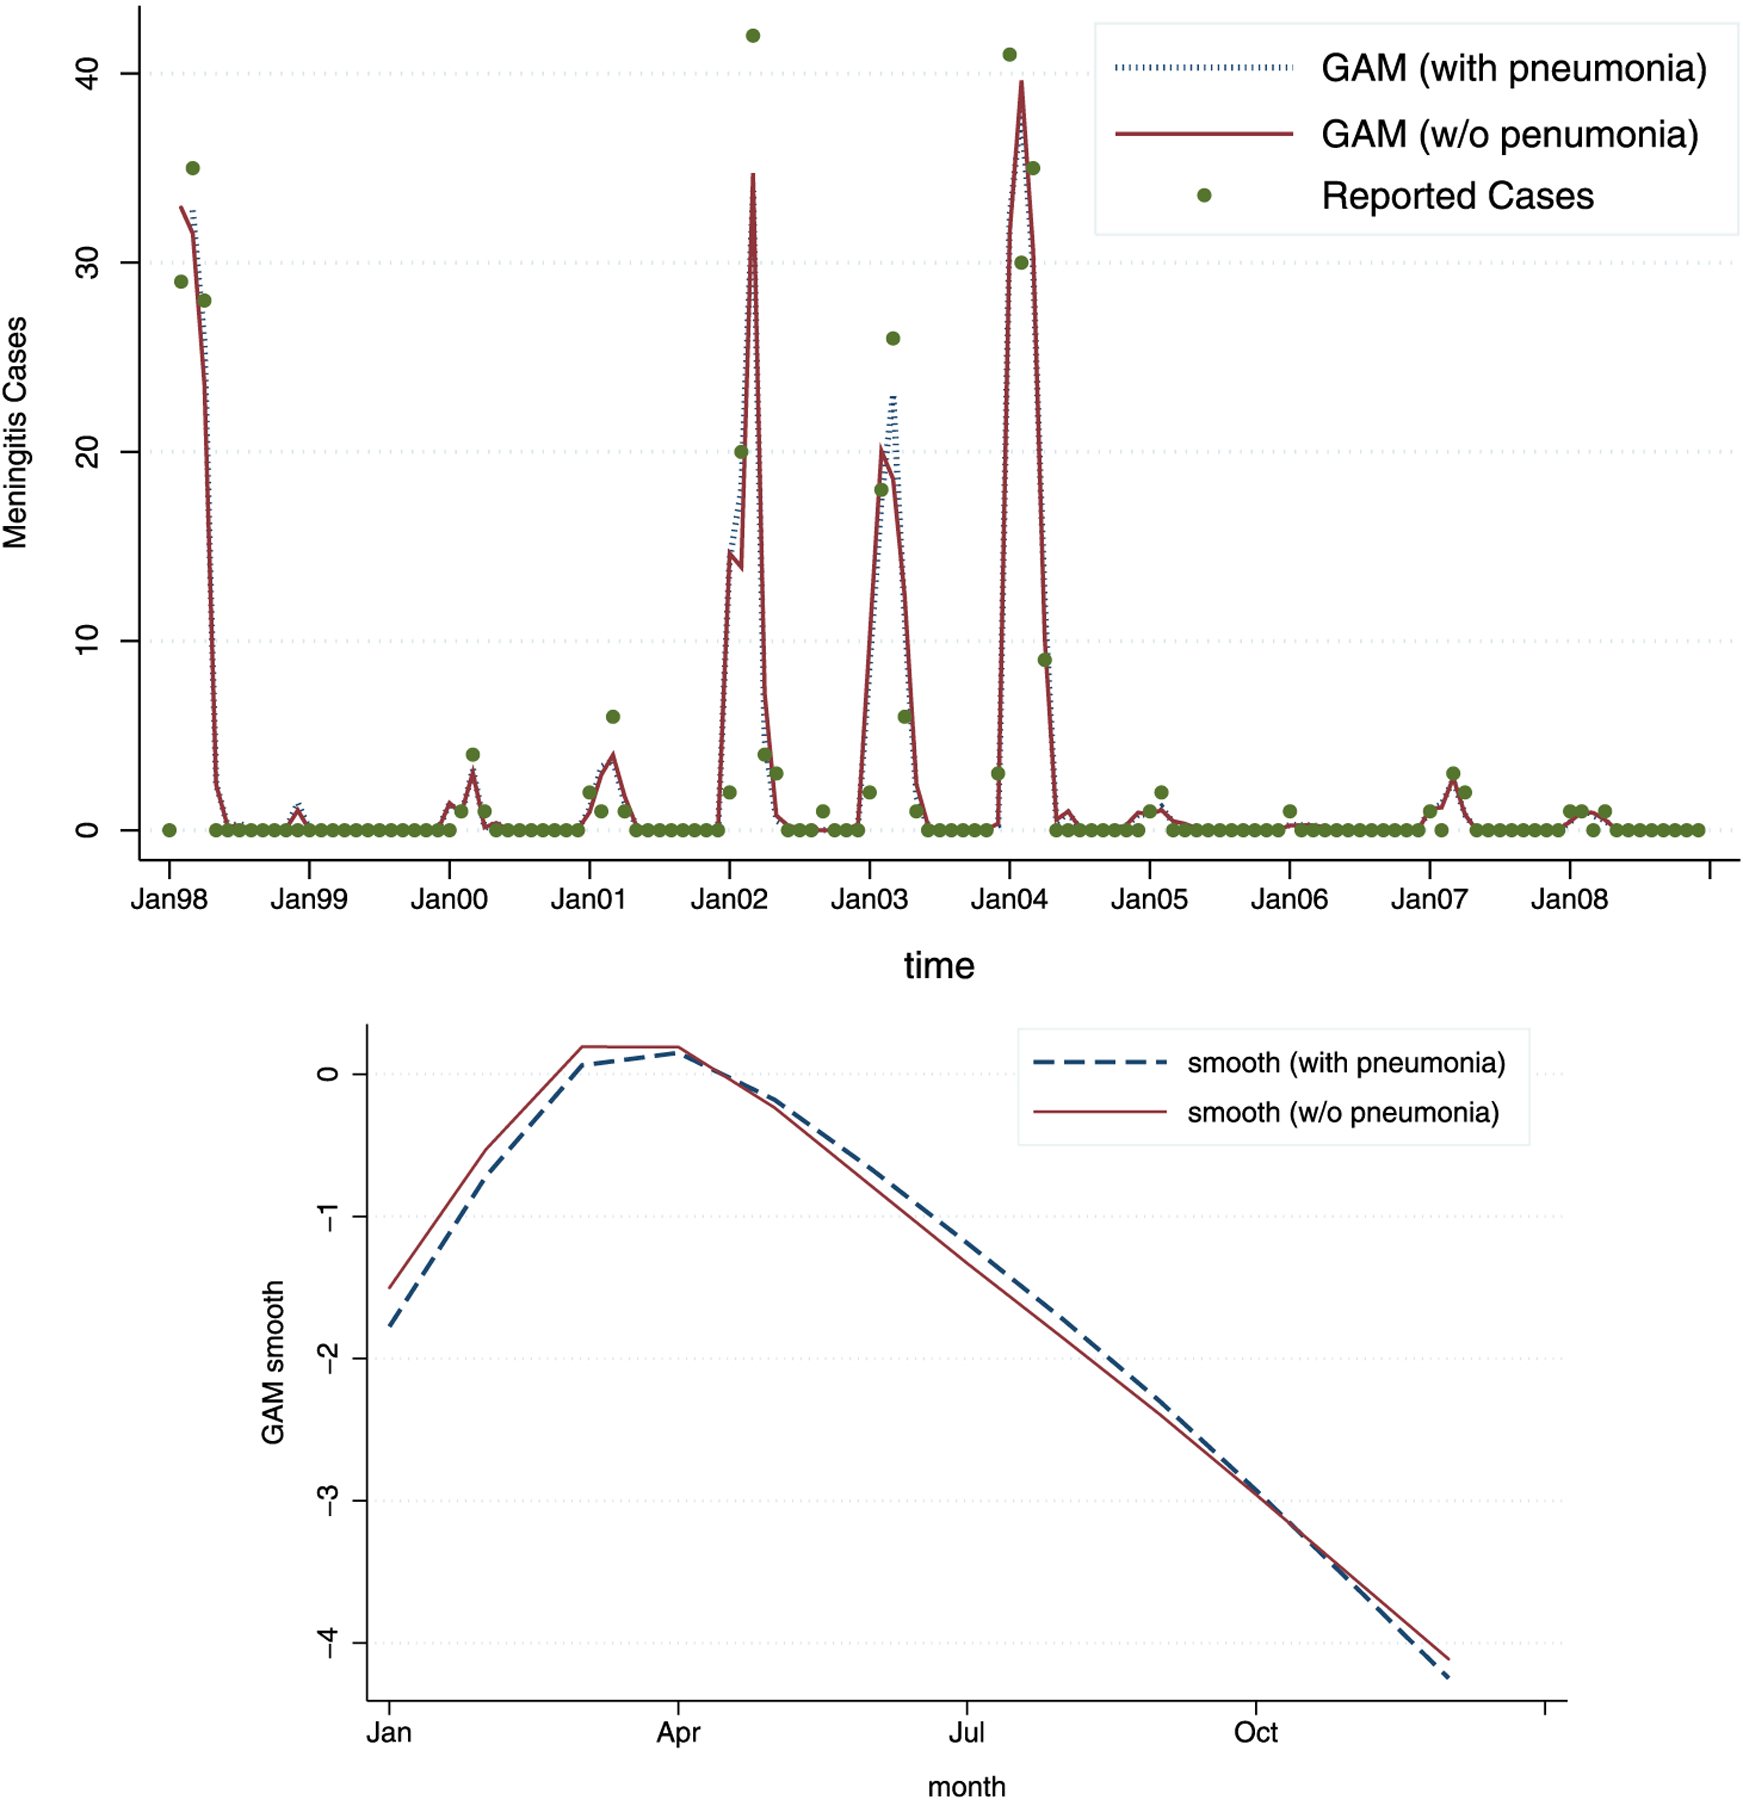
The fit for the 4-degree-of-freedom GAM with lagged predictors only: the model with pneumonia (dashed line) and without pneumonia (full line). As can be seen, the model with pneumonia added as a predictor shows slightly better fit. The estimated smooth functions of time, ĝ(t), across 12 months, show almost no difference.
4.4. Generalized Linear Model (GLM) Alternative
Given the GAM results above, it appears that a two-piece linear function might be a fairly decent approximation of g(t) in almost all different models. With such a relatively simple form of g(t), fitting a generalized linear model (GLM) might be a reasonable alternative. In a GLM, the function g(t) would not be modeled by splines any longer, but instead as a parametric (piece-wise linear) function of time, with one slope from January to March, and another slope from April to December.
The GLM model we employ is Poisson regression, with the log link, as before. The outcome, case counts, Yjt is again modeled as a Poisson distributed random variable with the mean μjt, where
| (2) |
Here, is a piece-wise linear function of time across the 12 months, with slope for the first three months (January through March) and slope α2 for the remainder of the year. This piece-wise function of time now captures the effect of unobserved time-varying confounders, somewhat less flexibly than g(t). The estimated main effects from the best GLM fit are shown in Table 4. This model is qualitatively similar to the previous models in this analysis, with one notable exception: here, the previous month’s rain appears more significant than the previous month’s minimum temperature. Given that the two variables are highly correlated, we keep the previous month’s rain variable and leave out minimum temperature. Model fit is shown in Figure 5, indicating little difference in the fit values from earlier models.
Table 4.
Estimates for two alternative generalized linear models: with pneumonia as a predictor and without.
| Without Pneumonia | With Pneumonia | |||||
|---|---|---|---|---|---|---|
| Predictor | Coef: | St. error: | z-stat: | Coef: | St. error: | z-stat: |
| January-March slope | 0.185 | 0.066 | 2.8 | 0.177 | 0.067 | 2.65 |
| April-December slope | −0.271 | 0.057 | −4.76 | −0.272 | 0.06 | −4.54 |
| Max temp (current month) | 0.413 | 0.066 | 6.27 | 0.414 | 0.068 | 6.12 |
| CO emissions (previous month) | 0.007 | 0.002 | 3.08 | 0.008 | 0.002 | 3.65 |
| Humidity at 3pm (previous month) | −0.027 | 0.016 | −1.67 | −0.033 | 0.017 | −1.94 |
| Rain (previous month) | −0.005 | 0.005 | −0.99 | −0.005 | 0.005 | −1.03 |
| Pneumonia cases (2 months ago) | – | – | – | 0.062 | 0.026 | 2.37 |
Figure 5.
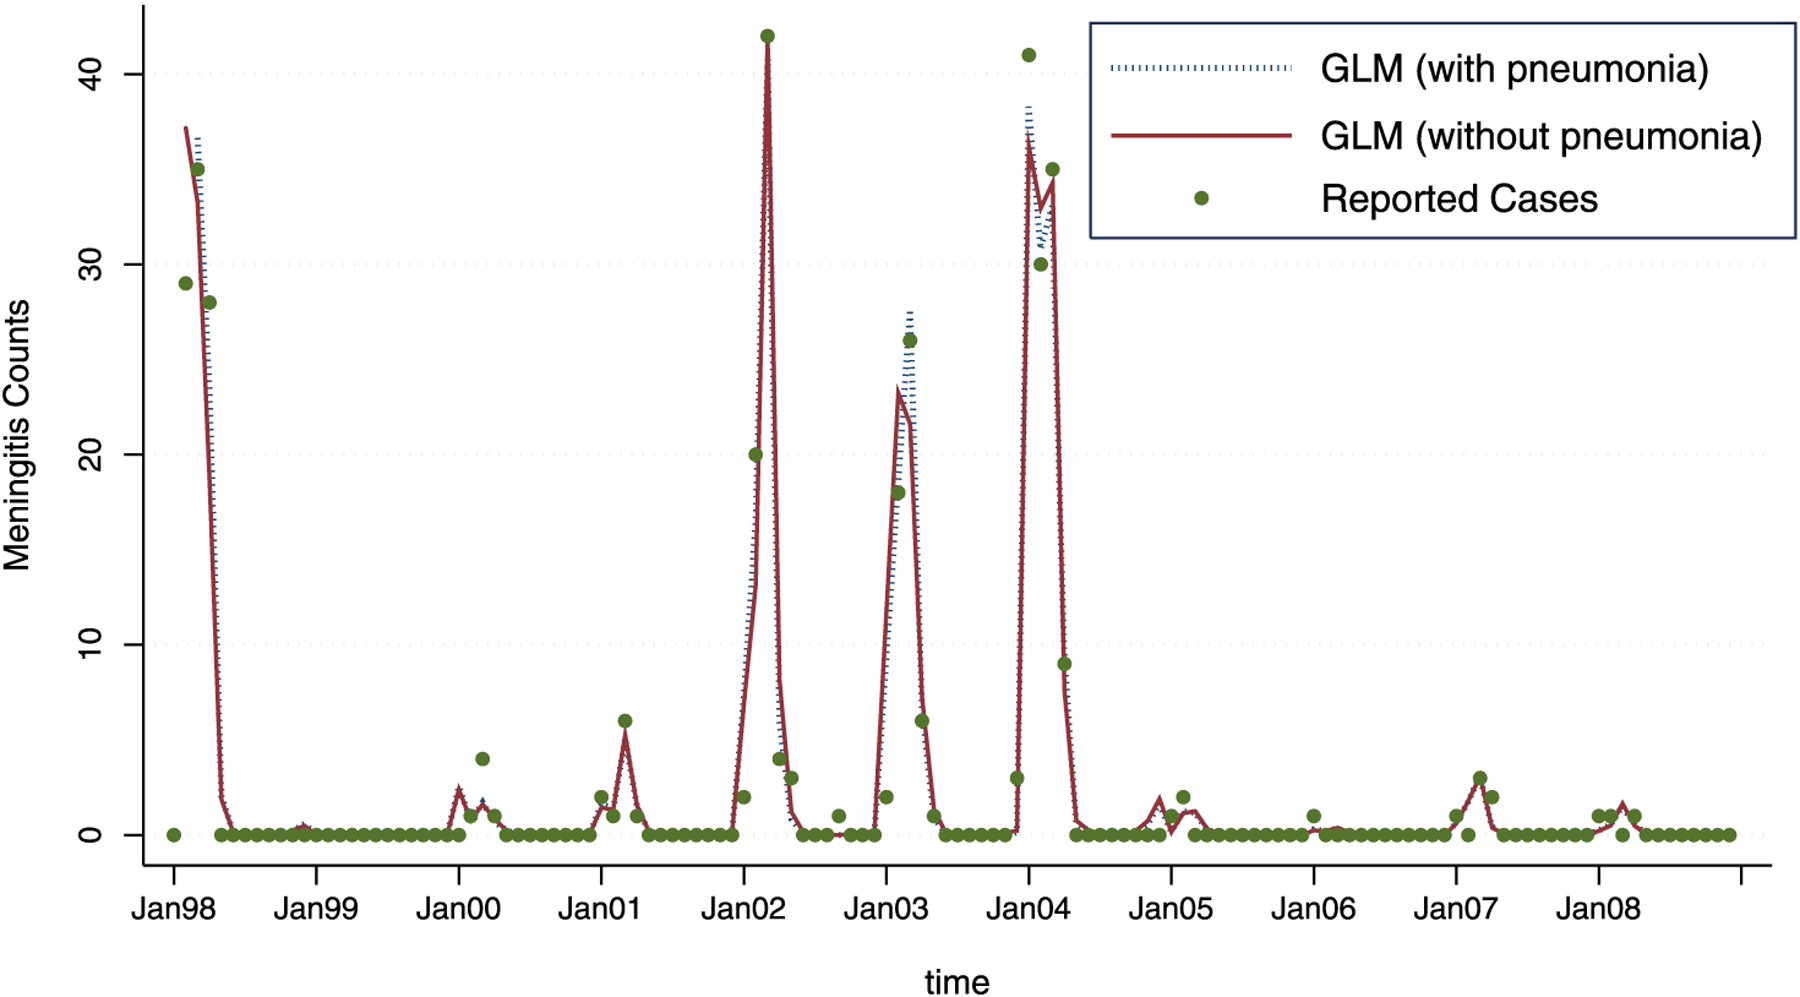
The GLM fit, with pneumonia (dashed line) and without pneumonia (full line). As can be seen, the model with pneumonia added as a predictor shows a slightly better fit.
4.5. Model without Weather and Pollution Predictors
The large span of the estimated year-specific intercepts and robustly good fit of the GAM and GLM models beg the question of whether the weather variables in fact contribute to our efforts to understand meningitis in a substantial way. To answer that question we looked at the model without any weather and pollution predictors—only the year-specific intercepts and the smooth function of time with 4 degrees of freedom. The deviance of this model was about 75 % higher than of the best reduced GAM model with weather predictors (presented in Table 2), and approximately 150 % higher than the full GAM model (presented in Table 1). When we added pneumonia counts, the deviance of that model was 45 % higher than of the best reduced GAM model with weather predictors, and approximately twice the deviance of the full GAM model.
The fitted values and g(t) for the two models without weather and pollution predictors are shown in Figure 6. As can be seen, the basic shape of the estimated g(t) functions is more pronounced though it remains qualitatively similar to the estimated g(t) from the full GAM model, capturing the seasonal behavior of meningitis. However, the fitted values for this model are not matching the observed meningitis counts as closely as before. In particular, the peaks are not well described, and three out of four large peaks are underestimated by approximately 10 % and 40 %. Weather and pollution seem to influence the severity of meningitis outbreaks in a consistent way from year to year, and this is particularly visible (as expected due to the nature of log-linear models) during large outbreaks.
Figure 6.
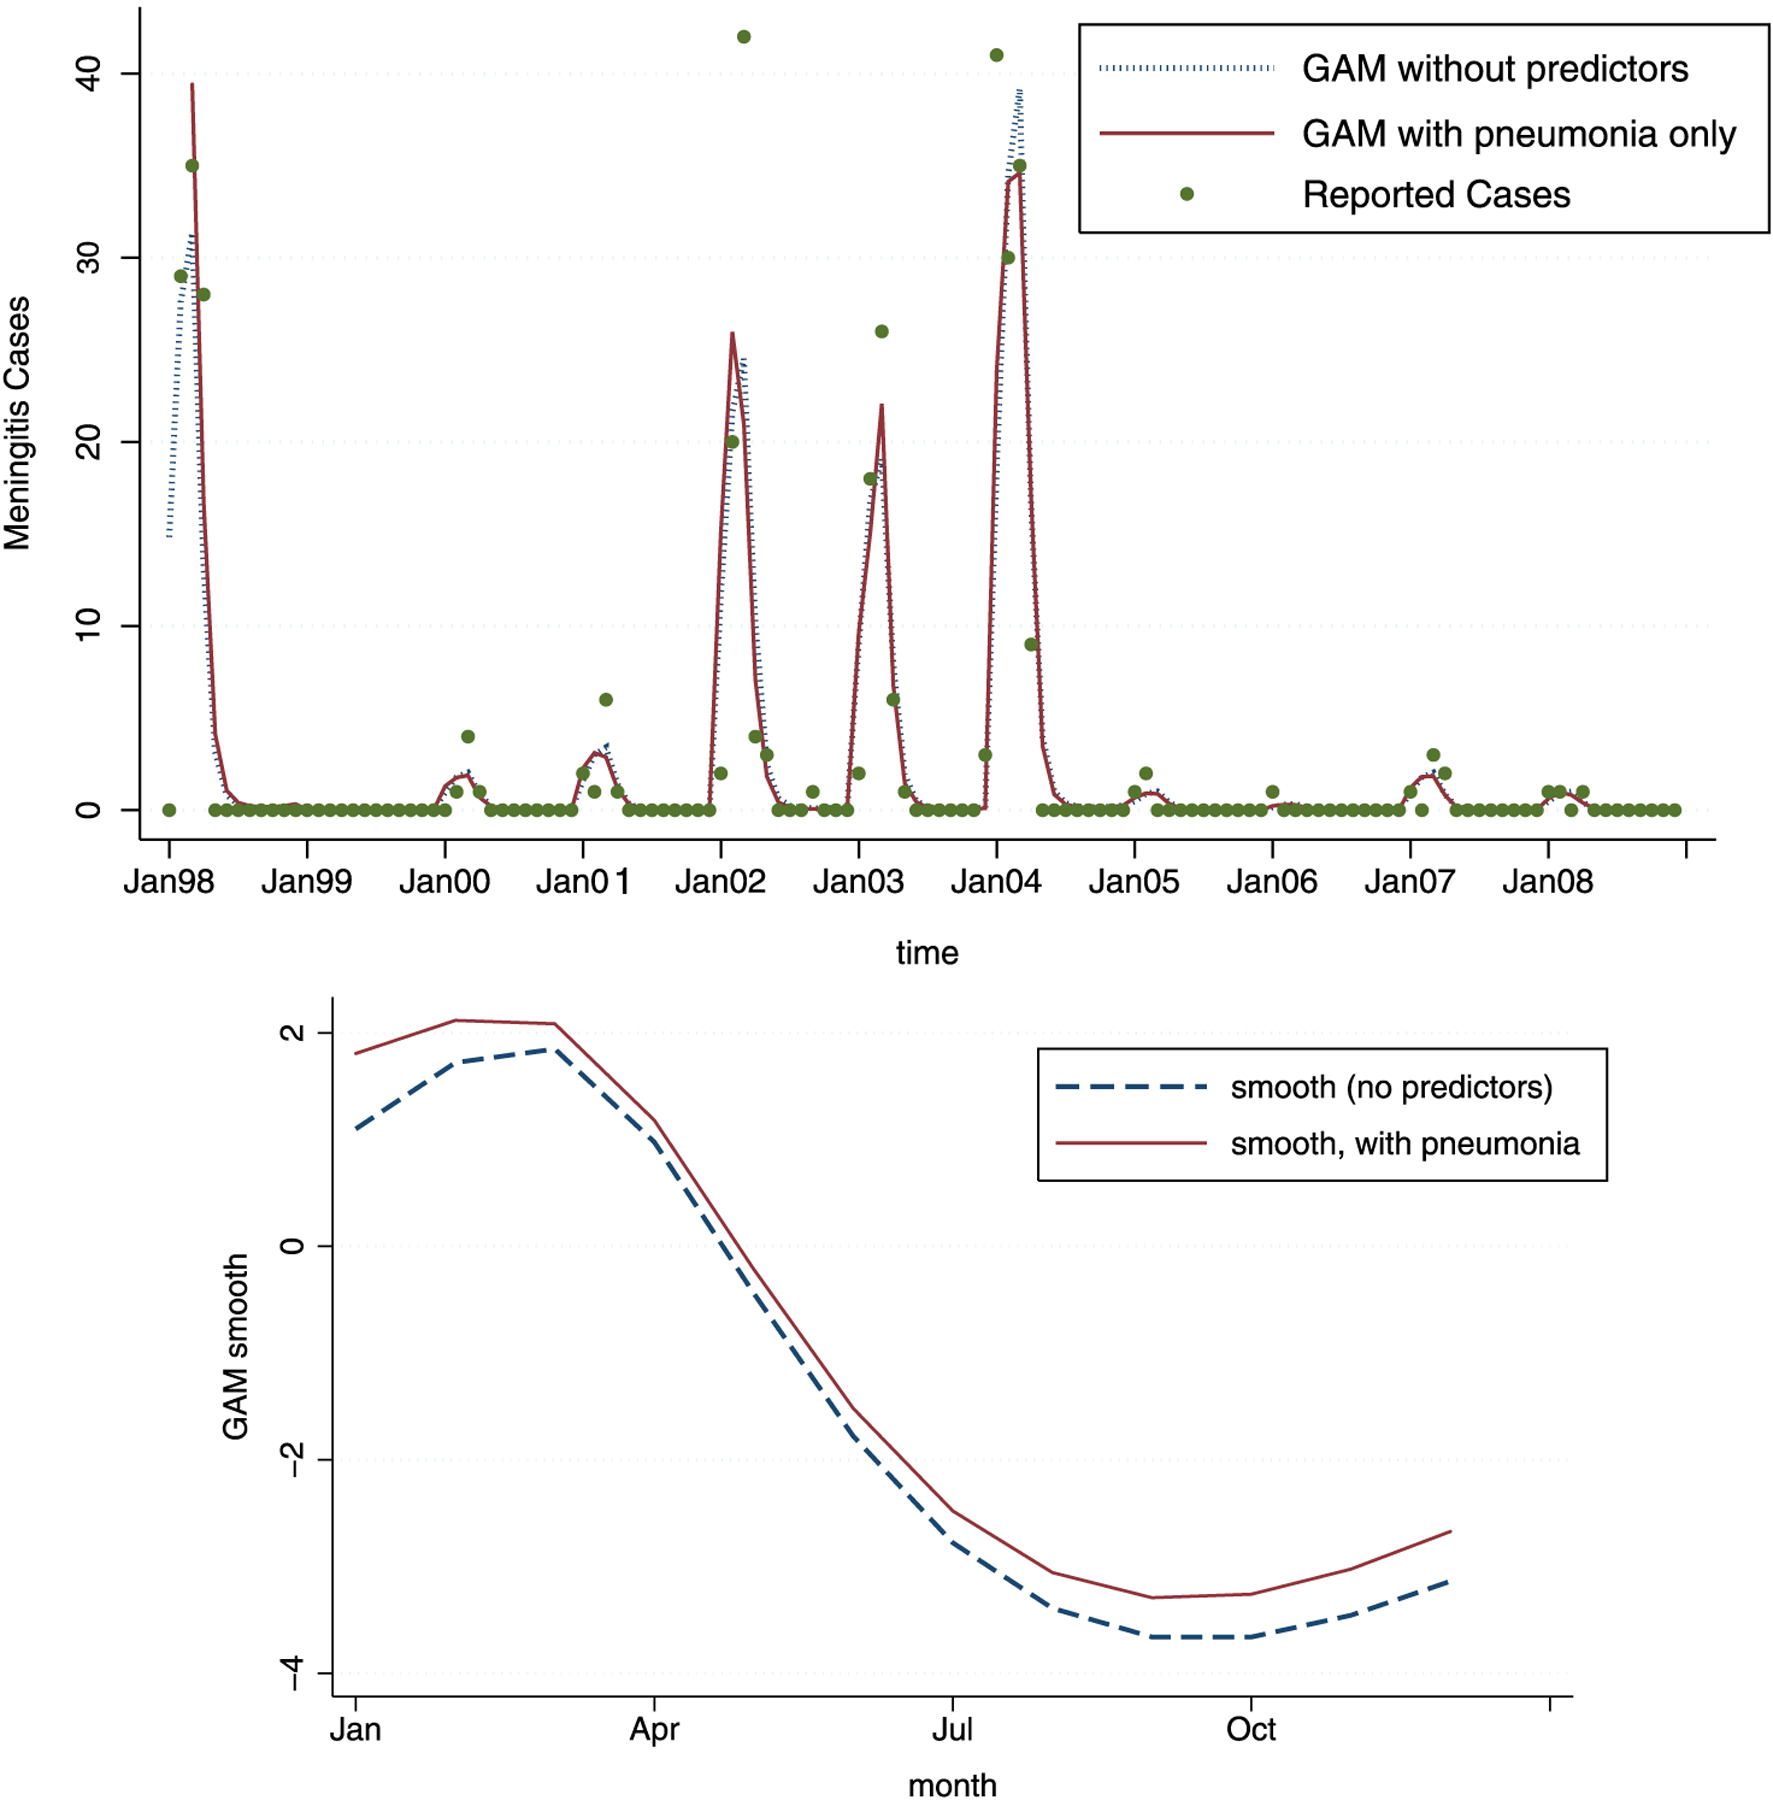
The GAM estimates for the model with 4 degrees of freedom, without any predictors (full line) and with pneumonia predictor added (dashed line). As can be seen, the model with pneumonia performs slightly better. Note that neither of the two models show as good of a fit as the models with weather and pollution predictors. The estimated smooth functions of time, ĝ(t) across 12 months, show minimal difference for the models with and without pneumonia.
5. DISCUSSION
In this paper we have carried out a generalized additive model analysis of meningitis outbreaks in Navrongo, Ghana, aiming to estimate in an unbiased way the effects of weather variables such as rain, relative humidity, temperature, and air quality variables including dust and CO emissions, on meningitis incidence.
The models adjusted for different degrees of time-related confounders, in order to examine the persistence of weather predictors under different amounts of confounding adjustment. All models pointed to the relevance of weather and pollution variables, and particularly persistent were the effects of current month’s average maximum temperature, previous month’s relative humidity, and previous month’s CO emissions due to fires. It appears that weather is robustly responsible for explaining some of the variation in meningitis counts, and its effect is, as expected due to the nature of log-linear models, especially visible during large outbreaks. Accounting for weather can improve our estimates of average laboratory-confirmed meningitis counts by up to 40 %.
Adjustment for the confounding variables is particularly relevant when evaluating possible strategies for intervention, and their costs and benefits. For example, with the estimate of the relative humidity effect, the expected reduction in meningitis incidence due specifically to intervention aimed at household mechanisms for increasing humidity, could be evaluated. Similarly, one could compare the expected benefits of that intervention with another aimed at decreasing dust and pollution via increasing household ventilation or via addition of cooking stoves with better combustion properties.
Note that in general, the generalized additive framework is not meant to be used for prediction of future epidemic size. These models are used to estimate the relative “net” impact of specific weather and pollution variables on the size of the epidemic, without the influence of confounders. Consequently, these models can be used to evaluate the impact of interventions on weather-related variables (such as decreasing the temperature and increasing relative humidity for example) on the expected meningitis incidence. They can also be used to assess the impact of climate change on the future meningitis disease outbreaks.
Our results indicate that interventions aimed at reducing temperature, dust, smoke and CO exposure, or increasing relative humidity and ventilation via some household intervention mechanism, may reduce the public health burden of meningitis outbreaks, especially during large outbreaks. These results are in agreement with empirical evidence: the people from rural Ghana recognize meningitis as a disease of “hot and dusty” days. However, although we have no concrete biological explanation for why current maximum temperature is so strongly associated with meningitis, the persistence of this relationship in a variety of models is noteworthy. Temperature may be a proxy for other variables such as food quality, weakened immunity, or perhaps a biological mechanism that is, as of yet, undocumented. In addition, it is possible that prolonged periods of high temperature may change individual behavior in ways that enhance meningitis spread. Further research is needed to shed light on mechanisms behind the observed temperature effect.
ACKNOWLEDGEMENTS
The support for this project was provided in part by Google.org. Unidata is funded by the National Science Foundation. Vanja Dukic also thanks NIH (U01 GM087729-3 and R21 DA027624-01) for partial support.
APPENDIX:
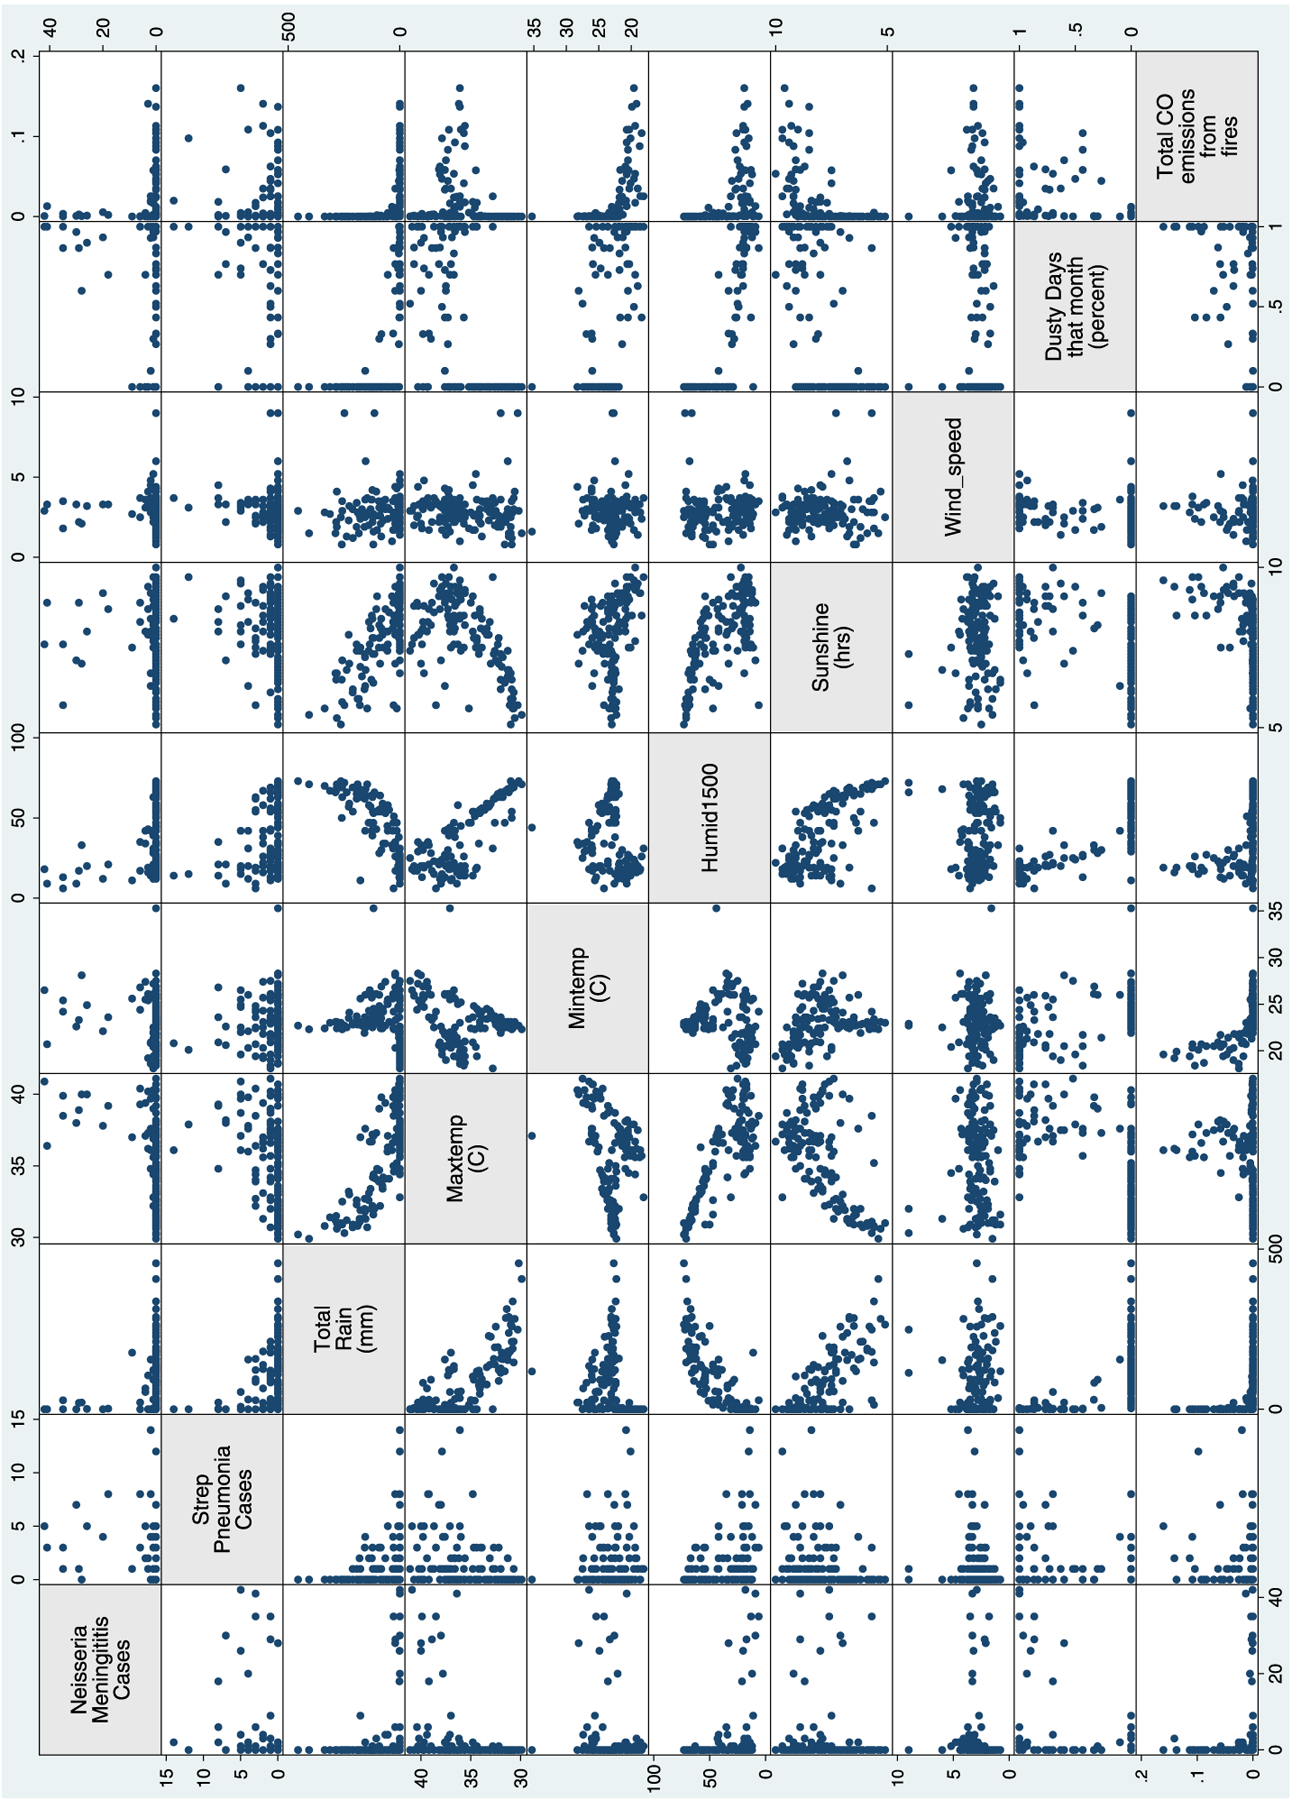
PAIRWISE RELATIONSHIPS AMONG NAVRONGO VARIABLES
Contributor Information
Vanja Dukić, Department of Applied Mathematics, University of Colorado, Boulder, CO, USA..
Mary Hayden, National Center for Atmospheric Research, Boulder, CO, USA..
Tom Hopson, National Center for Atmospheric Research, Boulder, CO, USA..
Andrew Monaghan, National Center for Atmospheric Research, Boulder, CO, USA..
Abudulai Adams Forgor, War Memorial Hospital, Navrongo, Ghana..
Patricia Akweongo, Navrongo Health Research Centre, Navrongo, Ghana..
Abraham Hodgson, Navrongo Health Research Centre, Navrongo, Ghana..
Christine Wiedinmyer, University Corporation for Atmospheric Research, Boulder, CO, USA..
Tom Yoksas, University Corporation for Atmospheric Research, Boulder, CO, USA..
Raj Pandya, University Corporation for Atmospheric Research, Boulder, CO, USA..
Madeleine C. Thomson, The International Research Institute, Columbia University, New York City, NY, USA..
Sylwia Trzaska, The International Research Institute, Columbia University, New York City, NY, USA..
REFERENCES
- Besancenot JP, Boko M, and Oke PC (1997), “Weather Conditions and Cerebrospinal Meningitis in Benin (Gulf of Guinea, West Africa),” European Journal of Epidemiology, 13 (7), 807–815. [DOI] [PubMed] [Google Scholar]
- Cheesbrough JS, Morse AP, and Green SDR (1995), “Meningococcal Meningitis and Carriage in Western Zaire—a Hypoendemic Zone Related to Climate,” Epidemiology and Infection, 114 (1), 75–92. [DOI] [PMC free article] [PubMed] [Google Scholar]
- Christensen JH, et al. (2007), “Regional Climate Projections,” in Climate Change 2007: The Physical Science Basis. Contribution of Working Group I to the Fourth Assessment Report of the Intergovernmental Panel on Climate Change, eds. Solomon S et al. , Cambridge: Cambridge University Press. [Google Scholar]
- Cuevas LE, et al. (2007), “Risk Mapping and Early Warning Systems for the Control of Meningitis in Africa,” Vaccine, 25, A12–A17. [DOI] [PubMed] [Google Scholar]
- Dominici F, Samet JM, and Zeger SL (2000), “Combining Evidence on Air Pollution and Daily Mortality from the 20 Largest US Cities: A Hierarchical Modeling Strategy,” Journal of the Royal Statistical Society, Series A, 163 (3), 263–284. [Google Scholar]
- Dominici F, McDermott A, and Hastie TJ (2004), “Improved Semiparametric Time Series Models of Air Pollution and Mortality,” Journal of the American Statistical Association, 99 (468), 938–948. [Google Scholar]
- Greenwood BM, Blakebrough IS, Bradley AK, Wali S, and Whittle HC (1984), “Meningococcal Disease and Season in Sub-Saharan Africa,” Lancet, 1, 1339–1342. [DOI] [PubMed] [Google Scholar]
- Greenwood BM, Greenwood AM, and Bradley AK, et al. (1987), “Factors Influencing the Susceptibility to Meningococcal Disease During an Epidemic in The Gambia, West Africa,” The Journal of Infectious Diseases, 14, 167–184. [DOI] [PubMed] [Google Scholar]
- Greenwood B (1999), “Meningococcal Meningitis in Africa,” Transactions of the Royal Society of Tropical Medicine and Hygiene, 93 (4), 341–353. [DOI] [PubMed] [Google Scholar]
- Hastie T, and Tibshirani R (1999), Generalized Additive Models, London: Chapman & Hall. [DOI] [PubMed] [Google Scholar]
- Hayden MH, Dalaba M, Awine T, Akweongo P, Hodgson A, Nyaaba G, Anesaba D, Pelzman J, and Pandya R (in preparation for submission to the AJTMH), “Knowledge, Attitudes and Practices Related to Meningitis in Northern Ghana.” [DOI] [PMC free article] [PubMed] [Google Scholar]
- Hodgson A, Smith T, Gagneux S, Adjuik M, Pluschke G, Kumasenu Mensah N, Binka F, and Genton B (2001), “Risk Factors for Meningococcal Meningitis in Northern Ghana,” Transactions of the Royal Society of Tropical Medicine and Hygiene, 95, 477–480. [DOI] [PubMed] [Google Scholar]
- Lapeyssonnie L (1963), “Cerebrospinal Meningitis in Africa,” Bulletin of the World Health Organization, 28, 3–114. [PMC free article] [PubMed] [Google Scholar]
- Leimkugel J, Hodgson A, Adams Forgor A, Pfluger V, Dangy JP, Smith T, Achtman M, Gagneux S, and Pluschke G (2007), “Clonal Waves of Neisseria Colonisation and Disease in the African Meningitis Belt: Eight-Year Longitudinal Study in Northern Ghana,” PLoS Medicine, 4 (3), 535–544. [DOI] [PMC free article] [PubMed] [Google Scholar]
- Molesworth AM, Cuevas L, and Thomson MC (2002), Forecasting Meningitis Epidemics in Africa, Liverpool: LSTM. [Google Scholar]
- Molesworth AM, Cuevas LE, Connor SJ, Morse AP, and Thomson MC (2003), “Environmental Risk and Meningitis Epidemics in Africa,” Emerging Infectious Diseases, 9 (10), 1287–1293. [DOI] [PMC free article] [PubMed] [Google Scholar]
- Moore PS, Reeves MW, Schwartz B, Gellin BG, and Broome CV (1989), “Intercontinental Spread of an Epidemic Group A Neisseria Meningitidis Strain,” Lancet, 2, 260–263. [DOI] [PubMed] [Google Scholar]
- Moore PS, Hierholzer J, and DeWitt W, et al. (1990), “Respiratory Viruses and Mycoplasma as Cofactors for Epidemic Group A Meningococcal Meningitis,” Journal of the American Medical Association, 264, 1271–1275. [PubMed] [Google Scholar]
- Moore P (1992), “Meningococcal Meningitis in Sub-Saharan Africa: A Model for the Epidemic Process,” Clinical Infectious Diseases, 14, 515–525. [DOI] [PubMed] [Google Scholar]
- Nyarko P, Wontuo P, Nazzar A, Phillips J, Ngom P, et al. (2002), Navrongo DSS Ghana. Population, Health and Survival at INDEPTH Sites, Accra (Ghana): INDEPTH, Vol. 1. Available at: http://www.indepth-network.net/dss_site_profiles/navrongo.
- Peng RD, Dominici F, and Louis TA (2006), “Model Choice in Time Series Studies of Air Pollution and Mortality,” Journal of the Royal Statistical Society, Series A, 169 (2), 179–203. [Google Scholar]
- Roberts L (2008), “An ill Wind, Bringing Meningitis,” Science, 320 (5884), 1710–1715. [DOI] [PubMed] [Google Scholar]
- Schwartz J (1994a), “Nonparametric Smoothing in the Analysis of Air Pollution and Respiratory Illness,” Canadian Journal of Statistics, 22, 471–487. [Google Scholar]
- Schwartz J(1994b), “PM10, Ozone, and Hospital Admissions for the Elderly in Minneapolis-St. Paul, Minnesota,” Archives of Environmental Health, 49, 366–374. [DOI] [PubMed] [Google Scholar]
- Sultan B et al. (2005a), “Climate Drives the Meningitis Epidemics Onset in West Africa,” PLoS Medicine, 2 (1), 43–49. [DOI] [PMC free article] [PubMed] [Google Scholar]
- Sultan B (2005b), “Influence of Climate Upon the Meningitis Onset in West Africa,” Medicine Sciences, 21 (5), 470–471. [DOI] [PubMed] [Google Scholar]
- Sultan B, Labadi K, Guegan JF, and Janicot S (2005c), “Climate Drives the Meningitis Epidemics Onset in West Africa,” PLoS Medicine, 2, e6. [DOI] [PMC free article] [PubMed] [Google Scholar]
- Sultan B, Chiapello I, and Aouam M, (2007), “Le Rôle du Climat et des Aérosols sur les Épidémies de Méningite en Afrique de l’Ouest,” Colloque MSG, 13–14, Dijon. [Google Scholar]
- Thomson MC, et al. (2006), “Potential of Environmental Models to Predict Meningitis Epidemics in Africa,” Tropical Medicine and International Health, 11 (6), 781–788. [DOI] [PubMed] [Google Scholar]
- Trenberth KE, et al. (2007), “Observations: Surface and Atmospheric Climate Change,” in Climate Change 2007: The Physical Science Basis. Contribution of Working Group I to the Fourth Assessment Report of the Intergovernmental Panel on Climate Change, eds. Solomon S et al. , Cambridge: Cambridge University Press. [Google Scholar]
- Wiedinmyer C, Akagi SK, Yokelson RJ, Emmons LK, Al-Saadi JA, Orlando JJ, and Soja AJ (2011), “The Fire Inventory from NCAR (FINN)—A High Resolution Global Model to Estimate the Emissions From Open Burning,” Geoscientific Model Development Discussions, 3, 2439–2476. [Google Scholar]
- Yaka P, Sultan B, Broutin H, Janicot S, Philippon S, and Fourquet N (2008), “Relationships Between Climate and Year-to-Year Variability in Meningitis Outbreaks: A Case Study in Burkina Faso and Niger,” International Journal of Health Geographics, 7, 34. [DOI] [PMC free article] [PubMed] [Google Scholar]
- Zibman C (2009), “Methods for Confounding Adjustment in Time Series Data: Applications to Short Term Effects of Air Pollution on Respiratory Health,” PhD Thesis, Department of Statistics, University of Chicago. [Google Scholar]