

Abstract
Purpose
The FitMáx© was developed as a questionnaire-based instrument to estimate Cardiorespiratory Fitness (CRF) expressed as oxygen uptake at peak exercise (VO2peak). Test–retest reliability is a clinometric measurement property, which defines stability over time if multiple measurements are performed (i.e. reliability). The present study aimed to assess the test–retest reliability of the FitMáx©-questionnaire in different patient groups.
Patients and methods
A total of 127 cardiac, pulmonary and oncology patients and healthy subjects aged 19–84 years who completed the questionnaire twice within an average of 18 days were included for analysis. Participants were in a stable clinical situation (no acute disease or participating in a training program). To determine the test–retest reliability, the Intraclass Correlation Coefficient (ICC) and Standard Error of the Measurement (SEM) was calculated between the first (T0) and second (T1) administration of the questionnaires.
Results
An excellent agreement was found between the FitMáx©-questionnaire scores at T0 and T1, with an ICC of 0.97 (SEM 1.91) in the total study population and an ICC ranging from 0.93 to 0.98 (SEM 1.52–2.27) in the individual patient groups.
Conclusion
The FitMáx©-questionnaire proves to be reliable and stable over time to estimate CRF of patients and healthy subjects.
Trial registration NTR (Netherlands Trial Register), NL8846. Registered 25 August 2020, https://trialsearch.who.int/Trial2.aspx?TrialID=NL8846
Supplementary Information
The online version contains supplementary material available at 10.1186/s41687-023-00682-9.
Keywords: Cardiorespiratory fitness, Patient-reported outcome, Questionnaire, Peak oxygen uptake, Cardiopulmonary exercise testing
Introduction
Cardiorespiratory fitness (CRF) is an important variable that influences several health outcomes including quality of life [1, 2]. Cardiopulmonary exercise testing (CPET) is the gold standard to objectively measure CRF expressed as the oxygen uptake at peak exercise (VO2peak) and is clinically used to determine the underlying cause of limitations in exercise capacity [3–5]. However, CPET is costly and labour-intensive, whereas Patient-Reported Outcome Measures (PROMs) are a simple, safe and cost-effective alternative, especially in repeated testing such as rehabilitation programs [6, 7].
Máxima Medical Centre (MMC) developed the FitMáx©-questionnaire (FitMáx), which consists of only three single-answer, multiple-choice questions [8]. The FitMáx was developed to estimate cardiorespiratory fitness expressed in VO2peak based on the self-reported maximum capacity of walking, stair climbing and cycling. The FitMáx scores are combined with subject’s age, sex and Body Mass Index (BMI) to estimate VO2peak. A previous validation study showed a strong correlation between VO2peak estimated by the FitMáx (FitMáx-VO2peak) and VO2peak measured with CPET (CPET-VO2peak), r = 0.94 (0.92‒0.95), ICC = 0.93 (0.91–0.95), and Standard Error of the Estimate (SEE) of 4.14 ml/kg/min. Moreover, FitMáx performed superiorly over commonly used questionnaires such as the Veterans Specific Activity Questionnaire (VSAQ) and Duke Activity Status Index (DASI) [8–10].
The clinical usefulness and applicability of PROMs depend on several clinometric properties including validity, responsiveness and reliability [11, 12]. Reliability is defined as the extent to which test results of subjects (whose condition has not changed) are the same over time. To assess such test–retest reliability of an instrument, repeated measures are performed under the same conditions [11, 13]. In this way it is possible to quantify the proportion of total variance in repeated measurements that is due to true differences in PROMs. The measurement error describes the systematic and random error of subjects’ results that are not caused by true changes in the construct to be measured [11].
The present short report aimed to assess the test–retest reliability of the FitMáx in four different groups (healthy subjects, pulmonary, oncology, and cardiac patients) and in the total study population.
Material and methods
Setting
Pulmonary, oncology, and cardiac patients were recruited prospectively in MMC, Veldhoven and Eindhoven, the Netherlands. Healthy subjects were included at Ancora Health in Eindhoven, the Netherlands. The authorized Medical Research Ethics Committee of the MMC has reviewed the study protocol and concluded that the rules laid down in the Medical Research Involving Human Subjects Act (also known by its Dutch abbreviation WMO), do not apply to this study (reference number N20.086). The study was registered as NL8846 in the Netherlands Trial Register.
Study population
Subjects were eligible for inclusion if they were aged ≥ 18 years, had a good command of the Dutch language, and if no change in CRF was expected within 31 days from enrollment date. During their visit to MMC or Ancora Health, cardiac and pulmonary patients and healthy subjects who were scheduled to perform CPET, either for medical reasons or as part of a health check, were asked to participate in a study about CRF questionnaires. The CPET protocol is extensively described in our validation study [8]. Since oncology patients do not perform CPET as part of standard care, they were included from the outpatient clinic of the sports department without performing a CPET. Oncology patients were not eligible for inclusion when they were undergoing active disease-specific treatments, potentially affecting their CRF, within the study period. Similar to our validation study, subjects were asked to complete the FitMáx, VSAQ and DASI questionnaires. The questionnaires were administered in a paper format twice to the same subject. Subjects were excluded from analysis if the FitMáx was incomplete, or if the period between T0 and T1 was > 31 days. To minimize a possible ‘subject expectancy effect’, it was explicitly not explained that this was a study to determine the test–retest reliability of these questionnaires. All participants received a second information letter and questionnaire (T1) two weeks after T0. We did not explicitly question participants about experienced change in CRF. All participants gave written informed consent to the use of their anonymized CPET and questionnaire data.
Statistical analysis
We performed a sample size calculation with an expected ICC of 0.85, a minimum acceptable ICC of 0.60 and two measurements per individual, requiring a sample size of n = 26 per subject group to achieve a power of 80%.
Statistical analyses were performed using R, version 4.2.1 (R Foundation for Statistical Computing, Vienna, Austria) [14]. Normality of data was tested using the Shapiro–Wilk test, and checked qualitatively by means of histograms and Q–Q plots. Descriptive statistics were provided for demographic characteristics and reported as mean ± standard deviation (SD) in case of normal distribution, and as median and interquartile range (IQR) otherwise. For categorical variables, we reported frequencies and corresponding percentages.
Pearson correlation coefficient (r) was used to evaluate the linear relationship between CPET-VO2peak and Questionnaire-VO2peak at T0 [15].
To evaluate the test–retest reliability of the questionnaires, the Intraclass Correlation Coefficient (ICC) with 95% confidence interval (95%-CI) was determined (Two Way Mixed, Absolute Agreement, single measurement) [16]. The Standard Error of the Measurement (SEM, see Additional file 1: equations) [17] is a measure related to ICC, but clinically easier to interpret (expressed in the same unit as of the measurement of interest (VO2peak)). The ICC and SEM were calculated between T0 and T1 for all questionnaires in all patient groups together, and for each patient group separately. An ICC < 0.50 indicates poor test–retest reliability, 0.50–0.75 indicates moderate test–retest reliability, 0.75–0.90 indicates good test–retest reliability, and > 0.90 indicates excellent test–retest reliability [16]. The higher the ICC, the lower the SEM and vice versa, but there is no standard measure for the SEM as it depends on the standard deviation of the data.
In addition, Bland–Altman plots were used to present systematic errors with 95% limits of agreement (95%-LoA), by plotting the difference between Questionnaire-VO2peak at T0 and T1 against the mean Questionnaire-VO2peak from T0 and T1 [18].
Results
In this study, 213 subjects participated. A total of 73 subjects did not return the T1-questionnaire, resulting in a response rate of 66%. 11 subjects returned it after > 31 days from T0 and, although we did not explicitly question, two subjects reported on paper to have changed CRF due to a COVID-19 infection and were excluded as well. As such, a total of 127 participants (84 men and 43 women) were included for analysis. The time between completing the questionnaires and CPET ranged from 11 to 31 days.
Since the data collection of some patient groups was completed sooner, we continued the data collection until a group of at least n = 26 was reached for every included patient group (pulmonary, oncology, cardiac and healthy subjects). The total study population’s age ranged from 19 to 84 years. Ancora Health included healthy subjects during the COVID-19 period, using viral filters (MicroGard II, Vyaire Medical GmbH) resulting in inaccurate data, as such we omitted VO2peak data of this group [19]. As mentioned before, oncology patients were included from the outpatient clinic and did not perform CPET as part of standard care. Therefore, we present the CPET data from the total group without the healthy subjects and oncology patients. In the so-obtained population, the median VO2peak was 21.94 (16.89–31.29; IQR) ml/kg/min, which is 94.1 (85.7–134.5)% of the predicted reference value for healthy Dutch persons of the same age and sex [20]. Anthropometrical data, CPET data and questionnaire data are presented in Tables 1 and 2. Data of VSAQ and DASI questionnaires can be found in Additional file 2: Table S1.
Table 1.
Participant characteristics
| Variable | Pulmonary patients | Oncology patients | Cardiac patients | Healthy subjects | Total population |
|---|---|---|---|---|---|
| n | 32 | 41 | 28 | 26 | 127 |
| Anthropometrical data | |||||
| Gender | |||||
| Male | 15 (46.9%) | 27 (65.9%) | 21 (75.0%) | 21 (80.8%) | 84 (66.1%) |
| Female | 17 (53.1%) | 14 (34.1%) | 7 (25.0%) | 5 (19.2%) | 43 (33.9%) |
| Age (years) | 64 (53–72) | 62 (51–73) | 64 (57–70) | 49 (38–60) | 62 (49–70) |
| Height (cm) | 170 (161–178) | 175 (169–183) | 175 (171–180) | 179 (173–183) | 175 (168–182) |
| Weight (kg) | 79 (71–91) | 81 (71–91) | 80 (72–93) | 73 (68–81) | 79.2 (69.7–90.2) |
| BMI (kg/m) | 27.6 (24.3–30.5) | 26.4 (22.8–29.5) | 26.1 (23.5–28.7) | 23.0 (22.0–25.0) | 25.3 (23.0–28.5) |
| COPD, GOLD classification | |||||
| None | 25 (78.1%) | 39 (95.1%) | 27 (96.4%) | 26 (100.0%) | 117 (92.1%) |
| GOLD I | 3 (9.4%) | 0 (0.0%) | 1 (3.6%) | 0 (0.0%) | 4 (3.1%) |
| GOLD II | 3 (9.4%) | 2 (4.9%) | 0 (0.0%) | 0 (0.0%) | 5 (3.9%) |
| GOLD III | 1 (3.1%) | 0 (0.0%) | 0 (0.0%) | 0 (0.0%) | 1 (0.8%) |
| GOLD IV | 0 (0.0%) | 0 (0.0%) | 0 (0.0%) | 0 (0.0%) | 0 (0.0%) |
| Use of β-blocker | |||||
| Yes, n (%) | 7 (21.9%) | 4 (9.8%) | 12 (42.9%) | 26 (100.0%) | 23 (18.1%) |
| No, n (%) | 25 (78.1%) | 37 (90.2%) | 16 (57.1%) | 0 (0.0%) | 104 (81.9%) |
| CPET data | |||||
| FEV1 (L) | 2.22 (1.83–3.24) | * | 3.35 (2.71–3.84) | † | 3.72 (2.79–4.83)‡ |
| FVC (L) | 3.10 (2.61–4.08) | * | 4.14 (3.67–4.92) | † | 2.95 (2.12–3.76)‡ |
| Maximal workload (W) | 106 (76–181) | * | 173 (144–274) | † | 143 (94–227.5)‡ |
| VO2peak (ml/kg/min) | 17.47 (15.91–27.81) | * | 24.92 (20.80–40.23) | † | 21.94 (16.89–31.29)‡ |
| HRpeak (beat/min) | 142 (129–158) | * | 153 (124–172) | † | 148 (126–164) ‡ |
| RER (VCO2/VO2) | 1.08 (0.98–1.13) | * | 1.12 (1.07–1.21) | † | 1.10 (1.02–1.16)‡ |
| VO2peak reference^ (ml/kg/min) | 26.76 (20.20–32.52) | 30.25 (25.32–35.12) | 32.86 (26.78–35.94) | 40.16 (36.10–45.50) | 32.53 (25.32–38.05) |
| % of the reference VO2peak | 83.0 (66.8–107.2) | * | 89.6 (73.3–117.1) | † | 94.1 (85.7–134.5)‡ |
Results are displayed as n (%) and as median (IQR)
Missing information, number of subjects: FEV1, 1; FVC, 1
cm centimetres, COPD chronic obstructive pulmonary disease, CPET cardiopulmonary exercise testing, FEV1 forced expiratory volume in 1s, FVC forced vital capacity, GOLD Global initiative for chronic obstructive lung disease, HR heartrate, kg kilograms, kg/m2 kilograms per square meter, L litres, min minutes, ml millilitres, n number of subjects, RER respiratory exchange ratio, T0 baseline measurement, T1 second measurement, VO2peak peak oxygen uptake, W watts
*Oncology patients did not perform a CPET
†Most subjects (unknown number) in the healthy population performed a CPET with a viral filter during the COVID-19 period, resulting in unreliable CPET/spirometry parameters. To prevent confusion, we chose to omit these variables
‡Oncology patients excluded. Moreover, most subjects (unknown number) in the healthy population performed a CPET with a viral filter during the COVID-19 period, resulting in unreliable CPET parameters. Given this inaccuracy, the total group for this variable is only based on pulmonary and cardiac patients
^The prediction model for VO2peak of the LowLands Fitness Registry was used as a reference value [20]
Table 2.
Intraclass correlations of the questionnaires between T0 and T1
| Variable | Pulmonary patients | Oncology patients | Cardiac patients | Healthy subjects | Total population |
|---|---|---|---|---|---|
| n | 32 | 41 | 28 | 26 | 127 |
| FitMáx | 0.96 (0.92–0.98) | 0.93 (0.88–0.96) | 0.98 (0.96–0.99) | 0.94 (0.88–0.97) | 0.97 (0.96–0.98) |
| VSAQ | 0.90 (0.81–0.95) | 0.95 (0.90–0.97) | 0.89 (0.78–0.95) | 0.83 (0.67–0.92) | 0.94 (0.92–0.96) |
| DASI | 0.84 (0.68–0.92) | 0.87 (0.77–0.93) | 0.95 (0.91–0.98) | $ | 0.90 (0.85–0.93) $ |
The ICC is presented as its output with 95%-CI
DASI; Duke Acitivity Status Index, VSAQ; Veterans Specific Activity Questionnaire
$As known, the DASI has a ceiling effect, resulting in the maximal score in almost all healthy subjects preventing accurate examination of the (intraclass) correlation. As such, data of the DASI for healthy subjects are omitted for analysis
The FitMáx-VO2peak strongly correlated (r = 0.94 (0.91–0.97); 3.70 SEE ml/kg/min) with CPET-VO2peak. The correlation of the VSAQ and DASI with CPET-VO2peak was lower (r = 0.85 (0.76–0.91); 5.89 SEE ml/min/kg and r = 0.76 (0.63–0.85); 6.99 SEE ml/min/kg respectively), as was expected from the results of the validation study [8].
Test–retest reliability
The ICC’s and corresponding 95%-CI for each patient group are displayed in Table 2. The ICC of the FitMáx-VO2peak between T0 and T1 in the total population, was 0.97 (0.96–0.98). As a sensitivity analysis, we performed our ICC analysis in a two-way model examining potential systematic difference and found similar results, as expected. We found similar high ICC values in the VSAQ [0.94 (0.92–0.96)] and DASI [0.90 (0.85–0.93)] (more information in Additional file 2: Table S1). A Bland–Altman plot is provided in Fig. 1 (Additional file 3: Figure S1 for all questionnaires) showing the difference between the two values of FitMáx-VO2peak at T0 and T1 against their mean. The mean difference was − 0.39 (95%-LoA − 5.68 to 4.84 ml/kg/min), 0.31 (95%-LoA − 8.75 to 9.37) and 0.20 (95%-LoA − 5.56 to 5.96) for FitMáx, VSAQ and DASI respectively.
Fig. 1.
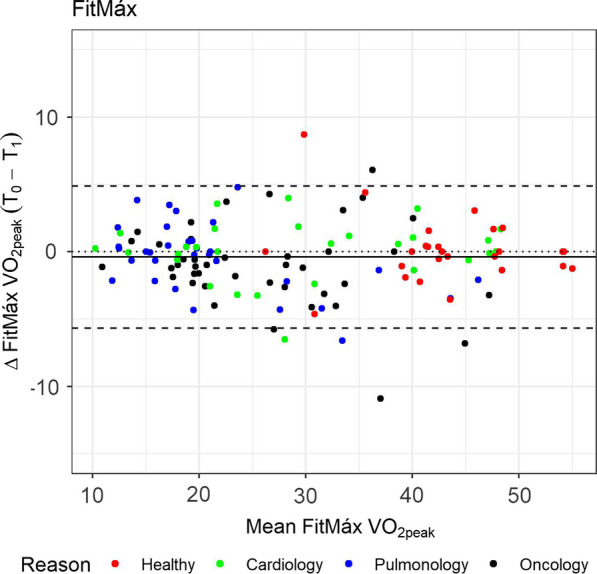
Bland–Altman plot for the FitMáx questionnaire. Notes The colors indicate the reason of the CPET visit. The dashed line represent the limits of agreement (− 1.96 to 1.96 SD). The solid line represents bias and the dotted line is the zero bias line
Discussion
The use of PROMs to assess CRF seems a simple, safe and cost-effective alternative for objective measurement using CPET in clinical settings [7]. The applicability of such PROMs collected via self-reported questionnaires depends upon several clinometric properties. An important aspect in the validation of a new questionnaire is the test–retest reliability. The FitMáx showed an excellent test–retest reliability between the VO2peak estimated at T0 and T1, with an ICC of 0.97 (0.96–0.98; IQR) in the total population. In the different patient groups the ICC ranged from 0.93 to 0.98 for FitMáx, 0.83–0.95 for VSAQ and 0.84–0.95 for DASI. The ICC (and thus SEM) support the precision and reliability of the FitMáx and VSAQ and DASI.
A study by Ravani et al. [21] assessed the test–retest reliability of the DASI. The study was performed in pre‐dialysis patients and patients who received a kidney transplant, and obtained an ICC of 0.71 and 0.81, respectively. These ICC values were lower than the ICC value(s) we found in the current study. This difference may be caused by the 6‐month window they used in their study, which could have resulted in true CRF changes and therefore lower reliability [21].
Strengths
The strength of the current study lies in the diverse study population. We initially included healthy subjects, oncology, pulmonary, and cardiac patients. Although oncology patients and healthy subjects did not perform (valid) CPET, a wide range of VO2peak values was observed in the current study population. The VO2peak ranged from (extremely) low to above average [21.94 (9.8–53.3)]. The FitMáx proves to be widely applicable in a clinical population, with both low and high VO2peak. Moreover, the ICC values of the FitMáx show little variance in the several subject groups. Therefore we can conclude that the ICC is independent of the CPET-VO2peak and the different patient groups to estimate CRF. At last, we ensured minimized ‘subject expectancy effect’ as the participants were not told that this study aimed to determine the test–retest reliability of the FitMáx, but that they could possibly be approached a second time for the purpose of this study.
Clinical applicability
The FitMáx is an inexpensive tool with low burden for subjects to assess CRF. Moreover, the questionnaire proves to be effective in various populations and provides information on daily life activities in several dimensions (intensity, frequency and duration). The current study shows that the FitMáx is reliable to assess CRF over time when no change in CRF has occurred. This makes FitMáx a useful tool to assess self-reported CRF among patients and healthy subjects in clinical settings.
Limitations
The study reached a response rate of only 66%. This might be explained by the assumption of patients that they already completed the exact same questionnaires before. The test–retest period used in the current study was on average 18 days, which could have been too short to prevent subjects from remembering the response of the FitMáx from memory. However, following recommendations, we have deliberately chosen for this short recall period in order to reduce reporting error in estimates of CRF due to fluctuating experienced physical fitness, especially in patients [2, 22]. The small sample size prohibited statistical testing to compare the ICC between questionnaires. Although inspection of the ICC in supplementary material might suggest a higher reproducibility for FitMáx in most patient groups, all three questionnaire revealed high ICC values. This possible difference may not be statistically or clinically relevant.
Conclusion
The FitMáx proves to be highly reliable in repeated measures to assess CRF of patients with different conditions and healthy subjects, when no change in CRF was expected. This increases the applicability and clinical usefulness of the FitMáx.
Supplementary Information
Additional file 1: Equations used to calculate the Standard Error of the Estimate (SEE) and the Standard Error of the Measurement (SEM).
Additional file 2: Table S1. Questionnaire data between T0 and T1.
Additional file 3: Fig. S1. A–C Bland-Altman plot for the FitMáx, VSAQ and DASI questionnaire. Notes: The colors indicate the reason of the CPET visit. The dashed line represent the limits of agreement (− 1.96 to 1.96 SD). The solid line represents bias and the dotted line is the zero bias line.
Acknowledgements
We would like to thank B. Dörssers and J. Verheij for their contribution to this research. We would also like to thank Richard Post for answering our statistical questions.
Abbreviations
- BMI
Body mass index
- cm
Centimetres
- COPD
Chronic obstructive pulmonary disease
- CPET
Cardiopulmonary exercise testing
- CRF
Cardiorespiratory fitness
- DASI
Duke activity status index
- FEV1
Forced expiratory volume in 1s
- FVC
Forced vital capacity
- FitMáx
FitMáx©-questionnaire
- GOLD
Global initiative for chronic obstructive lung disease
- HR
Heartrate
- ICC
Intraclass correlation coefficient
- IQR
Interquartile range
- kg
Kilograms
- kg/m2
Kilograms per square meter
- L
Liters
- m
Meters
- min
Minutes
- ml
Milliliters
- MMC
Máxima medical centre
- N
Number of subjects
- PROMs
Patient-reported outcome measures
- r
Pearson’s correlation
- RER
Respiratory exchange ratio
- SD
Standard deviation
- SEE
Standard error of the estimate
- SEM
Standard error of the measurement
- T0
Baseline measurement
- T1
Second measurement
- VO2peak
Oxygen uptake at peak exercise
- VSAQ
Veterans Specific Activity Questionnaire
- W
Watts
- 95%-CI
95% Confidence interval
- 95%-LoA
95% Limits of Agreement
Author contributions
RM was involved in study design, data collection, composing the database, statistical analysis and was a major contributor in writing the manuscript. GS was involved in study design and writing the manuscript. MR was involved in study design, statistical analysis and writing the manuscript. NEPB was involved in study design and writing the manuscript. HHCMS was involved in study design and writing the manuscript. MH was involved in study design, data collection, composing the database, statistical analysis and was a major contributor in writing the manuscript. All authors read and approved the final manuscript.
Funding
Not applicable.
Availability of data and materials
The datasets used and/or analysed during the current study are available from the corresponding author on reasonable request.
Declarations
Ethics approval and consent to participate
The authorized Medical Research Ethics Committee of the MMC has reviewed the study protocol and concluded that the rules laid down in the Medical Research Involving Human Subjects Act (also known by its Dutch abbreviation WMO), do not apply to this study (reference number N20.086). All participants gave written informed consent to the use of their anonymized CPET and questionnaire data.
Consent for publication
Not applicable.
Competing interests
The authors report no conflicts of interest in this work.
Footnotes
Publisher's Note
Springer Nature remains neutral with regard to jurisdictional claims in published maps and institutional affiliations.
References
- 1.Campbell KL, Winters-Stone KM, Wiskemann J, et al. Exercise guidelines for cancer survivors: consensus statement from international multidisciplinary roundtable. Med Sci Sports Exerc. 2019;51(11):2375–2390. doi: 10.1249/MSS.0000000000002116. [DOI] [PMC free article] [PubMed] [Google Scholar]
- 2.Ross R, Blair SN, Arena R, et al. Importance of assessing cardiorespiratory fitness in clinical practice: a case for fitness as a clinical vital sign: a scientific statement from the American Heart Association. Circulation. 2016;134(24):e653–e699. doi: 10.1161/CIR.0000000000000461. [DOI] [PubMed] [Google Scholar]
- 3.ATS/ACCP Statement on cardiopulmonary exercise testing Am J Respir Crit Care Med. 2003;167(2):211–277. doi: 10.1164/rccm.167.2.211. [DOI] [PubMed] [Google Scholar]
- 4.American College of Sports M, Riebe D, Ehrman JK, Liguori G, Magal M. ACSM's guidelines for exercise testing and prescription. 2018.
- 5.Albouaini K, Egred M, Alahmar A, Wright DJ. Cardiopulmonary exercise testing and its application. Postgrad Med J. 2007;83(985):675–682. doi: 10.1136/hrt.2007.121558. [DOI] [PMC free article] [PubMed] [Google Scholar]
- 6.Chevalier L, Kervio G, Doutreleau S, et al. The medical value and cost-effectiveness of an exercise test for sport preparticipation evaluation in asymptomatic middle-aged white male and female athletes. Arch Cardiovasc Dis. 2017;110(3):149–156. doi: 10.1016/j.acvd.2016.06.001. [DOI] [PubMed] [Google Scholar]
- 7.Deshpande PR, Rajan S, Sudeepthi BL, Abdul Nazir CP. Patient-reported outcomes: a new era in clinical research. Perspect Clin Res. 2011;2(4):137–144. doi: 10.4103/2229-3485.86879. [DOI] [PMC free article] [PubMed] [Google Scholar]
- 8.Meijer R, van Hooff M, Papen-Botterhuis NE, et al. Estimating VO2peak in 18–90 year-old adults: development and validation of the FitMax(c)-questionnaire. Int J Gen Med. 2022;15:3727–3737. doi: 10.2147/IJGM.S355589. [DOI] [PMC free article] [PubMed] [Google Scholar]
- 9.Hlatky MA, Boineau RE, Higginbotham MB, et al. A brief self-administered questionnaire to determine functional capacity (the Duke Activity Status Index) Am J Cardiol. 1989;64(10):651–654. doi: 10.1016/0002-9149(89)90496-7. [DOI] [PubMed] [Google Scholar]
- 10.Myers J, Do D, Herbert W, Ribisl P, Froelicher VF. A nomogram to predict exercise capacity from a specific activity questionnaire and clinical data. Am J Cardiol. 1994;73(8):591–596. doi: 10.1016/0002-9149(94)90340-9. [DOI] [PubMed] [Google Scholar]
- 11.Mokkink LB, Terwee CB, Patrick DL, et al. The COSMIN study reached international consensus on taxonomy, terminology, and definitions of measurement properties for health-related patient-reported outcomes. J Clin Epidemiol. 2010;63(7):737–745. doi: 10.1016/j.jclinepi.2010.02.006. [DOI] [PubMed] [Google Scholar]
- 12.Mokkink LB, Terwee CB, Patrick DL, et al. The COSMIN checklist for assessing the methodological quality of studies on measurement properties of health status measurement instruments: an international Delphi study. Qual Life Res. 2010;19(4):539–549. doi: 10.1007/s11136-010-9606-8. [DOI] [PMC free article] [PubMed] [Google Scholar]
- 13.Qin S, Nelson L, McLeod L, Eremenco S, Coons SJ. Assessing test-retest reliability of patient-reported outcome measures using intraclass correlation coefficients: recommendations for selecting and documenting the analytical formula. Qual Life Res. 2019;28(4):1029–1033. doi: 10.1007/s11136-018-2076-0. [DOI] [PMC free article] [PubMed] [Google Scholar]
- 14.R: A Language and Environment for Statistical Computing [computer program]. Version 4.2.1.: R Foundation for Statistical Computing; 2022.
- 15.Lane DM. Standard Error of the Estimate. onlinestatbook. https://onlinestatbook.com/2/regression/accuracy.html. Accessed 23-03-2023.
- 16.Koo TK, Li MY. A guideline of selecting and reporting intraclass correlation coefficients for reliability research. J Chiropr Med. 2016;15(2):155–163. doi: 10.1016/j.jcm.2016.02.012. [DOI] [PMC free article] [PubMed] [Google Scholar]
- 17.Weir JP. Quantifying test-retest reliability using the intraclass correlation coefficient and the SEM. J Strength Cond Res. 2005;19(1):231–240. doi: 10.1519/15184.1. [DOI] [PubMed] [Google Scholar]
- 18.Bland JM, Altman DG. Statistical methods for assessing agreement between two methods of clinical measurement. Lancet. 1986;1(8476):307–310. doi: 10.1016/S0140-6736(86)90837-8. [DOI] [PubMed] [Google Scholar]
- 19.Marques MS, Fonseca A, Lima R, Ladeira I, Gomes J, Guimarães M. Effect of a viral filter on cardiopulmonary exercise testing. Pulmonology. 2022;28(2):140–141. doi: 10.1016/j.pulmoe.2021.07.006. [DOI] [PMC free article] [PubMed] [Google Scholar]
- 20.van der Steeg GE, Takken T. Reference values for maximum oxygen uptake relative to body mass in Dutch/Flemish subjects aged 6–65 years: the LowLands Fitness Registry. Eur J Appl Physiol. 2021;121(4):1189–1196. doi: 10.1007/s00421-021-04596-6. [DOI] [PMC free article] [PubMed] [Google Scholar]
- 21.Ravani P, Kilb B, Bedi H, Groeneveld S, Yilmaz S, Mustata S. The Duke Activity Status Index in patients with chronic kidney disease: a reliability study. Clin J Am Soc Nephrol. 2012;7(4):573–580. doi: 10.2215/CJN.07990811. [DOI] [PubMed] [Google Scholar]
- 22.Matthews CE, Moore SC, George SM, Sampson J, Bowles HR. Improving self-reports of active and sedentary behaviors in large epidemiologic studies. Exerc Sport Sci Rev. 2012;40(3):118–126. doi: 10.1097/JES.0b013e31825b34a0. [DOI] [PMC free article] [PubMed] [Google Scholar]
Associated Data
This section collects any data citations, data availability statements, or supplementary materials included in this article.
Supplementary Materials
Additional file 1: Equations used to calculate the Standard Error of the Estimate (SEE) and the Standard Error of the Measurement (SEM).
Additional file 2: Table S1. Questionnaire data between T0 and T1.
Additional file 3: Fig. S1. A–C Bland-Altman plot for the FitMáx, VSAQ and DASI questionnaire. Notes: The colors indicate the reason of the CPET visit. The dashed line represent the limits of agreement (− 1.96 to 1.96 SD). The solid line represents bias and the dotted line is the zero bias line.
Data Availability Statement
The datasets used and/or analysed during the current study are available from the corresponding author on reasonable request.