Abstract
Aim: Gastric cancer (GC) has a high incidence and poor prognosis. Senescence genes are suggested to participate in immune cell infiltration, thus affecting the immunotherapy of GC. In this research, we established a senescence-related GC model to explore and verify the role of senescence genes in the prognosis, treatment, and tumor microenvironment (TME) of GC. Methods: The TCGA GC (TCGA-STAD) dataset was used to screen key senescence genes from differentially expressed genes (DEGs). A prognostic risk model was trained utilizing the TCGA-STAD dataset and validated using an external GEO dataset. The CIBERSORT algorithm was run to explore the relationship between senescence genes and TME. The chemotherapy drug sensitivities in GC patients were calculated utilizing R package pRRophetic. Results: A total of 37 senescence-related DEGs were obtained. Five key senescence-related genes were further screened to establish a senescence-related risk model based on Cox regression. The survival status of GC patients in the high-risk group was found to be worse than that in the low-risk group. According to the results of gene set enrichment analysis, the senescence-related risk was mainly associated with cytokine activity, immune mechanism, and related pathways. By analyzing the sensitivity of common chemotherapy drugs in GC patients, it was revealed that the sensitivities of high-risk patients to Dasatinib, Lapatinib, and Pazopanib were lower than those of low-risk patients. The CIBERSORT algorithm was executed to analyze the TME in the high-risk group, revealing elevated levels of CD8 T cells, Macrophages M2, and resting Mast cells. In addition, decreased levels of resting memory CD4 T cells , resting NK cells, activated Dendritic cells, and activated Mast cells were also observed. Conclusion: Senescence genes were related to the prognosis, response to chemotherapy drugs, and TME of GC. Our senescence-related risk model could forecast the survival of patients, their response to chemotherapy drugs, and the TME to a certain extent.
Keywords: Senescence gene, gastric cancer, prognostic model, immunotherapy, survival analysis, tumor microenvironment
Introduction
Gastric cancer (GC) is one of the most prevalent gastrointestinal malignancies in the world, with morbidity and mortality rates among the highest [1] and over a million new cases per year worldwide [2,3]. Characteristics of GC include low early diagnosis rate [4], high heterogeneity [5], high aggressiveness [3], and poor prognosis [6]. The 5-year survival rate of GC is around 40% [7]. Surgical operations may be insufficient for a radical cure of GC, thus neoadjuvant chemotherapy and individualized accurate clinical decision-making for effective measures are important to improve the prognosis of GC [8,9].
Anti-tumor drug therapy has gradually transitioned into a “precision immunotherapy” model [10]. However, due to the high internal divergence of GC, the overall curative effect remains unsatisfactory. Patients commonly develop resistance to chemotherapy drugs, which can cause recurrence [11]. Therefore, further exploration of the pathogenesis of GC and a search for ideal tumor biomarkers and therapeutic targets could be significant for early diagnosis, development of personalized treatment, and extension of patient survival.
Senescence, the process of aging involving the loss and degeneration in the body, is a major risk factor for human cancer [12]. Some hallmarks of senescence are similar to those of certain cancers [13]. As a result, the elderly exhibit dysregulated immune responses and increased susceptibility to diseases including cancer [14]. Recent studies have revealed that senescence-related genes (SRG) participate widely in immune cell infiltration [15], regulate cellular senescence, and affect cancer immune expression [16]. SRGs inhibit tumor progression by conditioning the aging of cancer cells, but also facilitate the tumor progression [17]. However, the analysis of SRGs in GC progression is still insufficient, and the relationship between GC and SRGs remains largely unknown [18].
Herein, we built and verified a risk model grounded on SRGs to explore their role in GC prognosis, treatment, and tumor microenvironment (TME), aiming to enhance the understanding of GC etiology and serve as a reference for prognosis, stratification, and precision treatment of GC.
Methods
Data collection
We used the GC cohort dataset in Cancer Genome Atlas Program (TCGA-STAD, https://www.cancer.gov/ccg/research/genome-sequencing/tcga) to analyze differentially expressed genes (DEGs) and establish a prognostic risk model. The dataset contained gene expression information of 412 patients and 448 samples, including 412 tumor tissues and 36 normal tissues. Among them, 366 patients had intact clinical information including prognosis. The model was validated using the GSE84437 dataset [19] from GEO (Gene Expression Omnibus) database, which contained GC tumor gene expression information from 483 patients, and 433 of them had complete clinical prognosis information. In addition, information of 502 aging related genes were obtained from the Chinese National Genomics Data Center (https://ngdc.cncb.ac.cn/aging/index), including their symbols and functions. Ethical approval was waived for this research as all data were obtained from public databases.
Analysis of senescence-related DEGs (SRDEGs)
Gene expression data from 33 patients who had both cancerous and para-cancerous gene expression information were utilized for DEGs analysis using R package DESeq2 [20] (version 1.40.2). The log2 fold change (log2FC), representing the multiple of expression value of a specific gene in tumor tissue compared to normal tissue, was calculated logarithmically with base 2. The DEGs were screened with the absolute value of logFC ≥ 2 plus adjusted P < 0.05. DEGs were compared with SRGs, and the intersection was analyzed to obtain SRDEGs.
Gene function analysis: gene set enrichment analysis
To investigate the biological functions of SRDEGs, the gene ontology (GO) and the Kyoto Encyclopedia of Genes and Genomes (KEGG) gene set enrichment analysis (GSEA) [21] were performed using the R package clusterProfiler [22] (version 4.8.2).
Prognostic model construction and validation
Univariate and multivariate Cox regression models were constructed using R package survival [23] (version 3.5-7) based on data from 366 patients in TCGA-STAD dataset who had complete clinical information to identify prognostic SRDEGs. Multivariate Cox proportional hazards (Coxph) model were used in TCGA-STAD data to perform six-fold cross-validation to train the prognosis model utilizing R package caret [24] (version 6.0-94), and the risk scores were generated. The predictive performance of the model was evaluated using the receiver operating characteristic (ROC) curve. The accuracy of the model was validated using data of 433 patients from the GSE84437 dataset.
Survival analysis
The R survival package was employed for survival analysis. The median risk scores of each dataset were set as the critical value, and the samples were divided into a low-risk group and a high-risk group. The Log-rank tests were conducted to evaluate the survival difference of the two groups. Then, Kaplan-Meier (KM) survival curves were plotted.
Prediction of chemotherapy drug response
To evaluate the role of senescence-related genetic signatures in predicting GC patients’ sensitivity to chemotherapy, R package pRRophetic [25] (version 0.5) was utilized to assess the half-maximal inhibitory concentration (IC50) of several major chemotherapy agents commonly used in the treatment of GC patients.
TME analysis
The CIBERSORT algorithm [26] was run to evaluate the relationship between GC prognostic SRGs and tumor-infiltrating immune cells (TIIC) in TME. CIBERSORT is a deconvolution algorithm providing 22 representations of TIICs based on known reference datasets.
Statistical methods
R (version 4.3.1) was used for all the statistical analyses except for chemotherapy drug response prediction, and R (version 4.1.2) was used in order to run pRRophetic package. ROC curves were plotted with R package pROC [27] (version 1.18.4). Quantitative data were expressed as x̅ ± S, and t-tests were performed to test the differences. Enumerated data were expressed as their number (n), and χ2-tests were used to test the differences. Log-rank tests were used to analyze the differences in survival. All the statistical tests were two-tailed, α = 0.05. A P < 0.05 was considered significant.
Results
Pairwise analysis of DEGs
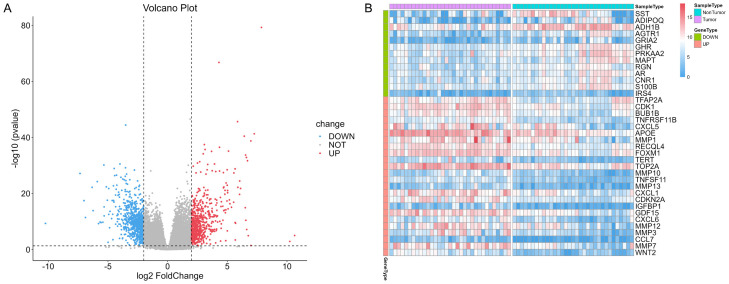
A total of 33 patients in TCGA-STAD cohort had gene expression data of both tumor tissue and normal tissue. DEG analysis in paired samples of tumor versus normal tissue was performed in 66 paired gene expression data from these 33 patients. The significance test of difference was performed using R package DESeq2, and log2FC was calculated. DEGs were screened with an absolute value of logFC ≥ 2 and adjusted P < 0.05. Subsequently, 650 up-regulated genes and 740 down-regulated genes were identified, as depicted in the volcano plot in Figure 1A. After the comparsion of 1,390 DEGs and 502 SRGs, 37 SRDEGs were obtained from the intersection of DEGs and SRGs. Figure 1B shows the expression levels of the 37 SRDEGs in tumor and normal samples.
Figure 1.
DEG analysis of paired samples. A. Volcano plot of DEGs. B. Heat map of 37 SRDEGs. DEG: Differentially expressed gene; SRDEG: senescence-related differentially expressed gene.
GO and KEGG enrichment analysis
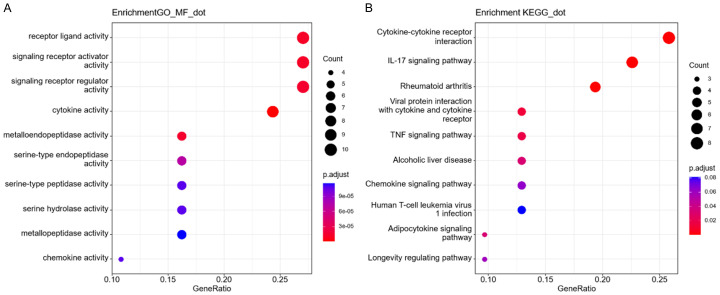
The function of 37 SRDEGs in GC was analyzed through GSEA (Figure 2). The GO enrichment analysis revealed that the SRDEGs were obviously enriched in receptor ligands, signaling receptor activator/regulator activities, and cytokine activity. KEGG results indicated that SRDEGs were enriched mainly in cytokine-cytokine receptor interaction, IL-17 signaling pathway, and rheumatoid arthritis.
Figure 2.
Gene set enrichment analysis. (A) GO enrichment analysis and (B) KEGG enrichment analysis of SRDEGs. SRDEG: senescence-related differentially expressed gene; GO: gene ontology; KEGG: Kyoto Encyclopedia of Genes and Genomes.
Senescence gene-based survival risk model
Univariate and multivariate Cox regression analyses were performed in 366 GC samples with complete clinical information from TCGA-STAD dataset using R package survival. Prognosis-related DEGs were screened using P < 0.05 as the criteria. Five key genes BUB1B, MMP1, IGFBP1, MMP12 and WNT2 were identified as independent variables of the survival model, and age was put into the model as a covariate.
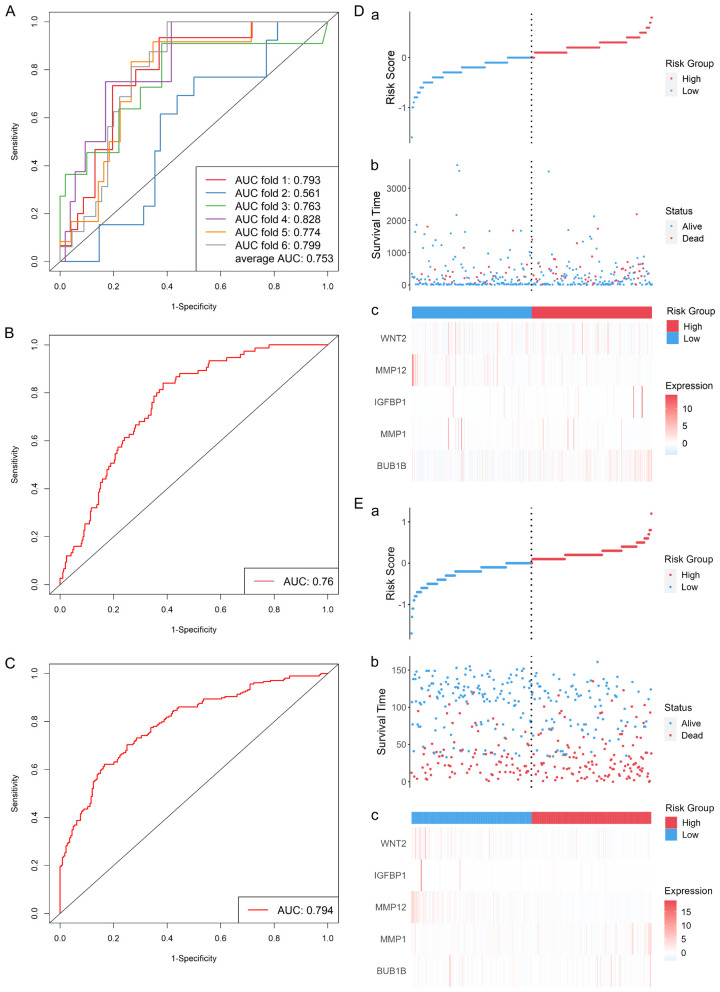
The R package caret was used in six-fold cross-validation for senescence-related prognostic risk model (SRPRM) training, and the average area under the curve (AUC) on the test sets was 0.753. The ROC curves are shown in Figure 3A. The model with the best performance on TCGA-STAD data (AUC = 0.760, as shown in Figure 3B) was selected and then validated using external data from 433 patients in GSE84437. An AUC of 0.794 was found on the validation set (Figure 3C). Figure 3D, 3E show the performance of the predictive model and a better prognosis in low-risk group. The risk score was calculated as follows: Risk score = exp (0.0223 × Age - 0.249 × BUB1B expression - 0.642 × MMP1 expression - 0.441 × IGFBP1 expression + 0.593 × MMP12 expression + 0.485 × WNT2 expression).
Figure 3.
Survival risk model performance in TCGA-STAD (A, B, D) and GSE84437 (C, E) cohort. (A) ROC curves of six-fold cross-validation. (B) ROC curve of the SRPRM in TCGA-STAD data. (C) ROC curve of the SRPRM in GSE84437 data. (D) Analysis of the predictive value of the model in TCGA-STAD cohort and (E) GSE84437 cohort. ROC: receiver operating characteristic; SRPRM: senescence-related prognostic survival risk model.
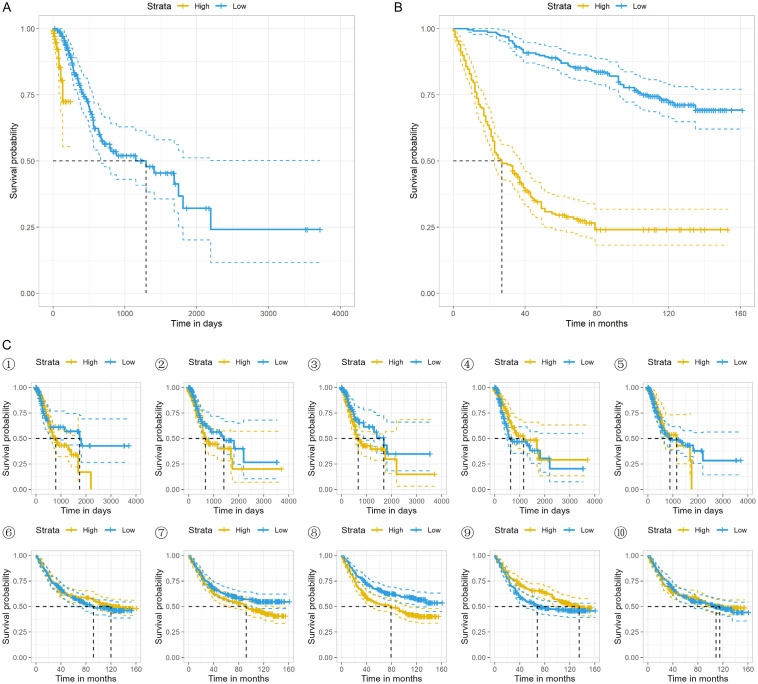
The TCGA-STAD and GSE84437 cohorts were respectively divided into two groups according to the calculated risk score. Significance tests of difference were conducted in both cohorts, and the KM survival curves were plotted, as shown in Figure 4A, 4B. Survival differences were found to be significant in both datasets, χ2 (TCGA) = 19.1, P < 0.001, χ2 (GEO) = 130, P < 0.001. Then, we further studied the relationship between patient prognosis and the five key SRGs. Only IGFP1 in GSE84437 dataset showed significant predictive effect (χ2 (IGFP1 in GEO) = 10.5, P = 0.001, as shown in Figure 4C⑧). The KM survival curves are presented in Figure 4.
Figure 4.
KM survival curves of TCGA cohort (A), GEO cohort (B), and the 5 key genes in the 2 cohorts (C). ①-⑤ correspond to KM survival curves of BUB1B, MMP1, IGFBP1, MMP12, and WNT2 in TCGA-STAD cohort and ⑥-⑩ in GSE84437 cohort, respectively.
Chemotherapy drug response prediction
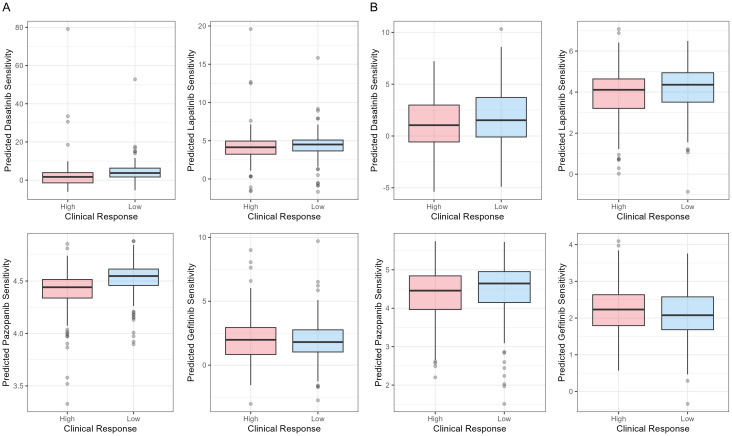
R package pRRophetic was used to calculate the IC50 of four main chemotherapy drugs, Dasatinib, Lapatinib, Pazopanib, and Gefitinib. The results are shown in Figure 5. In TCGA-STAD cohort, the SRPRM predicted significant drug responses for Dasatinib (P = 0.006) and Pazopanib (P < 0.001), but the risk scores were not correlated with drug responses for Lapatinib (P = 0.297) or Gefitinib (P = 0.531). In GSE84437 cohort, the SRPRM predicted drug responses for Lapatinib (P = 0.010). The relationships between survival risk and response to Dasatinib (P = 0.060), Pazopanib (P = 0.055), and Gefitinib (P = 0.052) were marginally significant (P ≈ 0.05) in the GSE84437 cohort. This suggests that higher risk scores of SRPRM have a tendency to associate with lower sensitivities to Dasatinib, Pazopanib, and Lapatinib, and higher sensitivities to Gefitinib.
Figure 5.
Boxplots of IC50 of Dasatinib, Lapatinib, Pazopanib, and Gefitinib between high-risk and low risk groups in (A) TCGA-STAD cohort and (B) GSE84437 cohort. IC50: half-maximal inhibitory concentration.
TME analysis
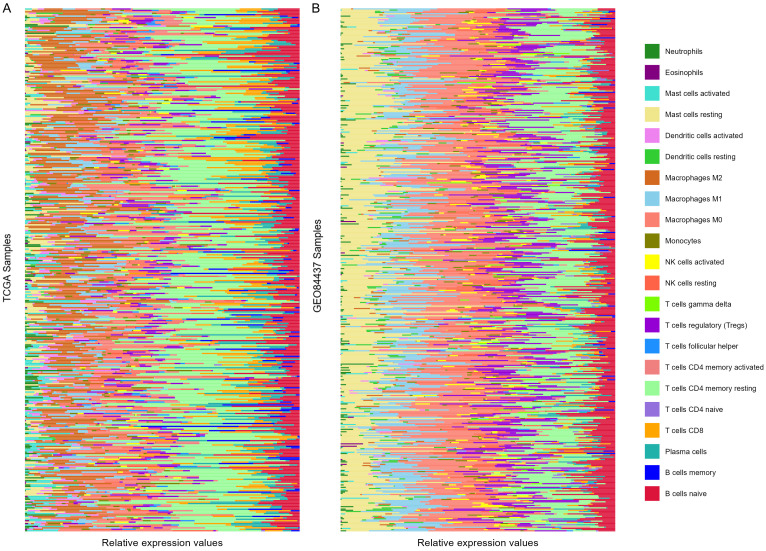
The CIBERSORT algorithm in R language was applied to conduct TME analysis using the expression matrices of 366 TCGA-STAD samples and 433 GSE84437 samples cohort. The results were sorted and plotted according to the risk score. The upper half and the lower half are the high-risk group and the low-risk group, respectively, as shown in Figure 6. Then, the difference in TIIC between the two groups was evaluated. Compared to the low-risk group, three types of TIICs were increased in the high-risk group in TCGA cohort: macrophages M2 (t = 3.131, P = 0.002), T cells CD8 (t = 2.854, P = 0.005), and mast cells resting (t = 2.292, P = 0.023). On the other hand, activated dendritic cells (t = 2.680, P = 0.008), memory resting CD4 T cells (t = 3.312, P = 0.001), resting NK cells (t = 3.315, P = 0.001) and activated mast cells (t = 4.226, P < 0.001) were decreased in the high-risk group in TCGA cohort. Results of GSE84437 showed a difference in naive B cells (t = 2.384, P = 0.018), plasma cells (t = 1.980, P = 0.048), and macrophages M1 (t = 2.139, P = 0.033) between the two risk groups.
Figure 6.
Results of CIBERSORT algorithm. A. TME of TCGA-STAD cohort. B. TME of GSE84437 cohort. Samples were sorted according to the risk scores. The top half and the bottom half were the high-risk group and the low-risk group, respectively. TME: tumor microenvironment.
Discussion
Senescence, or aging, is a complex biological process, and the senescence-associated secretory phenotype can lead to cancer progression and apoptosis [28]. Oncogene activation, in turn, can induce aging [29]. In this study, we found that SRGs were associated with the treatment, prognosis, and TME of GC. We screened SRDEGs in GC tissues from TCGA database and analyzed the biologic functions of these genes, expanding on the previous studies on the relationship between SRGs and GC. Five key genes BUB1B, MMP1, IGFBP1, MMP12 and WNT2 were utilized to construct the SRPRM. It was found that the model could predict the survival status, the response to chemotherapy drugs, and the TME of GC patients to a certain extent. These results suggest that the anti-aging treatment of GC has a potential to improve the chemotherapy drug response and microenvironment of immunosuppression, which may provide a new treatment window for GC [30].
A total of 37 SRDEGs in GC were screened out. The results of GO GSEA indicate that SRDEGs had molecular functions strongly associated with immune processes, including receptor ligand activity and cytokine receptor activity. The KEGG enrichment analysis revealed that SRDEGs were mainly concentrated in signaling molecular interactions and immune-related pathways. Therefore, SRDEGs may be involved in the regulation of cytokine production, immune response regulation, receptors and related signaling pathways in the pathogenesis and development of GC, and thus affect the progression of GC. Previous study found that receptors and related signaling pathways were prognostic biologic markers and therapeutic targets for GC [31]. Therefore, the GSEA results revealed the possible biologic function of SRG in GC.
The five key SRGs used to construct the prognostic risk model are regulators of cellular senescence in various human cancers and play a key part in tumor development. BUB1B is a mitotic checkpoint that controls chromosome segregation and maintains genetic stability. Damage to it can lead to aneuploidy and chromosomal instability, potentially leading to an increased incidence of cancer [32]. As the downstream protein of Jagged1, IGFBP1 is related to the severity of coronary atherosclerosis in elderly patients. The circulating IGFBP1 level also increases with age [33]. MMP1 is involved in the IL-17 signaling pathway, and its expression level in skin fibroblasts changes during aging, slowing down cell growth [34]. MMP12 may be related to tissue damage and remodeling [35]. As for WNT2, it functions in the canonical WNT signaling pathway and in embryonic development [36]. These results are consistent with those of existing studies on biological markers for the prognosis of GC. For example, the overexpression of MMP7 [37,38], MMP21, and MMP28 [39] in the matrix metalloproteinase family can be used as biologic markers for the prognosis of GC.
Analysis of responses to chemotherapy drugs showed a higher probability for low-risk GC patients to benefit from chemotherapy, including better responding to Dasatinib, Lapatinib, and Pazopanib. Existing research has shown that cell senescence can increase drug resistance and side effects of chemotherapy [16], which implies the potential correlation between high senescence scores and the deterioration of the expected effect of chemotherapy.
Senescence-related risk scores were significantly related to the TME of GC. High-risk patients in TCGA cohort had increased macrophages M2, T cells CD8, mast cells resting, and fewer activated dendritic cells, T cells CD4 memory resting, NK cells resting, and activated mast cells. This may indicate that the high-risk group has severer immune system damage [40] and a higher risk of tumor metastasis [41]. Identifying SRGs that influence tumor immune response and further studying their regulatory mechanisms may help stratify and provide promising targets for improving the response to immunotherapy in GC patients.
In conclusion, this study established a GC risk score model based on the expression profile of SRGs plus clinical information and verified the predictive effect of it, providing a reference for mining potential GC biologic markers and discovering new therapeutic targets for predicting treatment outcome. These findings maycontribute to personalized immunotherapy for GC patients in the future and offer novel insight into extending survival time of GC patients.
Disclosure of conflict of interest
None.
References
- 1.Smyth EC, Nilsson M, Grabsch HI, van Grieken NC, Lordick F. Gastric cancer. Lancet. 2020;396:635–648. doi: 10.1016/S0140-6736(20)31288-5. [DOI] [PubMed] [Google Scholar]
- 2.Thrift AP, Nguyen TH. Gastric cancer epidemiology. Gastrointest Endosc Clin N Am. 2021;31:425–439. doi: 10.1016/j.giec.2021.03.001. [DOI] [PubMed] [Google Scholar]
- 3.Machlowska J, Baj J, Sitarz M, Maciejewski R, Sitarz R. Gastric cancer: epidemiology, risk factors, classification, genomic characteristics and treatment strategies. Int J Mol Sci. 2020;21:4012. doi: 10.3390/ijms21114012. [DOI] [PMC free article] [PubMed] [Google Scholar]
- 4.Petryszyn P, Chapelle N, Matysiak-Budnik T. Gastric cancer: where are we heading? Dig Dis. 2020;38:280–285. doi: 10.1159/000506509. [DOI] [PubMed] [Google Scholar]
- 5.Lopez MJ, Carbajal J, Alfaro AL, Saravia LG, Zanabria D, Araujo JM, Quispe L, Zevallos A, Buleje JL, Cho CE, Sarmiento M, Pinto JA, Fajardo W. Characteristics of gastric cancer around the world. Crit Rev Oncol Hematol. 2023;181:103841. doi: 10.1016/j.critrevonc.2022.103841. [DOI] [PubMed] [Google Scholar]
- 6.Zhao Q, Cao L, Guan L, Bie L, Wang S, Xie B, Chen X, Shen X, Cao F. Immunotherapy for gastric cancer: dilemmas and prospect. Brief Funct Genomics. 2019;18:107–112. doi: 10.1093/bfgp/ely019. [DOI] [PubMed] [Google Scholar]
- 7.Fattahi S, Kosari-Monfared M, Golpour M, Emami Z, Ghasemiyan M, Nouri M, Akhavan-Niaki H. LncRNAs as potential diagnostic and prognostic biomarkers in gastric cancer: a novel approach to personalized medicine. J Cell Physiol. 2020;235:3189–3206. doi: 10.1002/jcp.29260. [DOI] [PubMed] [Google Scholar]
- 8.Jeon J, Cheong JH. Clinical implementation of precision medicine in gastric cancer. J Gastric Cancer. 2019;19:235–253. doi: 10.5230/jgc.2019.19.e25. [DOI] [PMC free article] [PubMed] [Google Scholar]
- 9.Algaw RK, Alnujaidi AH, Hazazi AA, Alsuwaidan MF, Homadi IA, Alqahtani OM, Turki S, Alanazi SNA, Alanazl SJ, Alzahrani AM. An overview on gastric cancer surgical management approach. Int J Pharm Res Allied Sci. 2021;10:105–109. [Google Scholar]
- 10.Ishii T, Kawazoe A, Shitara K. Dawn of precision medicine on gastric cancer. Int J Clin Oncol. 2019;24:779–788. doi: 10.1007/s10147-019-01441-x. [DOI] [PubMed] [Google Scholar]
- 11.Ren J, Hu Z, Niu G, Xia J, Wang X, Hong R, Gu J, Wang D, Ke C. Annexin A1 induces oxaliplatin resistance of gastric cancer through autophagy by targeting PI3K/AKT/mTOR. FASEB J. 2023;37:e22790. doi: 10.1096/fj.202200400RR. [DOI] [PubMed] [Google Scholar]
- 12.Zhang Y, Yan Y, Ning N, Shen Z, Ye Y. A signature of 24 aging-related gene pairs predict overall survival in gastric cancer. Biomed Eng Online. 2021;20:35. doi: 10.1186/s12938-021-00871-x. [DOI] [PMC free article] [PubMed] [Google Scholar]
- 13.Lopez-Otin C, Pietrocola F, Roiz-Valle D, Galluzzi L, Kroemer G. Meta-hallmarks of aging and cancer. Cell Metab. 2023;35:12–35. doi: 10.1016/j.cmet.2022.11.001. [DOI] [PubMed] [Google Scholar]
- 14.Ikeda H, Togashi Y. Aging, cancer, and antitumor immunity. Int J Clin Oncol. 2022;27:316–322. doi: 10.1007/s10147-021-01913-z. [DOI] [PubMed] [Google Scholar]
- 15.Lv Y, Wu L, Jian H, Zhang C, Lou Y, Kang Y, Hou M, Li Z, Li X, Sun B, Zhou H. Identification and characterization of aging/senescence-induced genes in osteosarcoma and predicting clinical prognosis. Front Immunol. 2022;13:997765. doi: 10.3389/fimmu.2022.997765. [DOI] [PMC free article] [PubMed] [Google Scholar]
- 16.Zhou L, Niu Z, Wang Y, Zheng Y, Zhu Y, Wang C, Gao X, Gao L, Zhang W, Zhang K, Melino G, Huang H, Wang X, Sun Q. Senescence as a dictator of patient outcomes and therapeutic efficacies in human gastric cancer. Cell Death Discov. 2022;8:13. doi: 10.1038/s41420-021-00769-6. [DOI] [PMC free article] [PubMed] [Google Scholar]
- 17.He F, Ding H, Zhou Y, Wang Y, Xie J, Yang S, Zhu Y. Depiction of aging-based molecular phenotypes with diverse clinical prognosis and immunological features in gastric cancer. Front Med (Lausanne) 2022;8:792740. doi: 10.3389/fmed.2021.792740. [DOI] [PMC free article] [PubMed] [Google Scholar]
- 18.Saul D, Kosinsky RL. Single-cell transcriptomics reveals the expression of aging- and senescence-associated genes in distinct cancer cell populations. Cells. 2021;10:3126. doi: 10.3390/cells10113126. [DOI] [PMC free article] [PubMed] [Google Scholar]
- 19.Yoon SJ, Park J, Shin Y, Choi Y, Park SW, Kang SG, Son HY, Huh YM. Deconvolution of diffuse gastric cancer and the suppression of CD34 on the BALB/c nude mice model. BMC Cancer. 2020;20:314. doi: 10.1186/s12885-020-06814-4. [DOI] [PMC free article] [PubMed] [Google Scholar]
- 20.Love MI, Huber W, Anders S. Moderated estimation of fold change and dispersion for RNA-seq data with DESeq2. Genome Biol. 2014;15:550. doi: 10.1186/s13059-014-0550-8. [DOI] [PMC free article] [PubMed] [Google Scholar]
- 21.Subramanian A, Tamayo P, Mootha VK, Mukherjee S, Ebert BL, Gillette MA, Paulovich A, Pomeroy SL, Golub TR, Lander ES, Mesirov JP. Gene set enrichment analysis: a knowledge-based approach for interpreting genome-wide expression profiles. Proc Natl Acad Sci U S A. 2005;102:15545–15550. doi: 10.1073/pnas.0506580102. [DOI] [PMC free article] [PubMed] [Google Scholar]
- 22.Wu T, Hu E, Xu S, Chen M, Guo P, Dai Z, Feng T, Zhou L, Tang W, Zhan L, Fu X, Liu S, Bo X, Yu G. clusterProfiler 4.0: a universal enrichment tool for interpreting omics data. Innovation (Camb) 2021;2:100141. doi: 10.1016/j.xinn.2021.100141. [DOI] [PMC free article] [PubMed] [Google Scholar]
- 23.Therneau TM, Grambsch PM. Modeling Survival Data: Extending the Cox Model. New York: Springer; 2000. [Google Scholar]
- 24.Kuhn M. Building predictive models in R using the caret package. J Stat Softw. 2008;28:1–26. [Google Scholar]
- 25.Geeleher P, Cox N, Huang RS. pRRophetic: an R package for prediction of clinical chemotherapeutic response from tumor gene expression levels. PLoS One. 2014;9:e107468. doi: 10.1371/journal.pone.0107468. [DOI] [PMC free article] [PubMed] [Google Scholar]
- 26.Chen B, Khodadoust MS, Liu CL, Newman AM, Alizadeh AA. Profiling tumor infiltrating immune cells with CIBERSORT. Methods Mol Biol. 2018;1711:243–259. doi: 10.1007/978-1-4939-7493-1_12. [DOI] [PMC free article] [PubMed] [Google Scholar]
- 27.Robin X, Turck N, Hainard A, Tiberti N, Lisacek F, Sanchez JC, Muller M. pROC: an open-source package for R and S+ to analyze and compare ROC curves. BMC Bioinformatics. 2011;12:77. doi: 10.1186/1471-2105-12-77. [DOI] [PMC free article] [PubMed] [Google Scholar]
- 28.Yasuda T, Koiwa M, Yonemura A, Miyake K, Kariya R, Kubota S, Yokomizo-Nakano T, Yasuda-Yoshihara N, Uchihara T, Itoyama R, Bu L, Fu L, Arima K, Izumi D, Iwagami S, Eto K, Iwatsuki M, Baba Y, Yoshida N, Ohguchi H, Okada S, Matsusaki K, Sashida G, Takahashi A, Tan P, Baba H, Ishimoto T. Inflammation-driven senescence-associated secretory phenotype in cancer-associated fibroblasts enhances peritoneal dissemination. Cell Rep. 2021;34:108779. doi: 10.1016/j.celrep.2021.108779. [DOI] [PubMed] [Google Scholar]
- 29.Zhang G, Dong K, Liu J, Zhou W. Prognosis and tumor immune microenvironment of patients with gastric cancer by a novel senescence-related signature. Medicine (Baltimore) 2022;101:e30927. doi: 10.1097/MD.0000000000030927. [DOI] [PMC free article] [PubMed] [Google Scholar]
- 30.van Deursen JM. Senolytic therapies for healthy longevity. Science. 2019;364:636–637. doi: 10.1126/science.aaw1299. [DOI] [PMC free article] [PubMed] [Google Scholar]
- 31.Moreira AM, Pereira J, Melo S, Fernandes MS, Carneiro P, Seruca R, Figueiredo J. The extracellular matrix: an accomplice in gastric cancer development and progression. Cells. 2020;9:394. doi: 10.3390/cells9020394. [DOI] [PMC free article] [PubMed] [Google Scholar]
- 32.Jiao CY, Feng QC, Li CX, Wang D, Han S, Zhang YD, Jiang WJ, Chang J, Wang X, Li XC. BUB1B promotes extrahepatic cholangiocarcinoma progression via JNK/c-Jun pathways. Cell Death Dis. 2021;12:63. doi: 10.1038/s41419-020-03234-x. [DOI] [PMC free article] [PubMed] [Google Scholar]
- 33.Wu X, Zheng W, Jin P, Hu J, Zhou Q. Role of IGFBP1 in the senescence of vascular endothelial cells and severity of aging‑related coronary atherosclerosis. Int J Mol Med. 2019;44:1921–1931. doi: 10.3892/ijmm.2019.4338. [DOI] [PMC free article] [PubMed] [Google Scholar]
- 34.Lago JC, Puzzi MB. The effect of aging in primary human dermal fibroblasts. PLoS One. 2019;14:e0219165. doi: 10.1371/journal.pone.0219165. [DOI] [PMC free article] [PubMed] [Google Scholar]
- 35.Swindell WR, Bojanowski K, Chaudhuri RK. A standardized Terminalia chebula fruit extract alters the expression of genes associated with skin architecture and barrier formation. Eur J Dermatol. 2020;30:469–492. doi: 10.1684/ejd.2020.3882. [DOI] [PubMed] [Google Scholar]
- 36.Tian S, Peng P, Li J, Deng H, Zhan N, Zeng Z, Dong W. SERPINH1 regulates EMT and gastric cancer metastasis via the Wnt/beta-catenin signaling pathway. Aging (Albany NY) 2020;12:3574–3593. doi: 10.18632/aging.102831. [DOI] [PMC free article] [PubMed] [Google Scholar]
- 37.Zhang Y, Qin L, Ma X, Wang Y, Wu Y, Jiang J. Coexpression of matrix metalloproteinase-7 and tissue inhibitor of metalloproteinase-1 as a prognostic biomarker in gastric cancer. Dis Markers. 2020;2020:8831466. doi: 10.1155/2020/8831466. [DOI] [PMC free article] [PubMed] [Google Scholar]
- 38.Koskensalo S, Mrena J, Wiksten JP, Nordling S, Kokkola A, Hagstrom J, Haglund C. MMP-7 overexpression is an independent prognostic marker in gastric cancer. Tumour Biol. 2010;31:149–155. doi: 10.1007/s13277-010-0020-1. [DOI] [PubMed] [Google Scholar]
- 39.Zhang J, Pan Q, Yan W, Wang Y, He X, Zhao Z. Overexpression of MMP21 and MMP28 is associated with gastric cancer progression and poor prognosis. Oncol Lett. 2018;15:7776–7782. doi: 10.3892/ol.2018.8328. [DOI] [PMC free article] [PubMed] [Google Scholar]
- 40.He W, Zhang H, Han F, Chen X, Lin R, Wang W, Qiu H, Zhuang Z, Liao Q, Zhang W, Cai Q, Cui Y, Jiang W, Wang H, Ke Z. CD155T/TIGIT signaling regulates CD8(+) T-cell metabolism and promotes tumor progression in human gastric cancer. Cancer Res. 2017;77:6375–6388. doi: 10.1158/0008-5472.CAN-17-0381. [DOI] [PubMed] [Google Scholar]
- 41.Qiu S, Xie L, Lu C, Gu C, Xia Y, Lv J, Xuan Z, Fang L, Yang J, Zhang L, Li Z, Wang W, Xu H, Li B, Xu Z. Gastric cancer-derived exosomal miR-519a-3p promotes liver metastasis by inducing intrahepatic M2-like macrophage-mediated angiogenesis. J Exp Clin Cancer Res. 2022;41:296. doi: 10.1186/s13046-022-02499-8. [DOI] [PMC free article] [PubMed] [Google Scholar]


