Abstract
The Gene Expression Omnibus (GEO) is an international public repository that archives gene expression and epigenomics data sets generated by next-generation sequencing and microarray technologies. Data are typically submitted to GEO by researchers in compliance with widespread journal and funder mandates to make generated data publicly accessible. The resource handles raw data files, processed data files and descriptive metadata for over 200 000 studies and 6.5 million samples, all of which are indexed, searchable and downloadable. Additionally, GEO offers web-based tools that facilitate analysis and visualization of differential gene expression. This article presents the current status and recent advancements in GEO, including the generation of consistently computed gene expression count matrices for thousands of RNA-seq studies, and new interactive graphical plots in GEO2R that help users identify differentially expressed genes and assess data set quality. The GEO repository is built and maintained by the National Center for Biotechnology Information (NCBI), a division of the National Library of Medicine (NLM), and is publicly accessible at https://www.ncbi.nlm.nih.gov/geo/.
Graphical Abstract
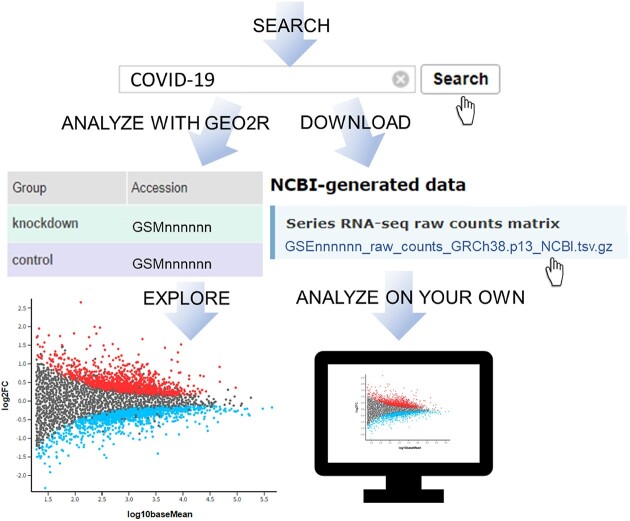
Graphical Abstract.
Introduction
Since 2000 (1), the NCBI GEO database has played a crucial role in how large-scale gene expression and epigenomics data sets are archived and shared. It has been seven years since GEO last published on its contents and updates (2) and now GEO has several new analysis features to report which improve user experience and expand data analysis capabilities. GEO facilitates and advances biological and health sciences by offering the largest collection of richly-annotated, open-access gene expression and epigenomics data sets from all branches of life. It promotes transparency and reproducible research by providing continuous free access and preservation of the primary research data that form the basis of published manuscripts. Furthermore, GEO provides tools for users to explore, analyze and visualize the data, and apply the data to their own research.
Some factors that enable GEO to support the community and achieve archiving, access, discovery, download and re-use of gene expression and epigenomics data sets include:
Providing timely and reliable access to large-scale data sets from a diverse body of sequencing and microarray studies and organisms, all of which are free to read, download and easy to discover in a centralized resource
Serving as a designated data repository for journals and funding agencies in support of open access data sharing policies
Supporting data submission pipelines that enable researchers of all levels of experience to deposit and share their data with ease
Supporting the peer review process by enabling secure, anonymous reviewer and editor access to pre-published data sets
Generating opportunities and tools for the community to locate, re-use, re-analyze and visualize GEO data, thus enabling scientific discovery
Supporting the NIH-endorsed FAIR principles of Findability, Accessibility, Interoperability and Reusability of data sets (3)
Supporting community-derived ‘Minimum Information’ standards MINSEQE (https://www.fged.org/projects/minseqe) and MIAME (4) that outline the data that should be provided when describing a sequencing or microarray study
GEO content
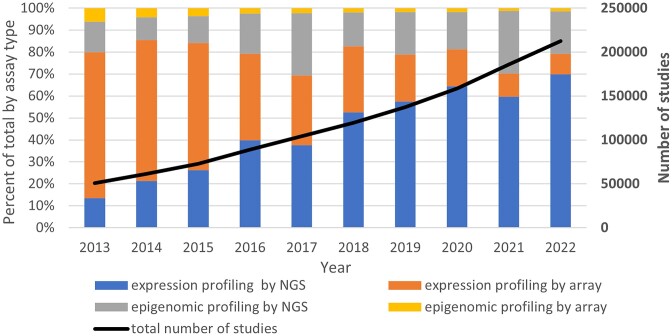
Despite being 23 years old, GEO continues to grow rapidly. The number of studies processed is currently increasing at a rate of approximately 15% per annum, or doubling every ∼5 years (Figure 1, or https://www.ncbi.nlm.nih.gov/geo/summary/?type=history). At the time of writing the GEO database contains over 6.5 million samples from over 200 000 studies, from over 6000 different organisms, deposited by 70 000 unique submitters, making it one of the most extensive and diverse repositories of functional genomic data in the world. Over 47 000 articles in PubMed Central (https://www.ncbi.nlm.nih.gov/pmc/) cite GEO or GEO Series (GSE) accession identifiers.
Figure 1.
GEO growth and data type trends over the last decade. The stacked bars display the percentage of each of four broad data type categories from 2013–2022, using the left y-axis. The thick black line shows growth of the total number of studies from 2013–2022 and uses the right y-axis.
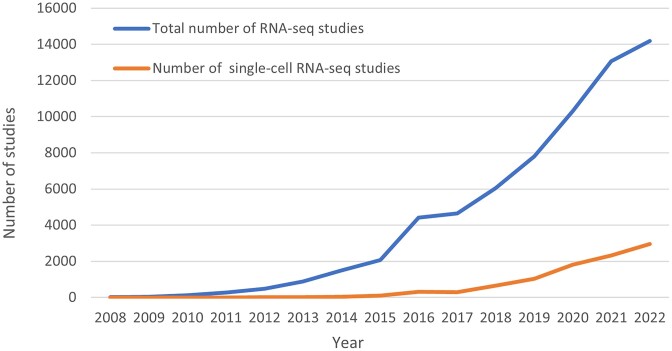
GEO database content mirrors the technology advances taking place in the research community. Figure 1 depicts the past 10-year trend in GEO submissions by data type. While GEO consisted almost entirely of microarray data for the first 10 years of its existence, unsurprisingly, the proportion of next-generation sequencing (NGS) data has grown and now makes up the bulk (85%) of submissions. The proportion of expression profiling (e.g. RNA-seq) to epigenomic applications (e.g. ChIP-seq, methylation analysis) has remained mostly steady over the last decade at about 80% to 20%, respectively. RNA-seq has become a standard experimental tool in research and medicine (5) and since 2018, RNA-seq studies have represented over half of all studies submitted each year. In 2009, GEO released the first single-cell RNA-seq study (GSE14605) on individual mouse oocyte transcriptomes (6). Between 2009 and 2015 GEO released fewer than 100 single-cell RNA-seq studies per year. Since 2017, the number of single-cell RNA-seq studies increased each year such that in 2022, 21% of RNA-seq studies released by GEO were performed on single cells (Figure 2).
Figure 2.
Number of total and single-cell RNA-seq studies released by GEO between 2008 and 2022.
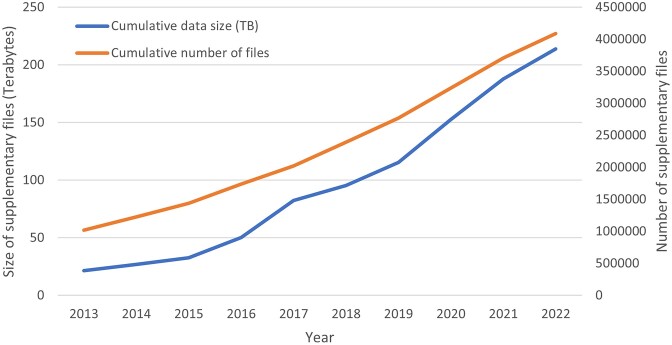
As the submission volume increases and studies become ever-more focused on single cell transcriptomes or base-level epigenomic data, the amount of the supplementary data that GEO receives each year also increases. Total holdings of the quantitative processed data now exceed 200 TB in ∼4 million files (Figure 3). The supplementary data files are available for download from the GEO website, and fulfill an important aspect of the ‘Accessibility’ component of the FAIR principles (3). These data files contain the quantitative data used to draw conclusions for a study and provide users easy access to specific gene or genomic-region data.
Figure 3.
Growth of supplementary data held by GEO. This plot displays the cumulative growth from 2013–2022 of supplementary data in terabytes (blue line) using the left y-axis and the cumulative number of supplementary data files (orange line) using the right y-axis. The supplementary data represent the quantitative data used to draw conclusions for a study.
NGS technologies have been customized for new assays that explore the function of and interactions between the genome, transcriptome and proteome. GEO studies contain over 450 unique varieties of named high throughput sequencing methods including GRO-seq (nascent RNA identification) (7), STARR-seq (enhancer identification) (8), ATAC-seq (chromosome accessibility) (9), Hi-C (chromosome contacts) (10), CRAC-seq (RNA-protein interactions) (11) and ChIRP-seq (RNA-chromatin interactions) (12). Studies submitted to GEO can be complex in terms of structure and employ a range of technologies. For example, RNA-seq, ChIP-seq, ATAC-seq and methylation profiling can be applied to the same sets of samples. GEO reflects these structures using SuperSeries that encompass all related data, and SubSeries that represents partitions of the study.
Studies in GEO reveal trends in medicine with global impact. Human and mouse studies represent over 75% of the studies in GEO. Over 38 000 studies in GEO (18%) explore the functional genomics of cancer, the second leading cause of death in 2020 in the United States (13). GEO was a very early resource for gene expression data from COVID-19 patients. GEO’s first study on COVID-19 (GSE147507) was released for public access on 25 March 2020, at the beginning of the pandemic and the accompanying paper was published in September 2020 (14). The rapid submission and availability of these data in GEO provided researchers and the public with insight into the transcriptomic impacts of SARS-COV-2 infection. Thus far, data from GSE147507 have been re-used or re-analyzed in at least 93 published manuscripts. To date, GEO contains 728 studies on COVID-19 disease or its causative agent Severe acute respiratory syndrome coronavirus 2. GEO also contains data on Zika virus and its associated disease that came to the world's attention during the Zika epidemic of 2015–2016. Since 2016, GEO has received an average of 18 studies on Zika virus or Zika-related disease per year. With such rapidly available and relevant content, GEO is an essential resource for cutting-edge research on issues critical for human health.
Recent Updates
Most of the infrastructure, organization and search capabilities of GEO remain as described previously (15). Some recent enhancements include the following:
Generation of RNA-seq count matrices
A large challenge in the gene expression field is that the raw RNA-seq reads available in public archives must be heavily transformed before biological interpretations can be achieved. To help address this, the SRA (Sequence Read Archive) (16) RNA-seq Counts Pipeline (described at https://www.ncbi.nlm.nih.gov/geo/info/rnaseqcounts.html) is a cloud-based bioinformatic analysis method based on HISAT2 (17) and featureCounts (18) implemented for processing public bulk RNA-seq reads into consistently computed expression counts. Single-cell studies were excluded from the NCBI RNA-seq analysis pipeline due to their complex and variable data structures with barcoded reads. GEO has further processed the raw counts generated by SRA and transformed them into raw and normalized study-centric matrix counts files that are interoperable with common differential gene expression analysis tools, thereby expanding data re-use potential. The compressed count files are typically under 1 Mb, thousands of times smaller than the raw SRA runs enabling faster transfer and more convenient local handling. GEO delivers these count matrix files to the public from the GEO website and incorporates them into GEO2R (described below). All historical and ongoing GEO human bulk RNA-seq studies have been subjected to the pipeline, such that matrices for over 23 000 studies are available today. In comparison to similar resources such as ARCHS4 (19), Recount3 (20) and Expression Atlas (21), NCBI’s RNA-seq pipeline runs frequently and is continually generating count data files from newly released data. New counts are typically available within a week of the original data being released, thus ensuring timely analysis of newly published data sets. All GEO studies with NCBI-generated count matrices can be identified by searching GEO DataSets with "rnaseq counts"[Filter].
Integration of RNA-seq into GEO2R
Introduced in our last update paper (15), GEO2R is a web-based tool that allows users to perform differential gene expression analysis on data sets from GEO using R packages like GEOquery (22) and limma (23). GEO2R enables users to compare gene expression levels between two or more user-defined groups of samples and identify genes that are differentially expressed between those groups. Initially, GEO2R could only operate on microarray data. It has recently been updated to include the aforementioned human RNA-seq count matrices. Technically, this required introducing alternative methods to load and analyze the data such as DESeq2 (24). At the time of writing, approximately 50% of all GEO studies can be analyzed with GEO2R. All GEO studies that can be analyzed with GEO2R can be identified by searching GEO DataSets with "geo2r"[Filter].
Interactive plots in GEO2R
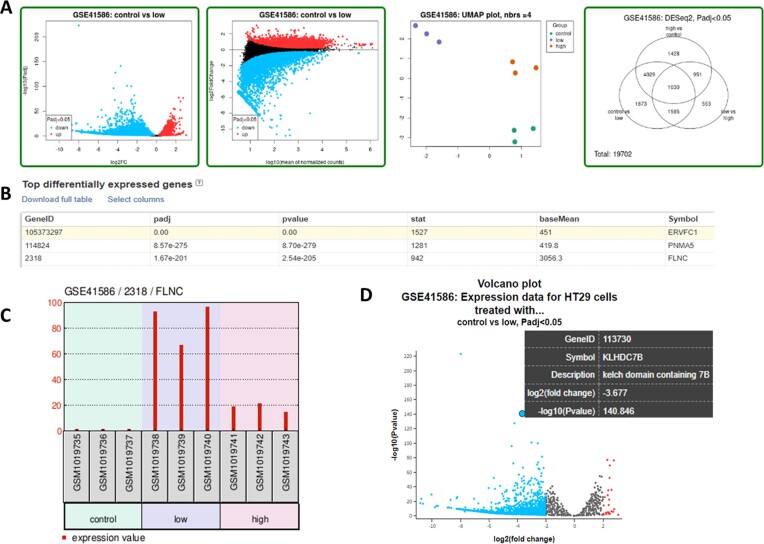
Since 2020, GEO2R output includes a table of differentially expressed genes, fold changes and adjusted p-values. Several new graphical plots are now generated to help users further explore differentially expressed genes and assess data set quality (Figure 4). Plots include volcano, mean difference, UMAP, Venn diagram, expression density, boxplot, P-value histogram, moderated T-statistic quantile–quantile plot and mean variance trend. Several of the plots are interactive, allowing users to explore alternative contrasts and individual genes. Furthermore, we provide the R statistical software (v4.2.2; R Core Team 2022) script used to perform the calculations and draw the plots so users can perform the same or another analysis directly in R. A newly produced tutorial video is now publicly available that demonstrates how to use the new GEO2R features (https://www.youtube.com/watch?v=9RyWjzSnaE0). These analysis tools enable even casual users to quickly analyze and extract meaningful information from complex gene expression data sets online.
Figure 4.
Screenshot of GEO2R analysis results of series record GSE41586 (34). (A) Close-up of a selection of data visualization plots. The green outline indicates a plot that can be opened in an interactive window called the ‘Explore and Download’ feature. (B) GEO2R analysis results displayed as a table of the 250 top differentially expressed genes with statistics. The results for all genes can be downloaded by clicking on the text ‘Download full table’. (C) Example of gene-specific graph of expression values for all samples in the analysis. This type of graph is accessed by clicking on any row in the ‘Top differentially expressed genes’ table. (D) ‘Explore and Download’ window for the Volcano plot. In this plot, log2 fold change threshold of 2 has been applied in the ‘Options’ tab which means that only genes with an absolute log2 fold change value equal to or exceeding the chosen threshold are colored either red for increased expression or blue for decreased expression. Mousing over a point reveals its GeneID, Symbol, Description, log2(fold change) and –log10 (P-value).
Improved submission procedures
GEO offers spreadsheet-based submission procedures in order make the submission process as straightforward and easy as possible for submitters. Submitters are required to fill-in a metadata worksheet describing their study, samples, protocols and listing all submission files. The completed worksheet and submission files are reviewed by the GEO curation staff who may request additional files or information before accessioning the submission and notifying the submitter. Recent improvements in metadata submission templates and examples have helped to further promote provision of complete and well-annotated data sets. The online interface for submitters has been improved with clearer instructions and information regarding data release policies, and the submission pipeline has been upgraded to include personalized upload directories for submitters for complete anonymity when uploading files. On the backend, the GEO pipeline that brokers raw read data to SRA on behalf of GEO submitters was completely redesigned to take advantage of NCBI Submission Portal services, thus eliminating some manual processing steps and improving scalability and synchronicity across the GEO, SRA, BioSample and BioProject databases (25). Cumulatively, these changes have helped GEO maintain quick submission turnaround time despite increased submission numbers, thereby helping authors meet their manuscript submission deadlines.
Re-use of GEO data
Examining GEO data re-use offers tangible evidence for the value of the database. The community re-uses GEO data in diverse ways, including finding evidence of novel gene expression patterns, identifying disease predictors, and generally aggregating and analyzing data in ways not anticipated by the original data generators. GEO data provide innumerable training opportunities and are often used as input in differential expression analysis classes and software tutorials.
A non-exhaustive list of >31 000 third-party papers that use GEO data to support or complement independent studies is provided at https://www.ncbi.nlm.nih.gov/geo/info/citations.html. These numbers suggest that for approximately every seven GEO submissions, a third-party paper is created or enhanced.
Some common examples of re-use include:
Identification of new diagnostic and prognostic biomarkers. For example, researchers used several GEO data sets to identify and validate a six-gene prognostic signature that stratified non-small cell lung cancer patients into low-risk and high-risk groups (26).
Generating new databases targeted to specific communities. For example, the STAB (Spatio-Temporal cell Atlas of the human Brain) database collects and curates GEO single-cell transcriptome data sets across multiple brain regions and developmental periods, and uniformly re-processes them to reveal the landscape of cell types and their regional heterogeneity and temporal dynamics across the human brain (27).
Integrating disparate data sets to gain new biological insights. For example, researchers integrated multiple GEO data sets to characterize gene expression changes associated with SARS-CoV-2 infection of the ovary and how it might affect ovarian function (28).
Elucidation of molecular networks and pathways. For example, researchers used GEO data to find modules of functionally related genes in heterotopic ossification samples thus providing novel insight into the disease pathogenesis (29).
Drug re-purposing. For example, an analysis of several COVID-19 studies in GEO was performed to help identify existing therapeutic candidates that could be effective against the disease (30).
Developing and validating computational methods. For example, researchers used several GEO data sets to help systematically evaluate state-of-the-art algorithms for inferring gene regulatory networks from single-cell transcriptional data (31).
Development of machine learning and artificial intelligence models. For example, researchers used GEO data to help develop precision machine learning models for disease classifiers that could be used for fast and reliable detection of patients with severe and heterogeneous illnesses (32).
Conclusion
GEO is a widely used international public repository for high-throughput gene expression and epigenomic data and continues to grow at an increasing rate. The database has become an essential resource for researchers across a wide range of disciplines, including genomics, molecular biology, biomedicine and bioinformatics.
The GEO database was originally intended as a place to host the underlying data discussed in publications, but the re-use examples provided above offer a glimpse of the overall impact and the return of investment of making large-scale gene expression and epigenomic data freely available. Through aggregation and re-analysis, the value of these data sets can go well beyond their originally intended scope. These data can help promote innovation and discovery across disparate scientific and biomedical disciplines, supporting the generation of new biological insights, new therapies, new algorithms and new value-added databases. In this way, GEO represents a foundational resource that helps catalyze basic science, facilitating data-driven discoveries and translation of research results into new knowledge and products that accelerate biological and health discoveries.
The GEO team expects to continue to apply incremental improvements to the database going forward. A long-standing improvement for data archives such as GEO would be the use of standardized metadata or ontologies (33) that would improve the ability to find relevant data in GEO. Although we recognize the value of standardized metadata and encourage submitters to provide complete sample descriptions and protocols, the implementation of metadata standards across GEO’s diverse sample types, organisms and experimental protocols is a prodigious challenge. In the future perhaps deep learning or predictive text classifiers could be applied to extract organized and classified metadata of the GEO corpus. Future GEO aims include scaling the database to better handle very large studies, improving data analysis features and expanding data access capabilities through new cloud and API functionalities.
Acknowledgements
We thank the NCBI SRA team for the monumental task of NGS archiving and dissemination and Sean Davis for continuous support.
Contributor Information
Emily Clough, National Center for Biotechnology Information, National Library of Medicine, National Institutes of Health, Bethesda, MD, 20892, USA.
Tanya Barrett, National Center for Biotechnology Information, National Library of Medicine, National Institutes of Health, Bethesda, MD, 20892, USA.
Stephen E Wilhite, National Center for Biotechnology Information, National Library of Medicine, National Institutes of Health, Bethesda, MD, 20892, USA.
Pierre Ledoux, National Center for Biotechnology Information, National Library of Medicine, National Institutes of Health, Bethesda, MD, 20892, USA.
Carlos Evangelista, National Center for Biotechnology Information, National Library of Medicine, National Institutes of Health, Bethesda, MD, 20892, USA.
Irene F Kim, National Center for Biotechnology Information, National Library of Medicine, National Institutes of Health, Bethesda, MD, 20892, USA.
Maxim Tomashevsky, National Center for Biotechnology Information, National Library of Medicine, National Institutes of Health, Bethesda, MD, 20892, USA.
Kimberly A Marshall, National Center for Biotechnology Information, National Library of Medicine, National Institutes of Health, Bethesda, MD, 20892, USA.
Katherine H Phillippy, National Center for Biotechnology Information, National Library of Medicine, National Institutes of Health, Bethesda, MD, 20892, USA.
Patti M Sherman, National Center for Biotechnology Information, National Library of Medicine, National Institutes of Health, Bethesda, MD, 20892, USA.
Hyeseung Lee, National Center for Biotechnology Information, National Library of Medicine, National Institutes of Health, Bethesda, MD, 20892, USA.
Naigong Zhang, National Center for Biotechnology Information, National Library of Medicine, National Institutes of Health, Bethesda, MD, 20892, USA.
Nadezhda Serova, National Center for Biotechnology Information, National Library of Medicine, National Institutes of Health, Bethesda, MD, 20892, USA.
Lukas Wagner, National Center for Biotechnology Information, National Library of Medicine, National Institutes of Health, Bethesda, MD, 20892, USA.
Vadim Zalunin, National Center for Biotechnology Information, National Library of Medicine, National Institutes of Health, Bethesda, MD, 20892, USA.
Andrey Kochergin, National Center for Biotechnology Information, National Library of Medicine, National Institutes of Health, Bethesda, MD, 20892, USA.
Alexandra Soboleva, National Center for Biotechnology Information, National Library of Medicine, National Institutes of Health, Bethesda, MD, 20892, USA.
Data availability
GEO is publicly accessible at https://www.ncbi.nlm.nih.gov/geo/.
Funding
National Center for Biotechnology Information of the National Library of Medicine (NLM), National Institutes of Health. Funding for open access charge: NCBI/NLM/NIH.
Conflict of interest statement. None declared.
References
- 1. Edgar R., D.M. L.A. Gene Expression Omnibus: NCBI gene expression and hybridization array data repository. Nucleic Acids Res. 2002; 30:207–210. [DOI] [PMC free article] [PubMed] [Google Scholar]
- 2. Clough E., Barrett T.. The Gene Expression Omnibus Database. Methods Mol. Biol. 2016; 1418:93–110. [DOI] [PMC free article] [PubMed] [Google Scholar]
- 3. Wilkinson M.D., Dumontier M., Aalbersberg I.J., Appleton G., Axton M., Baak A., Blomberg N., Boiten J.W., da Silva Santos L.B., Bourne P.E.et al.. The FAIR Guiding Principles for scientific data management and stewardship. Sci. Data. 2016; 3:160018. [DOI] [PMC free article] [PubMed] [Google Scholar]
- 4. Brazma A., Hingamp P., Quackenbush J., Sherlock G., Spellman P., Stoeckert C., Aach J., Ansorge W., Ball C.A., Causton H.C.et al.. Minimum information about a microarray experiment (MIAME)-toward standards for microarray data. Nat. Genet. 2001; 29:365–371. [DOI] [PubMed] [Google Scholar]
- 5. Stark R., Grzelak M., Hadfield J.. RNA sequencing: the teenage years. Nat. Rev. Genet. 2019; 20:631–656. [DOI] [PubMed] [Google Scholar]
- 6. Tang F., Barbacioru C., Wang Y., Nordman E., Lee C., Xu N., Wang X., Bodeau J., Tuch B.B., Siddiqui A.et al.. mRNA-Seq whole-transcriptome analysis of a single cell. Nat. Methods. 2009; 6:377–382. [DOI] [PubMed] [Google Scholar]
- 7. Core L.J., Waterfall J.J., Lis J.T.. Nascent RNA sequencing reveals widespread pausing and divergent initiation at human promoters. Science. 2008; 322:1845–1848. [DOI] [PMC free article] [PubMed] [Google Scholar]
- 8. Arnold C.D., Gerlach D., Spies D., Matts J.A., Sytnikova Y.A., Pagani M., Lau N.C., Stark A.. Quantitative genome-wide enhancer activity maps for five Drosophila species show functional enhancer conservation and turnover during cis-regulatory evolution. Nat. Genet. 2014; 46:685–692. [DOI] [PMC free article] [PubMed] [Google Scholar]
- 9. Buenrostro J.D., Giresi P.G., Zaba L.C., Chang H.Y., Greenleaf W.J.. Transposition of native chromatin for fast and sensitive epigenomic profiling of open chromatin, DNA-binding proteins and nucleosome position. Nat. Methods. 2013; 10:1213–1218. [DOI] [PMC free article] [PubMed] [Google Scholar]
- 10. Lieberman-Aiden E., van Berkum N.L., Williams L., Imakaev M., Ragoczy T., Telling A., Amit I., Lajoie B.R., Sabo P.J., Dorschner M.O.et al.. Comprehensive mapping of long-range interactions reveals folding principles of the human genome. Science. 2009; 326:289–293. [DOI] [PMC free article] [PubMed] [Google Scholar]
- 11. van Nues R., Schweikert G., de Leau E., Selega A., Langford A., Franklin R., Iosub I., Wadsworth P., Sanguinetti G., Granneman S.. Kinetic CRAC uncovers a role for Nab3 in determining gene expression profiles during stress. Nat. Commun. 2017; 8:12. [DOI] [PMC free article] [PubMed] [Google Scholar]
- 12. Chu C., Qu K., Zhong F.L., Artandi S.E., Chang H.Y.. Genomic maps of long noncoding RNA occupancy reveal principles of RNA-chromatin interactions. Mol. Cell. 2011; 44:667–678. [DOI] [PMC free article] [PubMed] [Google Scholar]
- 13. Murphy S.L., Kochanek K.D., Xu J.Q., Arias E.. Mortality in the United States, 2020. NCHS Data Brief. 2021; 10.15620/cdc:112079. [DOI] [PubMed] [Google Scholar]
- 14. Blanco-Melo D., Nilsson-Payant B.E., Liu W.C., Uhl S., Hoagland D., Møller R., Jordan T.X., Oishi K., Panis M., Sachs D.et al.. Imbalanced Host Response to SARS-CoV-2 Drives Development of COVID-19. Cell. 2020; 181:1036–1045. [DOI] [PMC free article] [PubMed] [Google Scholar]
- 15. Barrett T., Wilhite S.E., Ledoux P., Evangelista C., Kim I.F., Tomashevsky M., Marshall K.A., Phillippy K.H., Sherman P.M., Holko M.et al.. NCBI GEO: archive for functional genomics data sets–update. Nucleic Acids Res. 2013; 41:D991–D995. [DOI] [PMC free article] [PubMed] [Google Scholar]
- 16. Sayers E.W., Bolton E.E., Brister J.R., Canese K., Chan J., Comeau D.C., Connor R., Funk K., Kelly C., Kim S.et al.. Database resources of the national center for biotechnology information. Nucleic Acids Res. 2022; 50:D20–D26. [DOI] [PMC free article] [PubMed] [Google Scholar]
- 17. Kim D., Paggi J.M., Park C., Bennett C., Salzberg S.L.. Graph-based genome alignment and genotyping with HISAT2 and HISAT-genotype. Nat. Biotechnol. 2019; 37:907–915. [DOI] [PMC free article] [PubMed] [Google Scholar]
- 18. Liao Y., Smyth G.K., Shi W.. featureCounts: an efficient general purpose program for assigning sequence reads to genomic features. Bioinformatics. 2014; 30:923–930. [DOI] [PubMed] [Google Scholar]
- 19. Lachmann A., Torre D., Keenan A.B., Jagodnik K.M., Lee H.J., Wang L., Silverstein M.C., Ma’ayan A.. Massive mining of publicly available RNA-seq data from human and mouse. Nat. Commun. 2018; 9:1366. [DOI] [PMC free article] [PubMed] [Google Scholar]
- 20. Wilks C., Zheng S.C., Chen F.Y., Charles R., Solomon B., Ling J.P., Imada E.L., Zhang D., Joseph L., Leek J.T.et al.. recount3: summaries and queries for large-scale RNA-seq expression and splicing. Genome Biol. 2021; 22:323. [DOI] [PMC free article] [PubMed] [Google Scholar]
- 21. Moreno P., Fexova S., George N., Manning J.R., Miao Z., Mohammed S., Muñoz-Pomer A., Fullgrabe A., Bi Y., Bush N.et al.. Expression Atlas update: gene and protein expression in multiple species. Nucleic Acids Res. 2022; 50:D129–D140. [DOI] [PMC free article] [PubMed] [Google Scholar]
- 22. Davis S., Meltzer P.S.. GEOquery: a bridge between the Gene Expression Omnibus (GEO) and BioConductor. Bioinformatics. 2007; 23:1846–1847. [DOI] [PubMed] [Google Scholar]
- 23. Smyth G.K. Linear models and empirical bayes methods for assessing differential expression in microarray experiments. Stati. Applic. Genet. Mol. Biol. 2004; 3:Article3. [DOI] [PubMed] [Google Scholar]
- 24. Love M.I., Huber W., Anders S.. Moderated estimation of fold change and dispersion for RNA-seq data with DESeq2. Genome Biol. 2014; 15:550. [DOI] [PMC free article] [PubMed] [Google Scholar]
- 25. Barrett T., Clark K., Gevorgyan R., Gorelenkov V., Gribov E., Karsch-Mizrachi I., Kimelman M., Pruitt K.D., Resenchuk S., Tatusova T.et al.. BioProject and BioSample databases at NCBI: facilitating capture and organization of metadata. Nucleic Acids Res. 2012; 40:D57–D63. [DOI] [PMC free article] [PubMed] [Google Scholar]
- 26. Zuo S., Wei M., Zhang H., Chen A., Wu J., Wei J., Dong J.. A robust six-gene prognostic signature for prediction of both disease-free and overall survival in non-small cell lung cancer. J. Transl. Med. 2019; 17:152. [DOI] [PMC free article] [PubMed] [Google Scholar]
- 27. Song L., Pan S., Zhang Z., Jia L., Chen W.H., Zhao X.M.. STAB: a spatio-temporal cell atlas of the human brain. Nucleic Acids Res. 2021; 49:D1029–D1037. [DOI] [PMC free article] [PubMed] [Google Scholar]
- 28. Wu M., Ma L., Xue L., Zhu Q., Zhou S., Dai J., Yan W., Zhang J., Wang S.. Co-expression of the SARS-CoV-2 entry molecules ACE2 and TMPRSS2 in human ovaries: identification of cell types and trends with age. Genomics. 2021; 113:3449–3460. [DOI] [PMC free article] [PubMed] [Google Scholar]
- 29. Yang Z., Liu D., Guan R., Li X., Wang Y., Sheng B.. Potential genes and pathways associated with heterotopic ossification derived from analyses of gene expression profiles. J. Orthop. Surg. Res. 2021; 16:499. [DOI] [PMC free article] [PubMed] [Google Scholar]
- 30. Mousavi S.Z., Rahmanian M., Sami A.. A connectivity map-based drug repurposing study and integrative analysis of transcriptomic profiling of SARS-CoV-2 infection. Infect. Genet. Evol. 2020; 86:104610. [DOI] [PMC free article] [PubMed] [Google Scholar]
- 31. Pratapa A., Jalihal A.P., Law J.N., Bharadwaj A., Murali T.M.. Benchmarking algorithms for gene regulatory network inference from single-cell transcriptomic data. Nat. Methods. 2020; 17:147–154. [DOI] [PMC free article] [PubMed] [Google Scholar]
- 32. Warnat-Herresthal S., Schultze H., Shastry K.L., Manamohan S., Mukherjee S., Garg V., Sarveswara R., Händler K., Pickkers P., Aziz N.A.et al.. Swarm Learning for decentralized and confidential clinical machine learning. Nature. 2021; 594:265–270. [DOI] [PMC free article] [PubMed] [Google Scholar]
- 33. Hoehndorf R., Schofield P.N., Gkoutos G.V.. The role of ontologies in biological and biomedical research: a functional perspective. Brief. Bioinf. 2015; 16:1069–1080. [DOI] [PMC free article] [PubMed] [Google Scholar]
- 34. Xu X., Zhang Y., Williams J., Antoniou E., McCombie W.R., Wu S., Zhu W., Davidson N.O., Denoya P., Li E.. Parallel comparison of Illumina RNA-Seq and Affymetrix microarray platforms on transcriptomic profiles generated from 5-aza-deoxy-cytidine treated HT-29 colon cancer cells and simulated datasets. BMC Bioinf. 2013; 14:S1. [DOI] [PMC free article] [PubMed] [Google Scholar]
Associated Data
This section collects any data citations, data availability statements, or supplementary materials included in this article.
Data Availability Statement
GEO is publicly accessible at https://www.ncbi.nlm.nih.gov/geo/.


