Abstract
High-throughput plant phenotype acquisition technologies have been extensively utilized in plant phenomics studies, leading to vast quantities of images and image-based phenotypic traits (i-traits) that are critically essential for accelerating germplasm screening, plant diseases identification and biotic & abiotic stress classification. Here, we present the Open Plant Image Archive (OPIA, https://ngdc.cncb.ac.cn/opia/), an open archive of plant images and i-traits derived from high-throughput phenotyping platforms. Currently, OPIA houses 56 datasets across 11 plants, comprising a total of 566 225 images with 2 417 186 labeled instances. Notably, it incorporates 56 i-traits of 93 rice and 105 wheat cultivars based on 18 644 individual RGB images, and these i-traits are further annotated based on the Plant Phenotype and Trait Ontology (PPTO) and cross-linked with GWAS Atlas. Additionally, each dataset in OPIA is assigned an evaluation score that takes account of image data volume, image resolution, and the number of labeled instances. More importantly, OPIA is equipped with useful tools for online image pre-processing and intelligent prediction. Collectively, OPIA provides open access to valuable datasets, pre-trained models, and phenotypic traits across diverse plants and thus bears great potential to play a crucial role in facilitating artificial intelligence-assisted breeding research.
Graphical Abstract
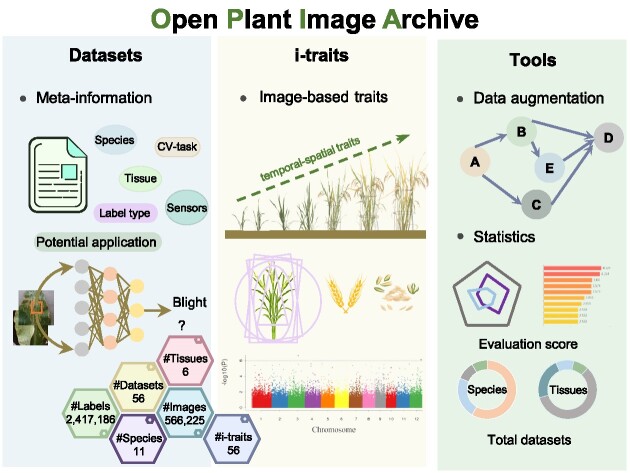
Graphical Abstract.
Introduction
Plant phenomics, as an innovative area for rapid and accurate acquisition of diverse phenotypic data (1), has been extensively utilized to discover favorable traits due to the advancement of high-throughput phenotyping technologies (2). These advanced technologies feature notable advantages, including non-invasiveness and the ability to rapidly and accurately obtain multi-dimensional phenotypic data from plants, resulting in the accumulation of images and i-traits at a fast-growing rate (3). In plant phenomics, i-traits refer to numerous quantifiable characteristics obtained through image analysis techniques, such as plant height and grain length. Recently, there has been an increasing utilization of image datasets acquired from various high-throughput plant imaging platforms to explore multi-tissue phenotypes. These datasets have enabled in-depth investigations into grain recognition and appearance inspection (4–6), plant density estimation (7–12), leaf disease symptoms detection (13,14), and biotic & abiotic stress classification (15). Furthermore, images have become an indispensable source in revealing the intricate correlations between i-traits and agronomic traits powered by computer vision technology and plant image processing tools (16–18). Clearly, plant image datasets and their resulting i-traits data are essential to identify valuable germplasm resources and accelerate the breeding process.
Over the past several years, several resources have been developed to collect plant image datasets from various image sensors (3,19–23). Among them, representative examples are Quantitative-plant (3,24), X-Plant (19), and Annotated Crop Image Dataset (ACID) (21). Quantitative-plant (3,24), developed in 2013, includes 31 image datasets, among which 13 datasets are associated with annotated instances. X-Plant (19) is a computed tomography (CT) database specifically created to gather three-dimensional structural images of plants and their organs such as roots and leaves. ACID (21), with the aim to review and compile annotated plant datasets for computer vision, provides limited metadata for only four plant image datasets across four species. Although valuable efforts have been made by existing resources, there are two primary limitations in common. For one thing, none of them integrates metadata extensively nor provides annotated details for each image, which is actually essential for promoting the reusability of plant image data. For another, they do not offer i-traits to explore novel traits, thus hindering further dynamic analysis of plant growth structures. As a result, there is an urgent need to establish a comprehensive resource specifically designed for plant image-based phenotypic data with high-quality metadata information.
Here, we introduce OPIA (https://ngdc.cncb.ac.cn/opia/), a curated resource that houses numerous image datasets and i-traits for both staple crops and model plants. In contrast to current plant-relevant databases, OPIA focuses on collecting image datasets that encompass the two primary tasks in plant phenotype analysis: image classification and object detection (25). OPIA features manual curation and image analysis and achieves well collection and organization of significantly valuable meta-information using controlled vocabularies. In addition, it offers user-friendly web interfaces and online tools for retrieving, browsing, downloading, and preprocessing image data. Overall, OPIA provides a valuable resource for plant image-phenotypic analysis and thus bears great utility to contribute to germplasm resource identification and accelerate plant breeding research.
Data curation and dataset evaluation
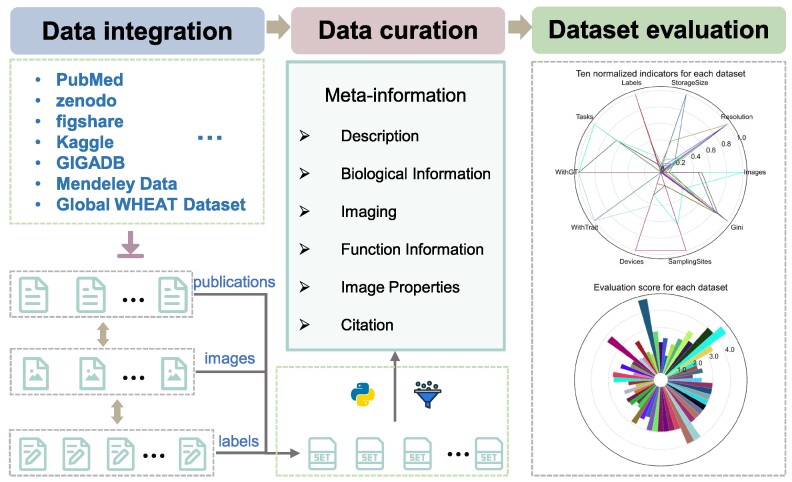
The aim of OPIA is to provide high-quality meta-information, which is achieved through a standardized curation pipeline that involves several critical steps – data integration, data curation, and dataset evaluation (Figure 1). Firstly, relevant publications or datasets are retrieved by using plant species names (scientific name and common name) or plant images as keywords (Supplementary Table S1). Then, the metadata of datasets is curated from publications, and the property of each image is extracted by a python script, respectively. All these meta-information are summarized into six main categories (description, biological information, function information, imaging, image properties, and citation) for each dataset. Furthermore, plant images of whole-growth period are captured by a high-throughput phenotyping facility (ScanLyzer, LemnaTec GmbH, Germany, https://www.lemnatec.com/). The ScanLyzer is a fully automated greenhouse system that enables controlled growth conditions. ScanLyzer captured RGB images of growing plants and culm. According to the image analysis process (26), plant-related traits, and culm-related traits are obtained. In addition, the SegNet (27) deep learning network is adopted to segment rice panicles, thus panicle-related traits are also obtained (Supplementary Figure S1). Phenological i-traits were analyzed based on these plants and panicles traits acquired during the whole growth period. Subsequently, each i-trait is mapped to the Plant Phenotype and Trait Ontology (PPTO) term, a controlled vocabulary that is used to describe plant traits, and cross-linked with GWAS Atlas (28,29). To evaluate the dataset overall, ten indicators are adopted to reflect the quantity of the image dataset (number of images), the quality of the images (resolution, storage size), the richness of the images (potential application tasks, number of labeled instances, sampling device prototypes, sampling location, presence of labels, presence of traits), and the balance of categories (Gini index) (Supplementary Table S2). Using the aforementioned meta-information and i-traits, ten quantified and normalized indicators are combined to yield an evaluation score for each dataset. This score allows users to evaluate and compare the integrity and applicability of various datasets. The evaluation score is calculated as follows:
Figure 1.
Data curation and dataset evaluation pipeline adopted by OPIA. The pipeline includes three critical steps. First, publications and datasets corresponding labels file are integrated from publicly available repositories. Then the information of all images and labels are filtered and extracted by the python scripts, and the meta-information of all datasets are manual curated from the publications. Third, all datasets are assigned an evaluation score based on ten indicators.
 |
(1) |
where d indicates the dth image dataset and Xi represents the ith indicators. Among these ten indicators, the Gini index is adopted to measure the balance of class distribution in image classification tasks:
 |
(2) |
where k represents the number of categories in the image classification dataset and pk is the probability of the image sample belonging to the kth category. More details about the ten indicators are publicly available at https://ngdc.cncb.ac.cn/opia/helps. The ranking of the indicators and the final evaluation scores of 56 datasets are shown in the Supplementary Figure S2.
Implementation
Frontend
The frontend of OPIA was built adopting Semantic UI (https://semantic-ui.com; a development framework that helps create beautiful, responsive layouts HTML) framework. The web interfaces were constructed utilizing JSP (Jakarta Server Pages, a template engine for web applications) and JQuery (https://jquery.com; a fast, small, and feature-rich JavaScript library). Furthermore, to make the webpage concise and intuitive, data visualization was built employing Echarts (https://echarts.apache.org/zh/index.html; a declarative framework for rapid construction of web-based visualization) and DataTables (https://datatables.net; a plug-in for the jQuery JavaScript library to render HTML tables). The interface enables users to retrieve datasets through pertinent information and browse the detailed meta-information and images of datasets easily. In addition, the interface allows users to download the images or the whole dataset conveniently.
Backend
OPIA was implemented using Spring Boot (https://spring.io/projects/spring-boot; a framework that follows the classic Model-View-Controller pattern) as the back-end framework. The meta-information was stored and managed in MySQL (http://www.mysql.org; a reliable and widely used relational database management system), and all image files were stored on a Linux server. The backend system responds to the requests from the frontend interface and retrieves pertinent data from the database. It ensures data security, stability, and efficiency, delivering accurate and rapid data support to the frontend interface.
Database contents and usages
OPIA features comprehensive integration of plant images and image-based phenotypic-traits (i-traits) data. The current version of OPIA includes 566 225 high-quality images with 56 datasets, comprising 2 417 186 annotated instances and six tissues across 11 plant species. OPIA also comprises 56 i-traits that are obtained from individual-based RGB images across the whole growth period of 93 rice and 105 wheat cultivars. The detailed statistical data mentioned above is summarized in Table 1 (as of August 2023). These data are organized by OPIA in a publicly accessible manner, primarily consisting of three core modules: datasets, i-traits, and tools & data services.
Table 1.
Data statistics in OPIA (as of 1 August 2023)
| Species | # Images | # Datasets | # Labeled instances | # Tissues | # i-traits |
|---|---|---|---|---|---|
| Arabidopsis (Arabidopsis thaliana) | 11051 | 3 | 152276 | 2 | − |
| Buckwheat (Fagopyrum esculentum) | 168 | 1 | 168 | 1 | − |
| Cassava (Manihot esculenta) | 40879 | 3 | 31863 | 2 | − |
| Common bean (Phaseolus vulgaris L.) | 1400 | 1 | 1507 | 1 | − |
| Maize (Zea mays) | 42929 | 8 | 214209 | 4 | − |
| Rapeseed (Brassica napus) | 120 | 1 | 77806 | 1 | − |
| Rice (Oryza sativa) | 177374 | 6 | 353578 | 4 | 41 |
| Soybean (Glycine max) | 27097 | 4 | 27097 | 2 | − |
| Sunflower (Helianthus annuus) | 328 | 1 | 328 | 1 | − |
| Sugar beet (Beta vulgaris) | 20720 | 2 | 7001 | 1 | − |
| Wheat (Triticum aestivum) | 244159 | 26 | 1551353 | 6 | 15 |
Note: - not available.
Datasets
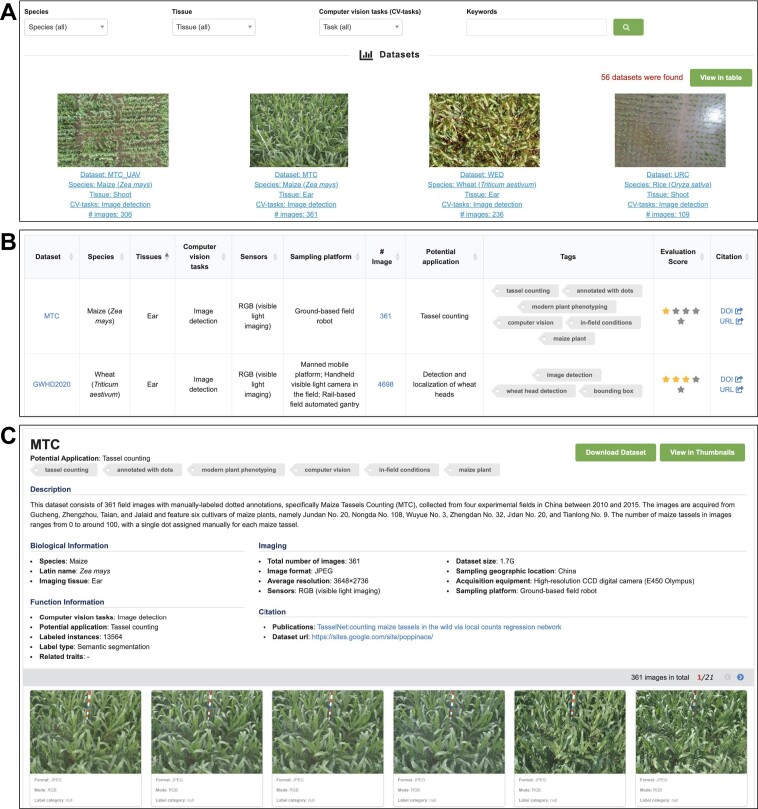
OPIA integrates the 56 plant image datasets, which were manually curated from 24 publications and multiple freely accessible databases. In OPIA, these datasets are available in two formats, a thumbnail view (Figure 2A) and a tabular format (Figure 2B) for user-friendly browsing. These formats allow for easy filtering by species, tissue, and computer vision tasks, thus enabling users to efficiently navigate the extensive list of datasets. The thumbnail view offers a concise summary of each dataset, covering key information such as the name, species, tissue, computer vision task, and images. Additionally, the table format presents metadata in terms of sensor, sampling platform, evaluation score, potential application, tags, and citation, allowing users to sort the table fields according to their preferences. Crucially, OPIA supplies a plethora of meta-information for each specific dataset (Figure 2C), covering general description, biological and functional information, imaging, image property, and citation. Each dataset could be briefly described as a curated collection of multiple tags, which aids users in quickly understanding the characteristics of any dataset of interest. Moreover, in OPIA, users are allowed to download either a single image or all images belonging to any specific dataset.
Figure 2.
Screenshots of OPIA web pages, including (A) datasets in thumbnails, (B) datasets in table and (C) datasets with detailed information.
i-traits
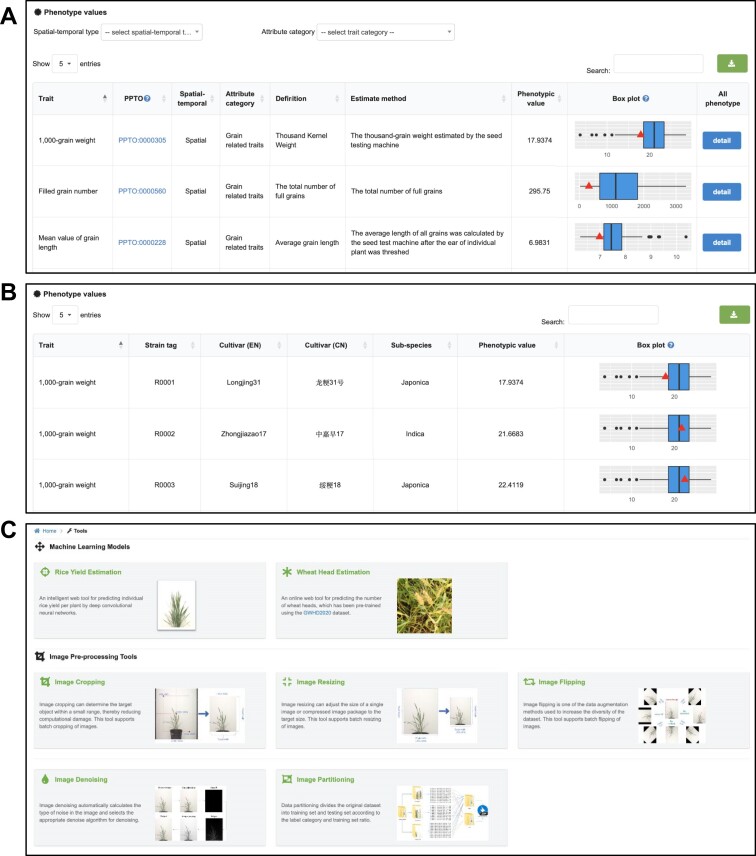
OPIA involves 56 i-traits, namely, 41 from rice and 15 from wheat, corresponding to 198 crop accessions including 93 rice cultivars and 105 wheat cultivars. These i-traits are associated with three single plant image datasets (WGSR, WGSW172, WGSW173), which were captured from the whole growth period by the ScanLyzer plant phenomics platform. The i-traits are categoried into seven groups including 5 plant-related traint, 3 plant growth-related traits, 6 culm-related traits, 20 panicle-related traits, 4 panicle development-related traits 8 grain-related traits and 10 phenological traits. The definitions and categories of analyzed i-traits are shown in Supplementary Table S3 (publicly avaiable at https://ngdc.cncb.ac.cn/opia/traits). For a given i-trait, OPIA provides basic descriptive information and detailed phenotype values of all cultivars. Basic information comprises trait definition, phenotypic value, and PPTO (Plant Phenotype and Trait Ontology), which is presented in a tabular format that allows users to sort the table based on key fields in the header (Figure 3A). The PPTO for each i-trait is annotated and cross-linked according to GWAS Atlas (28,29). In addition, OPIA offers Box-plot to illustrate the phenotypic value of all accessions in a species, which facilitates comparative analysis among phenotypic traits. Accordingly, detailed i-traits of all corresponding accessions are listed in the table (Figure 3B), including the general information of all accessions such as cultivar name, species, and subspecies. All these i-traits results are tabulated in OPIA and publicly available for download as a tab-delimited file in XLSX format.
Figure 3.
Screenshots of OPIA web pages, including (A) i-traits, (B) details of a specific i-trait and (C) tools.
Tools and data services
OPIA is also equipped with multiple online analysis and intelligent prediction tools to process plant image data for machine vision tasks. These tools are organized according to tasks such as image cropping, image resizing, image flipping, image denoising, and image partitioning supporting batch image preprocessing (Figure 3C). To run any tool in OPIA, a task ID will be generated, which can help users find the processed results in a convenient manner. The intelligient prediction tools support the estimation of yiled per plant and wheat head number. Furthermore, OPIA provides data uploading and downloading services. Various image formats (e.g. JPG, TIF, PNG, JPEG) captured by different types of imaging sensors (e.g. visible light, near-infrared, depth camera and chlorophyll fluorescence sensors) can be submitted via opia@big.ac.cn. Users can also submit a compiled dataset with relevant metadata (Supplementary Figure S3). All image datasets can be freely downloaded in a compressed zip format from https://ngdc.cncb.ac.cn/opia/downloads, which contains label records of image data in diverse formats (e.g. RSML (30), JSON, TXT, XML, MAT, CSV or H5). Collectively, these online tools and data services are invaluable for plant phenotyping research and application.
Potential applications of datasets and i-traits
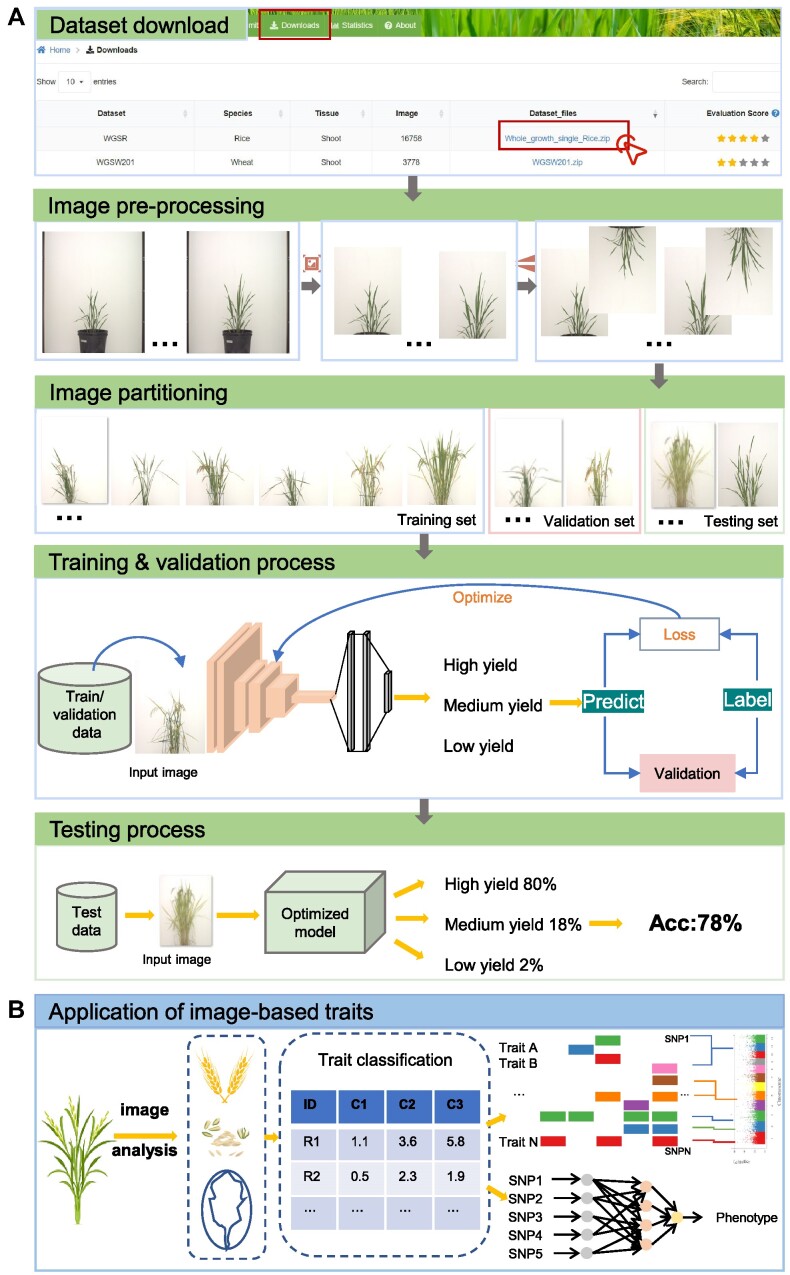
To highlight the potential applications of the in-house datasets in OPIA, we select WGSR dataset acquired by a controlled environment stationary platform as a case to describe the process of estimating the yield per plant (Figure 4A). First, users could access the dataset in the download interface. Then, they can process images utilizing the online tools equipped in OPIA including image cropping, image flipping, and image partitioning. In particular, the images could be partitioned into high yield, medium yield and low yield according to the phenotypic value of the yield per plant trait (available at https://ngdc.cncb.ac.cn/opia/traits). The pre-processed images could further be fed into the deep convolutional neural network (27,31) to learn features like shape, color and texture. After the deep network model is continuously optimized and iteratively updated until the loss is reduced to a certain range, users can utilize the unseen images (testing set) to predict the yield per plant. Accordingly, the combination of dataset and model have the potential to assist breeding researchers in accession selection.
Figure 4.
Applications of images and image-based traits in (A) yield estimation, (B) whole-genome association studies and whole-genome selection breeding.
Furthermore, phenotypic traits analyzed from images of the whole growth period also have potential application in genome-wide association studies and genome selective breeding (Figure 4B). Using a large amount of individual rice image data in OPIA, dozens of i-traits have been obtained through the image analysis pipeline. Users can perform correlation analysis with corresponding genetic data to identify genetic loci related to crop traits, e.g.Tang et al. found that 84.8% of phenotypic variation in rice yield could be explained by 58 i-traits (18), and Wang et al. identified 4945 trait-associated SNPs, and 1974 corresponding candidate genes (16). In addition, users can combine genotypes and i-traits to assist genome selection breeding using deep learning methods (32,33).
Discussion and future directions
OPIA features extensive collection of image datasets and their associated traits for a broad range of plants and offers user-friendly web interfaces designed to facilitate data browsing and reuse. The current version of OPIA has 56 datasets for 11 different plant species, containing a curated collection of 566 225 images and 2 417 186 labeled instances. Moreover, it houses 56 i-traits that are derived from RGB images encompassing 93 rice and 105 wheat cultivars. Thus, OPIA is an important plant phenotypic repository for providing datasets that have great utility in specific computer vision tasks. The plant image data available in OPIA is already quite extensive, although certain aspects require further improvement. For example, there are no types of fruit plants, which play a vital role in human diets. OPIA offers a download functionality for pre-trained machine learning models; however, it currently lacks a comprehensive description of these models. The addition of specific information on these models would undoubtedly attract more users from intelligent agriculture. The existing meta information of image datasets is limited. Inspired by management strategies of biomedical imaging data (34) and the plant phenotyping experiment (MIAPPE) standard (35), we expect to mine richer metadata with controlled vocabulary and ontologies. Future directions include frequent integration of more image datasets and i-traits across a wider range of plant species. Moreover, we aim to design a high-performance deep-learning algorithm to automatically extract geometric-related traits based on image datasets. Since there are multiple datasets with similar applications, we plan to integrate and normalize these corresponding datasets in order to expand training data for deep learning. We also call for collaborations worldwide to build OPIA as a valuable resource that covers a more diverse range of images and i-traits.
Supplementary Material
Acknowledgements
We thank a number of users for their contributions in reporting bugs and offering valuable suggestions.
Contributor Information
Yongrong Cao, National Genomics Data Center, Beijing Institute of Genomics, Chinese Academy of Sciences and China National Center for Bioinformation, Beijing 100101, China; CAS Key Laboratory of Genome Sciences and Information, Beijing Institute of Genomics, Chinese Academy of Sciences and China National Center for Bioinformation, Beijing 100101, China; University of Chinese Academy of Sciences, Beijing 100049, China.
Dongmei Tian, National Genomics Data Center, Beijing Institute of Genomics, Chinese Academy of Sciences and China National Center for Bioinformation, Beijing 100101, China; CAS Key Laboratory of Genome Sciences and Information, Beijing Institute of Genomics, Chinese Academy of Sciences and China National Center for Bioinformation, Beijing 100101, China.
Zhixin Tang, University of Chinese Academy of Sciences, Beijing 100049, China; Institute of Genetics and Developmental Biology, Chinese Academy of Sciences, Beijing 100101, China.
Xiaonan Liu, National Genomics Data Center, Beijing Institute of Genomics, Chinese Academy of Sciences and China National Center for Bioinformation, Beijing 100101, China; CAS Key Laboratory of Genome Sciences and Information, Beijing Institute of Genomics, Chinese Academy of Sciences and China National Center for Bioinformation, Beijing 100101, China; University of Chinese Academy of Sciences, Beijing 100049, China.
Weijuan Hu, Institute of Genetics and Developmental Biology, Chinese Academy of Sciences, Beijing 100101, China.
Zhang Zhang, National Genomics Data Center, Beijing Institute of Genomics, Chinese Academy of Sciences and China National Center for Bioinformation, Beijing 100101, China; CAS Key Laboratory of Genome Sciences and Information, Beijing Institute of Genomics, Chinese Academy of Sciences and China National Center for Bioinformation, Beijing 100101, China; University of Chinese Academy of Sciences, Beijing 100049, China.
Shuhui Song, National Genomics Data Center, Beijing Institute of Genomics, Chinese Academy of Sciences and China National Center for Bioinformation, Beijing 100101, China; CAS Key Laboratory of Genome Sciences and Information, Beijing Institute of Genomics, Chinese Academy of Sciences and China National Center for Bioinformation, Beijing 100101, China; University of Chinese Academy of Sciences, Beijing 100049, China.
Data availability
OPIA is freely available online at https://ngdc.cncb.ac.cn/opia/ and does not require the user to register.
Supplementary data
Supplementary Data are available at NAR Online.
Funding
The Science and Technology Innovation 2030 - Major Project [2022ZD04017 to S.S.]; National Natural Science Foundation of China [32000475 to D.T., 32030021 to Z.Z.]; Strategic Priority Research Program of the Chinese Academy of Sciences [XDA24040201 to S.S.]; Youth Innovation Promotion Association of the Chinese Academy of Sciences [Y2021038 to S.S.]. Funding for open access charge: Science and Technology Innovation 2030—Major Project [2022ZD04017 to S.S.].
Conflict of interest statement. None declared.
References
- 1. Pasala R., Pandey B.B.. Plant phenomics: high-throughput technology for accelerating genomics. J. Biosci. 2020; 45:111. [PubMed] [Google Scholar]
- 2. Harfouche A.L., Nakhle F., Harfouche A.H., Sardella O.G., Dart E., Jacobson D.. A primer on artificial intelligence in plant digital phenomics: embarking on the data to insights journey. Trends Plant Sci. 2023; 28:154–184. [DOI] [PubMed] [Google Scholar]
- 3. Lobet G., Draye X., Perilleux C.. An online database for plant image analysis software tools. Plant Methods. 2013; 9:1–8. [DOI] [PMC free article] [PubMed] [Google Scholar]
- 4. Fan L., Ding Y., Fan D., Di D., Pagnucco M., Song Y.. GrainSpace: a large-scale dataset for fine-grained and domain-adaptive recognition of cereal grains. 2022 IEEE/CVF Conference on Computer Vision and Pattern Recognition (CVPR). 2022; 21084–21093. [Google Scholar]
- 5. Cinar I., Koklu M.. Identification of rice varieties using machine learning algorithms. J. Agric. Sci.-Tarim. Bili. 2022; 28:307–325. [Google Scholar]
- 6. Kaya E., Saritas İ.. Towards a real-time sorting system: identification of vitreous durum wheat kernels using ANN based on their morphological, colour, wavelet and gaborlet features. Comput. Electron. Agric. 2019; 166:105016. [Google Scholar]
- 7. Lu H., Liu L., Li Y.-N., Zhao X.-M., Wang X.-Q., Cao Z.-G.. TasselNetV3: explainable plant counting with guided upsampling and background suppression. IEEE Trans. Geosci. Remote Sens. 2022; 60:1–15. [Google Scholar]
- 8. Xiong H., Cao Z., Lu H., Madec S., Liu L., Shen C.. TasselNetv2: in-field counting of wheat spikes with context-augmented local regression networks. Plant Methods. 2019; 15:150. [DOI] [PMC free article] [PubMed] [Google Scholar]
- 9. Lu H., Cao Z., Xiao Y., Zhuang B., Shen C.. TasselNet: counting maize tassels in the wild via local counts regression network. Plant Methods. 2017; 13:79. [DOI] [PMC free article] [PubMed] [Google Scholar]
- 10. Madec S., Jin X., Lu H., De Solan B., Liu S., Duyme F., Heritier E., Baret F.. Ear density estimation from high resolution RGB imagery using deep learning technique. Agric. For. Meteorol. 2019; 264:225–234. [Google Scholar]
- 11. Bai X., Liu P., Cao Z., Lu H., Xiong H., Yang A., Cai Z., Wang J., Yao J.. Rice plant counting, locating, and sizing method based on high-throughput UAV RGB images. Plant Phenomics. 2023; 5:0020. [DOI] [PMC free article] [PubMed] [Google Scholar]
- 12. Liu L., Lu H., Li Y., Cao Z.. High-throughput rice density estimation from transplantation to tillering stages using deep networks. Plant Phenomics. 2020; 2020:1–14. [DOI] [PMC free article] [PubMed] [Google Scholar]
- 13. Mignoni M.E., Honorato A., Kunst R., Righi R., Massuquetti A.. Soybean images dataset for caterpillar and Diabrotica speciosa pest detection and classification. Data Brief. 2022; 40:107756. [DOI] [PMC free article] [PubMed] [Google Scholar]
- 14. Peng Y., Wang Y.. Leaf disease image retrieval with object detection and deep metric learning. Front. Plant Sci. 2022; 13:963302. [DOI] [PMC free article] [PubMed] [Google Scholar]
- 15. Khanna R., Schmid L., Walter A., Nieto J., Siegwart R., Liebisch F.. A spatio temporal spectral framework for plant stress phenotyping. Plant Methods. 2019; 15:13. [DOI] [PMC free article] [PubMed] [Google Scholar]
- 16. Wang W., Guo W., Le L., Yu J., Wu Y., Li D., Wang Y., Wang H., Lu X., Qiao H.et al.. Integration of high-throughput phenotyping, GWAS, and predictive models reveals the genetic architecture of plant height in maize. Mol. Plant. 2023; 16:354–373. [DOI] [PMC free article] [PubMed] [Google Scholar]
- 17. Zhang G., Zhou J., Peng Y., Tan Z., Zhang Y., Zhao H., Liu D., Liu X., Li L., Yu L.et al.. High-throughput phenotyping-based quantitative trait loci mapping reveals the genetic architecture of the salt stress tolerance of Brassica napus. Plant Cell Environ. 2023; 46:549–566. [DOI] [PubMed] [Google Scholar]
- 18. Tang Z., Chen Z., Gao Y., Xue R., Geng Z., Bu Q., Wang Y., Chen X., Jiang Y., Chen F.et al.. A strategy for the acquisition and analysis of image-based phenome in rice during the whole growth period. Plant Phenomics. 2023; 5:0058. [DOI] [PMC free article] [PubMed] [Google Scholar]
- 19. Piovesan A., Vancauwenberghe V., Van De Looverbosch T., Verboven P., Nicolai B.. X-ray computed tomography for 3D plant imaging. Trends Plant Sci. 2021; 26:1171–1185. [DOI] [PubMed] [Google Scholar]
- 20. Sneddon T.P., Li P., Edmunds S.C.. GigaDB: announcing the GigaScience database. Gigascience. 2012; 1:11. [DOI] [PMC free article] [PubMed] [Google Scholar]
- 21. Pound M.P., Atkinson J.A., Wells D.M., Pridmore T.P., French A.P.. Deep Learning for Multi-task Plant Phenotyping. Proceedings of the IEEE International Conference on Computer Vision Workshops. 2017; 2055–2063. [Google Scholar]
- 22. Cho K.T., Portwood J.L. 2nd, Gardiner J.M., Harper L.C., Lawrence-Dill C.J., Friedberg I., Andorf C.M.. MaizeDIG: maize database of images and genomes. Front. Plant Sci. 2019; 10:1050. [DOI] [PMC free article] [PubMed] [Google Scholar]
- 23. Madsen S.L., Mathiassen S.K., Dyrmann M., Laursen M.S., Paz L.C., Jorgensen R.N.. Open plant phenotype database of common weeds in denmark. Remote. Sens. 2020; 12:1246. [Google Scholar]
- 24. Lobet G. Image analysis in plant sciences: publish then perish. Trends Plant Sci. 2017; 22:559–566. [DOI] [PubMed] [Google Scholar]
- 25. Pound M.P., Atkinson J.A., Townsend A.J., Wilson M.H., Griffiths M., Jackson A.S., Bulat A., Tzimiropoulos G., Wells D.M., Murchie E.H.et al.. Deep machine learning provides state-of-the-art performance in image-based plant phenotyping. Gigascience. 2017; 6:1–10. [DOI] [PMC free article] [PubMed] [Google Scholar]
- 26. Yang W., Guo Z., Huang C., Duan L., Chen G., Jiang N., Fang W., Feng H., Xie W., Lian X.et al.. Combining high-throughput phenotyping and genome-wide association studies to reveal natural genetic variation in rice. Nat. Commun. 2014; 5:5087. [DOI] [PMC free article] [PubMed] [Google Scholar]
- 27. Simonyan K., Zisserman A.. Very deep convolutional networks for large-scale image recognition. 2014; arXiv doi:4 September 2014, preprint: not peer reviewed 10.48550/arXiv.1409.1556. [DOI]
- 28. Tian D., Wang P., Tang B., Teng X., Li C., Liu X., Zou D., Song S., Zhang Z.. GWAS Atlas: a curated resource of genome-wide variant-trait associations in plants and animals. Nucleic Acids Res. 2020; 48:D927–D932. [DOI] [PMC free article] [PubMed] [Google Scholar]
- 29. Liu X., Tian D., Li C., Tang B., Wang Z., Zhang R., Pan Y., Wang Y., Zou D., Zhang Z.et al.. GWAS Atlas: an updated knowledgebase integrating more curated associations in plants and animals. Nucleic Acids Res. 2023; 51:D969–D976. [DOI] [PMC free article] [PubMed] [Google Scholar]
- 30. Lobet G., Pound M.P., Diener J., Pradal C., Draye X., Godin C., Javaux M., Leitner D., Meunier F., Nacry P.et al.. Root system markup language: toward a unified root architecture description language. Plant Physiol. 2015; 167:617–627. [DOI] [PMC free article] [PubMed] [Google Scholar]
- 31. He K., Zhang X., Ren S., Sun J.. Deep residual learning for image recognition. 2016 IEEE Conference on Computer Vision and Pattern Recognition (CVPR). 2016; 770–778. [Google Scholar]
- 32. Wang K., Abid M.A., Rasheed A., Crossa J., Hearne S., Li H.. DNNGP, a deep neural network-based method for genomic prediction using multi-omics data in plants. Mol. Plant. 2023; 16:279–293. [DOI] [PubMed] [Google Scholar]
- 33. Ma W., Qiu Z., Song J., Li J., Cheng Q., Zhai J., Ma C.. A deep convolutional neural network approach for predicting phenotypes from genotypes. Planta. 2018; 248:1307–1318. [DOI] [PubMed] [Google Scholar]
- 34. Jin E., Zhao D., Wu G., Zhu J., Wang Z., Wei Z., Zhang S., Wang A., Tang B., Chen X.et al.. OBIA: an open biomedical imaging archive. Genomics Proteomics Bioinformatics. 2023; 10.1016/j.gpb.2023.09.003. [DOI] [PubMed] [Google Scholar]
- 35. Papoutsoglou E.A., Faria D., Arend D., Arnaud E., Athanasiadis I.N., Chaves I., Coppens F., Cornut G., Costa B.V., Cwiek-Kupczynska H.et al.. Enabling reusability of plant phenomic datasets with MIAPPE 1.1. New Phytol. 2020; 227:260–273. [DOI] [PMC free article] [PubMed] [Google Scholar]
Associated Data
This section collects any data citations, data availability statements, or supplementary materials included in this article.
Supplementary Materials
Data Availability Statement
OPIA is freely available online at https://ngdc.cncb.ac.cn/opia/ and does not require the user to register.


