Abstract
BloodSpot is a specialised database integrating gene expression data from acute myeloid leukaemia (AML) patients related to blood cell development and maturation. The database and interface has helped numerous researchers and clinicians to quickly get an overview of gene expression patterns in healthy and malignant haematopoiesis. Here, we present an update to our framework that includes protein expression data of sorted single cells. With this update we also introduce datasets broadly spanning age groups, which many users have requested, with particular interest for researchers studying paediatric leukaemias. The backend of the database has been rewritten and migrated to a cloud-based environment to accommodate the growth, and provide a better user-experience for our many international users. Users can now enjoy faster transfer speeds and a more responsive interface. In conclusion, the continuing popularity of the database and emergence of new data modalities has prompted us to rewrite and futureproof the back-end, including paediatric centric views, as well as single cell protein data, allowing us to keep the database updated and relevant for the years to come. The database is freely available at www.bloodspot.eu.
Graphical Abstract
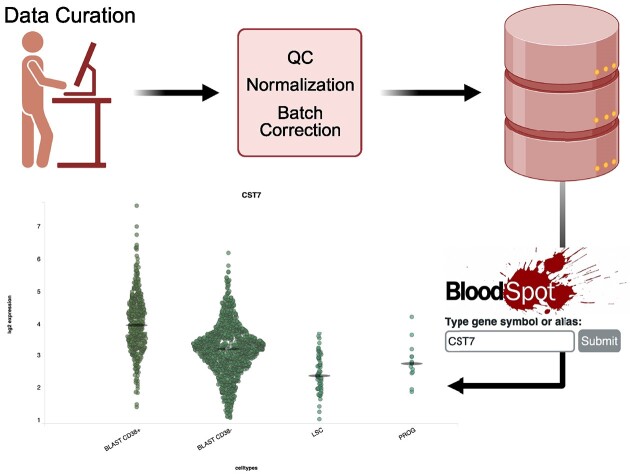
Graphical Abstract.
Introduction
BloodSpot (1–4) is a resource that enables convenient studying of gene expression dynamics in blood and bone marrow cells, specifically under conditions of hematopoietic differentiation, blood cell maturation and leukaemia, with a focus on acute myeloid leukaemia (AML). A growing number of carefully curated datasets have enabled researchers to gain insights into the complex gene expression dynamics guiding the differentiation and maturation of blood cells, thereby fostering hypothesis and acting as orthogonal validation to experiments designed for gaining understanding into both normal and pathological haematologic processes (5,6). The value added to the publicly available raw data has been data curation, quality filtering and, importantly, batch correction and data integration. This work has enabled users to analyse at a glance integrated datasets consisting of samples from different studies, which together can provide new and important insights. Popular mention is datasets with leukaemia blast populations side-by-side with sorted normal populations (7).
Advances in single-cell technologies have unlocked unprecedented resolution in profiling individual cellular states, adding new dimensions to our understanding of cellular heterogeneity within complex tissues. A concurrent realisation with the emergence of single cell data has been the fact that profiles of well-defined cellular populations, as sorted by fluorescence-activated cell sorting (FACS) are important references to understand cellular dynamics, which then also acts as a scaffold to understand function identity and state of unsorted cellular clusters. This has prompted us to maintain focus on both sorted and unsorted cells, whereas other projects solely embrace the unlabelled nature of bulk single cells sequencing data with predicted or inferred cell types (8) typically from droplet-based protocols (9). Recently, single cell proteomics has provided a nuanced understanding of functional protein changes associated with genetic shifts (10), effectively bridging the gap between genotype and phenotype, which we have introduced and will expand as more data becomes available. Moreover, paediatric leukemias, that present themselves with unique molecular signatures and aberrant differentiation patterns, distinct from their adult counterparts, have been added to the database to serve the childhood and paediatric AML and AEL communities (11,12). We will continue to grow this area of the database, aiding in therapeutic discoveries and stratifications, which has been a requested addition by our users.
Materials and methods
Server infrastructure
The newest release of BloodSpot includes a comprehensive update of the backend, in order to accommodate new data and provide a distributed system, which will give a more responsive experience for international users, who have long suffered the physical distance to our servers in Copenhagen. This meant migration to a cloud infrastructure, which warranted revamping HTML and PHP code and MySQL database. The MySQL is now migrated to a version 10.6.15 Ubuntu Maria DB database hotel, and PHP code is updated to a modern version 8.2.
Protein data
Protein data has been processed as detailed in Schoof and Furtwängler et al. (10), briefly, cells from the OCI-AML8227 culture model (13) were FACS sorted and processed for subsequent single-cell proteomics mass spectrometry acquisition on a ThermoFisher Orbitrap Exploris 480 mass spectrometer. Data was processed using the SCeptre python package (10). Missing values are not plotted in the web interface.
Gene expression data
All gene expression datasets compiled from multiple laboratories have been assessed for batch and quality, and batch corrected using ComBat (14). Metadata from Illaria et al. (12) was compiled into a super-group of age_group and revised World Health Organization (WHO) and to allow for separation on both age and disease classification information.
Visualisation
Main plots are SinaPlot (15) implemented in D3, where maximum width is given by total number of samples. This behaviour is no longer default in SinaPlot implementations, but allows for easier comparison of distribution of samples across groups. Both SinaPlots and Tree plots are dynamically produced, whereas all survival plots are pre-computed from TCGA AML data (16). Tree plots are based on differentiation patterns, where applicable, or sample group correlation otherwise.
Results
BloodSpot (1–4) has served as quick portal into data of sorted normal cells, AML leukemic blasts by WHO classification (17), and lately also single cell datasets (18,19). The database contains gene expression profiles from microarray and RNA-Seq data of various blood cell types across different stages of haematopoiesis. This includes stem cells, progenitor cells and mature blood cells of various lineages, for the investigation of differentiation and maturation. Users can search for genes that correlate with the query gene, making it possible to discover co-regulatory mechanisms and find robust marker sets. With this update we introduce additional AML and AEL datasets with a broad range of age groups that we have used as grouping-criteria, together with disease classification. This will allow the study of age effects, to the benefit of the many users who over the years have requested the capability to analyse transcriptional patters across paediatric and adult leukaemias. In addition, we open space for new data in the proteomics space, where we have already included a single cell proteome dataset ready for browsing and we look forward to expanding this section as more data becomes available. An overview of datasets added since last release can be found in Supplementary Table S1. We have decommissioned the pathway search functionality, which allowed users to search for gene signatures from MSigDB (20) rather than gene names, as it was not being used.
Collectively, we introduce important expansions of the BloodSpot database. This includes the integration of single-cell proteomics data, that paves the way for a richer perspective of blood cell states, and of paediatric leukaemia profiles, augmenting the potential of BloodSpot to continue to serve as a reference for both basic research and clinical investigators within molecular haematology.
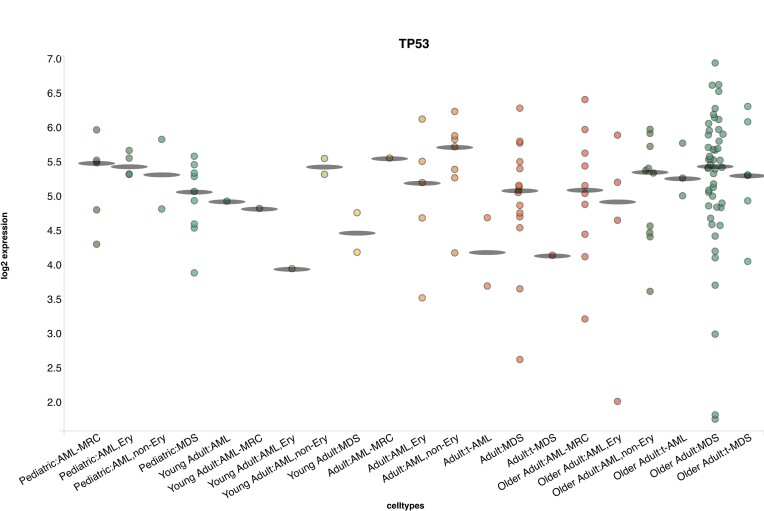
To elucidate age related effects we queried TP53 in the newly added dataset from Iacobucci et al. (12), because it is known to be commonly mutated in adult AML, but virtually never in paediatric cases (11,12). We found an increase in variation and an increase in number of cases with very low or no expression of TP53 co-occurring with increased age (Figure 1).
Figure 1.
Example output from BloodSpot database with data from (12) categorized by age and WHO classification with query for gene TP53.
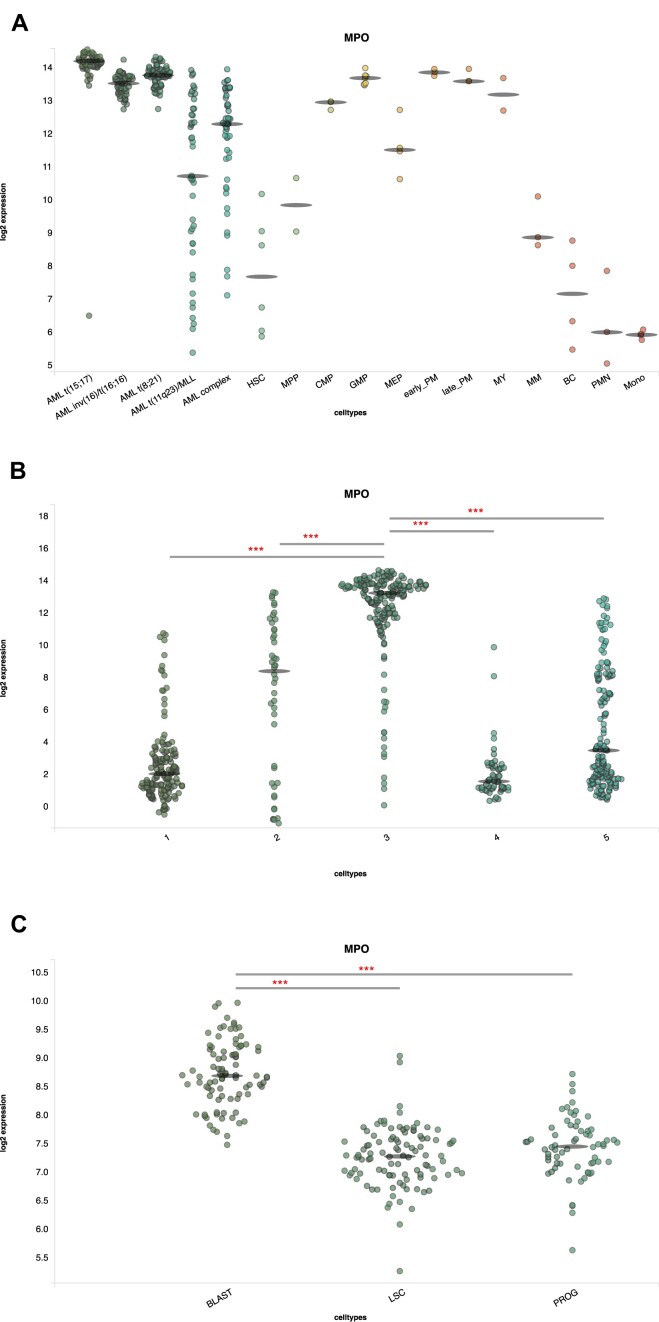
In order to investigate the protein manifestation of a transiently expressed genes we submitted the query gene MPO, a myeloid differentiation marker (21), to three datasets: the default dataset with AML and normal sorted hematopoietic cells (2), clustered Lin-CD34+ single cells from Velten et al. (19) and single cell sorted proteome cells (10). MPO clearly has distinct expression in MLL and complex AML from three other karyotypes, and displays transient expression with low expression in the stem compartment and high expression in progenitors (Figure 2A). In the single cell expression data there are also clear signs of transient expression (Figure 2B), with cluster 3 notably showing higher expression. Interestingly, the proteome data (Figure 2C) appears to show accumulation of the protein from stem cells (LSC) to progenitors (PROG) and blasts, which could be explained by a shorter half-life and effect of RNA compared to protein, or due to the nature of the AML model OCI-AML8227 (13).
Figure 2.
Output from BloodSpot database with query gene MPO and data from three different datasets. (A) ‘Normal Hematopoiesis with AMLs’, (B) ‘human single cell normal HSC (Velten 2017)’ and (C) ‘enriched population AML proteome’. Abbreviations are in panel A: AML complex: AML with complex aberrant karyotype; HSC: hematopoietic stem cell; MPP: multipotential progenitors; CMP: common myeloid progenitor cell; GMP: granulocyte monocyte progenitors; MEP: megakaryocyte-erythroid progenitor cell; early_PM: Early Promyelocyte; late_PM: late promyelocyte; MY: myelocyte; MM: metamyelocytes; BC: band cell; PMN: polymorphonuclear cells; Mono: monocytes, in panel B: numbers indicate clusters of unsupervised clustering, and in panel C: LSC:leukemic stem cell; PROG: progenitor of blast.
Conclusions
The BloodSpot 3.0 update represents a significant improvement in the database's capabilities, incorporating single-cell proteomics data and expanding its coverage to include paediatric leukaemia profiles. These enhancements will empower researchers and clinicians in their studies of hematopoiesis, leukaemia and related fields. The database is freely available with no registration at www.bloodspot.eu.
Supplementary Material
Acknowledgements
We thank warmly Ilaria Iacobucci and Charles G. Mullighan, for early access to data and for kindly assisting us with processed data and metadata.
Contributor Information
Magnús H Gíslason, Center for Genomic Medicine, Rigshospitalet Copenhagen University Hospital, Copenhagen DK-2200, Denmark.
Gül Sude Demircan, Center for Genomic Medicine, Rigshospitalet Copenhagen University Hospital, Copenhagen DK-2200, Denmark.
Marek Prachar, Center for Genomic Medicine, Rigshospitalet Copenhagen University Hospital, Copenhagen DK-2200, Denmark; Bioinformatics Centre, Department of Biology, University of Copenhagen, Copenhagen DK-2200, Denmark.
Benjamin Furtwängler, The Finsen Laboratory, Copenhagen University Hospital–Rigshospitalet, Copenhagen DK-2200, Denmark; Biotech Research and Innovation Center, Faculty of Health Sciences, University of Copenhagen, Copenhagen DK-2200, Denmark; Department of Biotechnology and Biomedicine, Technical University of Denmark, Kgs. Lyngby DK-2800, Denmark.
Juerg Schwaller, University Children's Hospital Basel, University of Basel, Basel, Switzerland; Department of Biomedicine, University of Basel, Basel, Switzerland.
Erwin M Schoof, Department of Biotechnology and Biomedicine, Technical University of Denmark, Kgs. Lyngby DK-2800, Denmark.
Bo Torben Porse, The Finsen Laboratory, Copenhagen University Hospital–Rigshospitalet, Copenhagen DK-2200, Denmark; Biotech Research and Innovation Center, Faculty of Health Sciences, University of Copenhagen, Copenhagen DK-2200, Denmark; Department of Clinical Medicine, University of Copenhagen, Copenhagen, Denmark.
Nicolas Rapin, Danish National Genome Center, Copenhagen DK-2300, Denmark.
Frederik Otzen Bagger, Center for Genomic Medicine, Rigshospitalet Copenhagen University Hospital, Copenhagen DK-2200, Denmark.
Data availability
BloodSpot 3.0 is available at www.bloodspot.eu. All data is publicly available and linked to relevant repositories as they appear in the web interface and supplementary table 1.
Supplementary data
Supplementary Data are available at NAR Online.
Funding
Work in the E.M.S. lab is supported by grants from the Novo Nordisk Foundation [NNF21OC0071016]; Independent Research Fund Denmark [case no. 2067-00053B]; Lundbeck Foundation [R413-2022-869]; B.F. is the recipient of a fellowship from the Novo Nordisk Foundation as part of the Copenhagen Bioscience PhD Programme [NNF19SA0035442]. Funding for open access charge: Hospital budget.
Conflict of interest statement. None declared.
References
- 1. Bagger F.O., Rapin N., Theilgaard-Mönch K., Kaczkowski B., Jendholm J., Winther O., Porse B.. HemaExplorer: a Web server for easy and fast visualization of gene expression in normal and malignant hematopoiesis. Blood. 2012; 119:6394–6395. [DOI] [PubMed] [Google Scholar]
- 2. Bagger F.O., Rapin N., Theilgaard-Mönch K., Kaczkowski B., Thoren L.A., Jendholm J., Winther O., Porse B.T.. HemaExplorer: a database of mRNA expression profiles in normal and malignant haematopoiesis. Nucleic Acids Res. 2013; 41:D1034–D1039. [DOI] [PMC free article] [PubMed] [Google Scholar]
- 3. Bagger F.O., Sasivarevic D., Sohi S.H., Laursen L.G., Pundhir S., Sønderby C.K., Winther O., Rapin N., Porse B.T.. BloodSpot: a database of gene expression profiles and transcriptional programs for healthy and malignant haematopoiesis. Nucleic Acids Res. 2016; 44:D917–D924. [DOI] [PMC free article] [PubMed] [Google Scholar]
- 4. Bagger F.O., Kinalis S., Rapin N.. BloodSpot: a database of healthy and malignant haematopoiesis updated with purified and single cell mRNA sequencing profiles. Nucleic Acids Res. 2019; 47:D881–D885. [DOI] [PMC free article] [PubMed] [Google Scholar]
- 5. Lauridsen F.K.B., Jensen T.L., Rapin N., Aslan D., Wilhelmson A.S., Pundhir S., Rehn M., Paul F., Giladi A., Hasemann M.S.et al.. Differences in cell cycle status underlie transcriptional heterogeneity in the HSC compartment. Cell Rep. 2018; 24:766–780. [DOI] [PubMed] [Google Scholar]
- 6. Loizou E., Banito A., Livshits G., Ho Y.-J., Koche R.P., Sánchez-Rivera F.J., Mayle A., Chen C.-C., Kinalis S., Bagger F.O.et al.. A gain-of-function p53-mutant oncogene promotes cell fate plasticity and myeloid leukemia through the pluripotency factor FOXH1. Cancer Discov. 2019; 9:962–979. [DOI] [PMC free article] [PubMed] [Google Scholar]
- 7. Rapin N., Bagger F.O., Jendholm J., Mora-Jensen H., Krogh A., Kohlmann A., Thiede C., Borregaard N., Bullinger L., Winther O.et al.. Comparing cancer vs normal gene expression profiles identifies new disease entities and common transcriptional programs in AML patients. Blood. 2014; 123:894–904. [DOI] [PubMed] [Google Scholar]
- 8. Gao X., Hong F., Hu Z., Zhang Z., Lei Y., Li X., Cheng T.. ABC portal: a single-cell database and web server for blood cells. Nucleic Acids Res. 2022; 51:D792–D804. [DOI] [PMC free article] [PubMed] [Google Scholar]
- 9. Bagger F.O., Probst V.. Single cell sequencing in cancer diagnostics. Adv. Exp. Med. Biol. 2020; 1255:175–193. [DOI] [PubMed] [Google Scholar]
- 10. Schoof E.M., Furtwängler B., Üresin N., Rapin N., Savickas S., Gentil C., Lechman E., Keller U.A.D., Dick J.E., Porse B.T.. Quantitative single-cell proteomics as a tool to characterize cellular hierarchies. Nat. Commun. 2021; 12:3341. [DOI] [PMC free article] [PubMed] [Google Scholar]
- 11. Bolouri H., Farrar J.E., Triche T. Jr, Ries R.E., Lim E.L., Alonzo T.A., Ma Y., Moore R., Mungall A.J., Marra M.A.et al.. The molecular landscape of pediatric acute myeloid leukemia reveals recurrent structural alterations and age-specific mutational interactions. Nat. Med. 2018; 24:103–112. [DOI] [PMC free article] [PubMed] [Google Scholar]
- 12. Iacobucci I., Wen J., Meggendorfer M., Choi J.K., Shi L., Pounds S.B., Carmichael C.L., Masih K.E., Morris S.M., Lindsley R.C.et al.. Genomic subtyping and therapeutic targeting of acute erythroleukemia. Nat. Genet. 2019; 51:694–704. [DOI] [PMC free article] [PubMed] [Google Scholar]
- 13. Lechman E.R., Gentner B., Ng S.W.K., Schoof E.M., van Galen P., Kennedy J.A., Nucera S., Ciceri F., Kaufmann K.B., Takayama N.et al.. miR-126 regulates distinct self-renewal outcomes in normal and malignant hematopoietic stem cells. Cancer Cell. 2016; 29:602–606. [DOI] [PMC free article] [PubMed] [Google Scholar]
- 14. Johnson W.E., Li C., Rabinovic A.. Adjusting batch effects in microarray expression data using empirical Bayes methods. Biostatistics. 2006; 8:118–127. [DOI] [PubMed] [Google Scholar]
- 15. Sidiropoulos N., Sohi S.H., Pedersen T.L., Porse B.T., Winther O., Rapin N., Bagger F.O.. SinaPlot: an enhanced chart for simple and truthful representation of single observations over multiple classes. J. Comput. Graph. Stat. 2017; 3:673–676. [Google Scholar]
- 16. Arceci R.J., Berman J.N., Meshinchi S.. Cancer Genomics: Chapter 17. Acute Myeloid Leukemia. 2014; Boston: Academic Press; 283–300. [Google Scholar]
- 17. Arber D.A., Orazi A., Hasserjian R., Thiele J., Borowitz M.J., Le Beau M.M., Bloomfield C.D., Cazzola M., Vardiman J.W.. The 2016 revision to the World Health Organization classification of myeloid neoplasms and acute leukemia. Blood. 2016; 127:2391–2405. [DOI] [PubMed] [Google Scholar]
- 18. Paul F., Arkin Y.’a., Giladi A., Jaitin D.A., Kenigsberg E., Keren-Shaul H., Winter D., Lara-Astiaso D., Gury M., Weiner A.et al.. Transcriptional heterogeneity and lineage commitment in myeloid progenitors. Cell. 2016; 164:325. [DOI] [PubMed] [Google Scholar]
- 19. Velten L., Haas S.F., Raffel S., Blaszkiewicz S., Islam S., Hennig B.P., Hirche C., Lutz C., Buss E.C., Nowak D.et al.. Human haematopoietic stem cell lineage commitment is a continuous process. Nat. Cell Biol. 2017; 19:271–281. [DOI] [PMC free article] [PubMed] [Google Scholar]
- 20. Liberzon A., Birger C., Thorvaldsdóttir H., Ghandi M., Mesirov J.P., Tamayo P.. The Molecular Signatures Database (MSigDB) hallmark gene set collection. Cell Syst. 2015; 1:417–425. [DOI] [PMC free article] [PubMed] [Google Scholar]
- 21. Nauseef W.M., Olsson I., Arnljots K.. Biosynthesis and processing of myeloperoxidase–a marker for myeloid cell differentiation. Eur. J. Haematol. 1988; 40:97–110. [DOI] [PubMed] [Google Scholar]
Associated Data
This section collects any data citations, data availability statements, or supplementary materials included in this article.
Supplementary Materials
Data Availability Statement
BloodSpot 3.0 is available at www.bloodspot.eu. All data is publicly available and linked to relevant repositories as they appear in the web interface and supplementary table 1.


