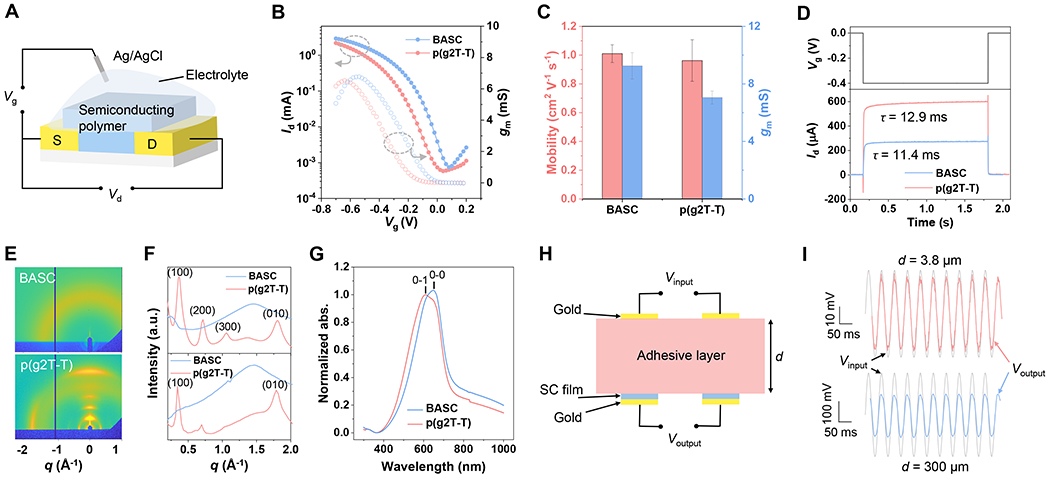
Fig. 3. Electrical and structural characterizations of the BASC film.

(A) Setup for the OECT-based characterizations. (B) Transfer curves from a BASC film and a p(g2T-T) film serving as the OECT channel (Vg: gate voltage, Id: drain current, Vd: drain voltage, gm: transconductance). (C) Charge-carrier mobility and gm for the BASC and p(g2T-T) films. Values represent the mean and the standard deviation (n = 5). (D) Response speed measurement with applied gate voltage pulse and drain current response. (E) 2D GIXD patterns of the BASC and p(g2T-T) films. (F) 1D linecuts in the out-of-plane direction (top) and in-plane direction (bottom) of a BASC and a p(g2T-T) film. (G) Normalized UV-vis absorption of a BASC and a p(g2T-T) film. (H) Schematic diagram showing the setup for characterizing the influence of the device-tissue distance caused by the use of a separate bioadhesive layer. (I) AC signal input (grey) and acquired signals between the p(g2T-T) electrodes that are covered with a layer of BAP with two different thicknesses. The thin adhesive layer (d = 3.8 μm) decreases the signal amplitude by 15 % while the thick adhesive layer (d = 300 μm) decreases the amplitude by 50 %.
