Abstract
Consuming excessive amounts of alcohol causes impaired mobility and judgment and driving accidents, resulting in more than 800 injuries and fatalities each day. Passive methods to detect intoxicated drivers beyond the safe driving limit can facilitate Just-In-Time alerts and reduce Driving Under the Influence (DUI) incidents. Popularly-owned smartphones are not only equipped with motion sensors (accelerometer and gyroscope) that can be employed for passively collecting gait (walk) data but also have the processing power to run computationally expensive machine learning models. In this paper, we advance the state-of-the-art by proposing a novel method that utilizes a Bi-linear Convolution Neural Network (BiCNN) for analyzing smartphone accelerometer and gyroscope data to determine whether a smartphone user is over the legal driving limit (0.08) from their gait. After segmenting the gait data into steps, we converted the smartphone motion sensor data to a Gramian Angular Field (GAF) image and then leveraged the BiCNN architecture for intoxication classification. Distinguishing GAF-encoded images of the gait of intoxicated vs. sober users is challenging as the differences between the classes (intoxicated vs. sober) are subtle, also known as a fine-grained image classification problem. The BiCNN neural network has previously produced state-of-the-art results on fine-grained image classification of natural images. To the best of our knowledge, our work is the first to innovatively utilize the BiCNN to classify GAF encoded images of smartphone gait data in order to detect intoxication. Prior work had explored using the BiCNN to classify natural images or explored other gait-related tasks but not intoxication Our complete intoxication classification pipeline consists of several important pre-processing steps carefully adapted to the BAC classification task, including step detection and segmentation, data normalization to account for inter-subject variability, data fusion, GAF image generation from time-series data, and a BiCNN classification model. In rigorous evaluation, our BiCNN model achieves an accuracy of 83.5%, outperforming the previous state-of-the-art and demonstrating the feasibility of our approach.
Keywords: Neural Networks, Gait Analysis, Blood Alchol Content (BAC), Convolutional Neural Networks (CNNs)
I. INTRODUCTION
Excessive alcohol consumption is associated with numerous health risks and accounts for more than 380 deaths per day [56]. Beyond medical issues, alcohol consumption often results in risky and violent situations, such as drunk driving. In 2013, 10,076 crash fatalities in the US (nearly a third) involved impaired driving due to alcohol. These consequences are mainly due to alcohol’s detrimental effects on psychomotor performance [57], which lead to poor decision-making [58]. Timely detection of intoxication can facilitate lifesaving interventions. Currently, breathalyzers are the most popular and most accurate method of measuring blood intoxication levels [28]. However, breathalyzers need to be purchased in advance and carried around, making them inconvenient to use. Novel methods for passively measuring the alcohol-related psychomotor impairments and providing real-time notifications can help avoid life-risking behaviors such as driving under the influence and reduce the likelihood of injury [59]. A drinker’s gait is a reliable measure of psychomotor impairment that is particularly sensitive to alcohol. Intoxication impairs subjects’ gait, characterized by increased trunk sway and changes in their gait kinetics and kinematics [27] and in attributes such as gait velocity, walking balance, cadence stride attributes [5] [6].
Gait analysis is a convenient and reliable method of estimating Blood Alcohol Concentration (BAC), which can done passively and unobtrusively. Gait analysis as a field is the systematic study and analysis of human walking to discover abnormalities, disease pathologies [2], health conditions, and impairment due to consumed substances such as alcohol [22]. Today, gait analysis is widely used to monitor diseases that affect the locomotor system, such as Parkinson’s disease (PD) [37], Huntington’s disease [38], Traumatic Brain Injury (TBI), and Tetanus [7]. Previously proposed gait analysis methods include mathematical modeling [2] [3], mechanical engineering, and, more recently, machine learning analysis [29]. The literature includes several literature reviews and surveys on methods of gait analysis [31]–[36]. Besides, several prior papers have discussed the strengths of utilizing applying deep learning for gait classification [61]–[66]. Our work differs from these prior works, which are outlined in section II and table I, as they either focused on other devices (e.g. wearable sensors and smart shoes) or predicted other conditions such as freeze of gait associated with Parkinson’s disease.
TABLE II.
Inertial sensors’ attribute of Google Pixel utilized in experiment
| IMU Sensors Datasheet | ||
|---|---|---|
| Parameter | Accelerometer | Gyroscope |
| Output Rate | 12.5 to 1600 Hz | 25 Hz to 3200 Hz |
| Sampling Rate | 30 kHz | |
| Final Frequency (3 dB Cutoff Bandwidth) | About 220 Hz | About 440 Hz |
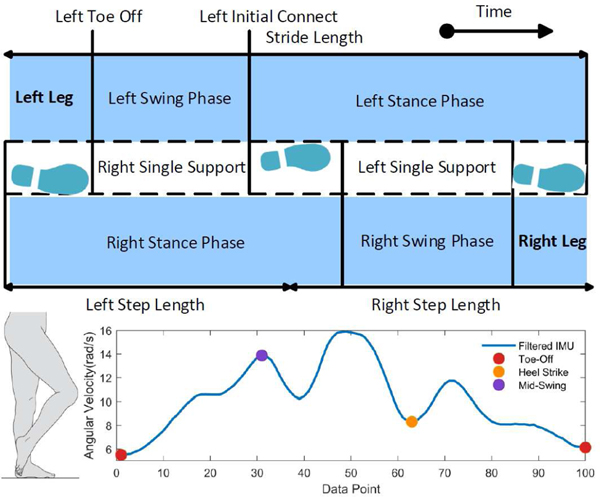
Figure 1 (top) shows the foot placement, stances, and phases of a single gait cycle. The bottom figure illustrates the magnitude of the corresponding accelerometer signal of a smartphone carried on a user’s hip during the gait cycle. This example was generated from a single sober step data sample in a smartphone gait dataset we gathered in a human subjects study that will be explained in section IV-A.
Fig. 1.
Gait cycle, stance and foot placement during one step (top). Corresponding accelerometer magnitude (bottom)
Gait analysis to detect intoxication involves identifying subtle deviations of a subject’s gait from baseline. Robust intoxication detection should be accurate across genders, age ranges, and subjects’ alcohol tolerance differences. Detecting intoxication from gait is a challenging problem for several reasons. First, the differences between a subject’s sober and intoxicated sensor data are minor. In fact, the differences are so subtle that it takes years of training for gait experts to get trained. Secondly, individuals have a wide range of walk patterns even when sober, resulting in large intra-class variability. Thirdly, people typically have a wide range of alcohol tolerance, resulting in different subjects exhibiting different levels of alcohol-induced gait impairments even when they consume the same amount of alcohol or are at the same BAC level. Finally, various real-world factors alter the gait signal captured, including different phone placements, looseness of clothing, hardness of the heels of the subject’s shoes, and how tightly the smartphone is attached.
In this paper, we explored gait analysis to detect intoxication using neural networks and gait data recorded from smartphone sensors. Smartphones, owned by 85% of the US population [23], not only come equipped with accelerometers and gyroscopes facilitating the passive gathering of user’s gait data but also possess the computational power to run machine learning algorithms. These smartphone sensor data can be classified either on the device in the case of high end smartphones with the necessary processing power, or in the cloud/server in the case of low end smartphones. Convolutional Neural Networks (CNN) have achieved state-of-the-art performance on diverse image analysis tasks. Essentially, the smartphone has become a pervasive, sensor-rich device for human gait analysis, diagnosis, and treatment. Our intoxication detection from the gait method combines various innovative algorithms to mitigate unique challenges. In order to facilitate classification in units of a single step, we utilized the state-of-the-art CyclePro method to detect the start-end of each step and then segmented continuous data into individual steps. To reduce inter/intra-subject gait variability, we normalized data by subjects’ Body Mass Index (BMI). To facilitate classification using CNNs, we converted the time-series accelerometer and gyroscope data into the Gramian Angular Fields (GAF), an image-based representation that has proven effective for classifying human activity and movement time-series data [4]. Distinguishing GAF-encoded images of the gait of intoxicated vs. sober users is challenging as images belonging to both classes are quite similar, a so-called fine-grained image classification problem. We classified GAF-encoded smartphone sensor data using the Bi-Linear CNN (BiCNN) neural network, which has previously produced state-of-the-art results on fine-grained image classification of images. Gramian Angular Field (GAF) has been employed for tasks including sensor based human activity recognition [68], gait classification [73], detecting excessive load-carrying tasks [69], and health outcomes [70] [71] [72]. The BiCNN neural networks model has produced excellent, state-of-the-art results on several fine-grained image classification problems. However, our work is the first to innovatively utilize GAF encoded time-series images and a BiCNN classification model to detect intoxication by analyzing smartphone gait data, which are then classified using the BiCNN
In rigorous evaluations, we compared the classification performance of our BiCNN approach to state-of-art LSTM and CNN-GAF models using various metrics including classification accuracy, F1-score, and p-value. Our BiCNN model, when trained on data that was normalized by subjects’ BMIs yielded an accuracy of 83.5%, outperforming all baselines. While our work focusses on the classification task of detecting whether the subject’s BAC is above or below the legal drinking limit (0.08), other recent work has utilized models such as the MLP, CNN, Bi-LSTM to explore the related regression problem of predicting the subject’s actual BAC value from their gait. Our work makes the following contributions.
Innovatively framing intoxication detection from GAF-encoded smartphone gait signals as a fine-grained image classification problem due to subtle differences between intoxicated and sober classes.
Innovatively proposing intoxication classification using the state-of-the-art BiCNN model, which has previously produced excellent results on several fine-grained image classification problems.
Proposing several carefully thought out, specific pre-processing methods that improve intoxication detection performance including step-segmentation, normalization of subject’s data by their BMI and rescaling to fit time series data into a fixed size suitable for deep learning model.
Rigorous evaluation of our proposed BiCNN approach including comparisons with various state-of-the-art gait models, and evaluation of various gait normalization methods.
The rest of paper is as follows. In section II, we describe the existing work related to gait analysis. Section III discusses Gramian Angular Field (GAF) and Bi-Linear CNN. Section IV presents our proposed method including our data collection study and our BiCNN neural networks pipeline of steps for detecting intoxication. Section V describes experiments to evaluate our approach and section VI presents our results. Section VII discusses our main findings and section VIII concludes the paper.
II. RELATED WORK
A. Camera-based gait analysis
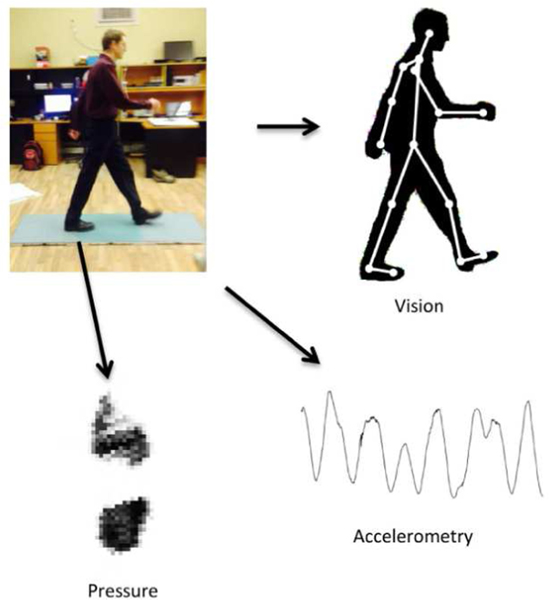
Researchers have utilized computer vision algorithms to analyze subjects’ gait in videos by detecting the movements of key points of the human skeleton. Camera-based gait analysis are used for user identification and recognition tasks [8] [39] [40] [67]. However, the camera-based gait analysis is vulnerable to illumination levels and raises privacy concerns.
B. Pressure-sensor-based gait analysis
Pressure-based gait analysis systems analyze pressure patterns exerted by subjects on sensors embedded into the floor, mat on the floor, or the soles of a shoe as they walk [41]. For instance, patients afflicted with diabetic nephropathy frequently have painful wounds on the soles of their feet, making patients walk abnormally to avoid exerting pressure on the painful areas. Pressure-based gait systems have recently been used to study the severity of Huntington’s disease [7] and to sense alcohol-induced gait impairments [9]. However, pressure-based gait systems require subjects to attach additional hardware to their bodies, and are not portable and cannot be used to monitor subjects’ free movements passively and unobtrusively.
C. IMU-based gait analysis to detect intoxication
An IMU is a sensor module that typically has three tri-axial sensors integrated: accelerometer, gyroscope, and magnetometer. In IMU-based gait analysis systems, researchers record data from a single IMU attached to the subject’s body. This data is then analyzed to detect gait abnormalities or monitor patients in natural settings continuously [10]. Smartphones now have IMUs with motion sensors integrated, which prior work has utilized to detect gait impairment caused by alcohol consumption. Some prior work focused on solving the classification problem of classifying whether users are over or under the legal limit for driving (Yes/No) or the current discrete range of a subject’s BAC.
Arnold et al. [11] explored intoxication classification using traditional machine learning techniques on hand-crafted features extracted from the smartphone’s accelerometer. They found that the Random Forest (RF) classifier outperformed other methods, including Naive Bayes and Support Vector Machines (SVM), achieving an accuracy of 70%. Zaki et al. [13] explored deep learning-based intoxication classification for distinguishing subjects over the legal drinking limit from those under the limit on an imbalanced dataset, and achieved an accuracy of 79%. In contrast, another group of related work has focused on the regression problem that tries to estimate the subject’s exact BAC value (a floating-point number) from their gait. Pedram [12] explored the intoxication regression problem using a Multi-Layer Perceptron (MLP) neural network, achieving a 0.0226 Root Mean Squared Error (RMSE). Li et al. [24] employed Bi-LSTM and CNN neural network for neural networks regression, achieving RMSEs of 0.0167 and 0.0168, respectively. This paper explores the intoxication classification problem using a novel image-based approach with Bi-Linear CNN neural networks model.
Eight representative prior research works are listed in table I in order to compare their work and ours. [61], [62] and [63] utilized coarse grained models for relatively straightforward tasks including posture classification and detection of freezing of gait. The rest of the tasks listed are more challenging including predicting age, gender and intoxication level detection. Such tasks are essentially fine grained with very similar samples that belong to different classes and the accuracy that can be achieved in such experiments is typically much lower than for coarse grained tasks. Additionally, in order to utilize state-of-the-art CNN-based neural networks methods for gait analyses, several of these prior work encoded sensor data as an image. Our work demonstrated the effectiveness of utilizing this approach for solving the intoxicated gait detection problem even when data is collected from a single phone attached to the subject’s left back pocket.
Our work is novel as it does not require subjects to attach any additional hardware to their bodies, is not affected by adverse illumination, and outperforms existing work for the task of classifying gait as sober or intoxicated. Also, our work is the first to frame the intoxication detection from GAF-encoded smartphone gait signals as a fine-grained image classification.
III. BACKGROUND
A. Encoding sensor time series signals into GAF images
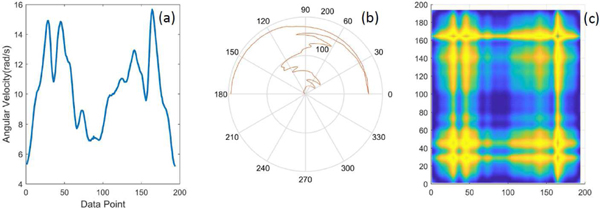
In gait analysis using IMUs, most early approaches extracted time-series features manually, which were then classified using traditional machine learning models such as Support Vector Machine (SVM), Naive Bayesian (NB), and Random Forest (RF) [44]. However, manual feature extraction is tedious and error-prone. Motivated by the state-of-the-art performance of deep learning architectures for image analysis and computer vision, recent human activity classification research has used them to classify human activity after converting time-series sensor data to images using representation such as Recurrence Plots (RP) (Figure 3 (b)) and Markov Transition Fields (MTF) [15] [16]. Such sensor data conversion to images is automated and facilitates gait classification and regression using state-of-the-art image-based CNN architectures.
Fig. 3.
(a) Accelerometer’s SVM signal gait cycle; (b) Recurrence plot image; (c) GAF Imaging
Gramian Angular Field (GAF): encodes time series data into an image. GAF represents temporal correlations between various time points in an image, enabling subsequent analysis using image-based deep learning models. Prior work [17] has demonstrated that GAF encoding methods achieved improved classification performance in image-based deep learning for the Human Activity Recognition (HAR) in the healthcare domain [18], similar to our intoxication detection task. This finding led us to explore the GAF encoding of smartphone sensor data as the input to our image-based Convolutional Neural Networks (CNN) intoxication classification models.
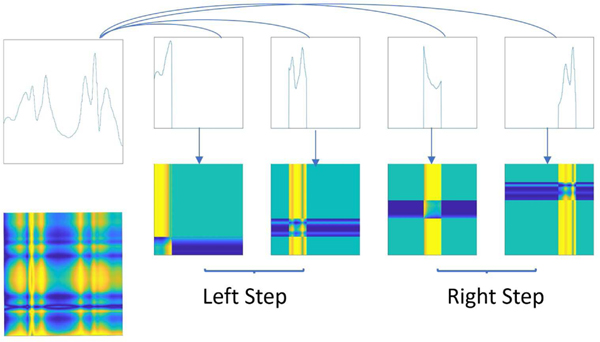
Figure 4 shows the GAF encoding of different parts of a time-series accelerometer signal. GAF images not only encode the left and right step information (left bottom corner; right top corner) but also encodes the underlying relationship between two steps (left top; right bottom). We have two hypotheses: 1) Compared with other imaging encoding techniques and time-series signals, GAF images have conspicuous unique four-pointed stars. The ”Star” in a GAF image contains more important information than other parts in the image. 2) The deep learning model is able to determine which part of the gait cycle plays a critical role in alcohol prediction. In conclusion, some parts of a subject’s gait may contain important information necessary for gait analysis. For intoxicated gait, we believe that four pointed stars may play a pivotal role in making accurate predictions during intoxicated gait analyses.
Fig. 4.
Illustration of time series encoding through GAF
B. Fine Grain Classification
Fine-grained classification tries to classify images that belong to target classes that appear quite similar (high interclass similarity), which is quite challenging. Classic fine-grained image classification problems include distinguishing sub-categories of a class of images, such as identifying the species of birds or types of cars, airplanes, and stages of cancer in an image [1] [45] [19] [20]. Our goal is to use a CNN to distinguish GAF images generated from sensor data of subjects over vs. under the legal driving limit (BAC of 0.08). However, we found that images in both classes looked quite similar, making it very challenging to distinguish under the legal limit vs. over the legal limit (Figure 14 and ??). We innovatively framed the intoxicated GAF image classification task as a fine-grained image classification task to leverage the Bi-Linear CNN, a state-of-the-art fine-grained classification neural networks architecture proposed in the computer vision community [1].
Fig. 14.
Converting Time-series Sober Step into a GAF Image (a) Original accelerometor signal of one sober segmented step (b) Representing a step cycle segment in Cartesian coordinates (c) Representing a step cycle in GAF
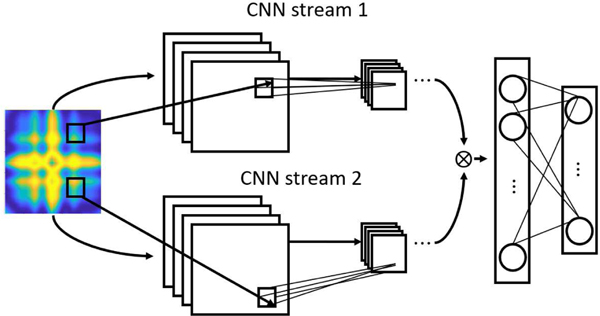
Bi-Linear CNN (BiCNN): To address the fine grained image classification problem, Tsung-Yu et al. [43] proposed the Bilinear CNN (BiCNN) architecture that utilizes two extractors to extract features from the same image in parallel (See Figure 5). These extracted feature representations are then multiplied together using the outer product at each pixel of the image and pooled to obtain a descriptor of the input image [14]. One branch of the BiCNN is a part detector and the other one is a local feature extractor. The outer product captures pairwise correlations between the feature channels and models part-feature interactions. The bilinear feature BF is calculated as:
| (1) |
Fig. 5.
Bilinear CNN Model Structure
Where is the location of current pixel, and are input images. and are the two feature outputs extracted from Stream A and Stream B respectively. Sum pooling is used to obtain the bilinear vector :
| (2) |
The BiCNN model can model local pairwise feature interactions, which is helpful for fine-grained categorization and allows end-to-end training with only image labels. Consequently, it has become a popular architecture for fine-grained image classification.
IV. OUR PROPOSED METHOD FOR INTOXICATION CLASSIFICATION
A. Data Collection
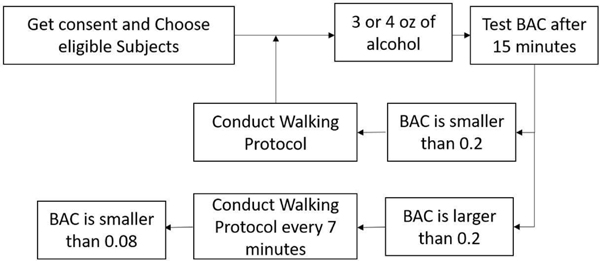
In order to create a labeled intoxicated gait dataset for supervised machine learning, we collected data from 121 subjects using a controlled drinking protocol (summarized in Fig 7). Subjects were administered a pre-determined quantity of alcohol, breathalyzed periodically, and walked a fixed distance on a corridor. A smartphone app was attached to their hip that passively gathered accelerometer and gyroscope data. The corresponding Blood Alcohol Content (BAC) for each walk was recorded using the breath alcohol test device. In order to abide by strict research ethics around alcohol consumption while providing high-quality data, our study was designed by an expert in conducting alcohol studies and is described below in more detail.
Fig. 7.
Summary of alcohol administration protocol
1). Screening:
Recruitment for this study included Facebook ads and local posters. Subjects were screened via initial phone contact. To participate, individuals had to be 21–65 years old, have used alcohol at least once in the past month, had at least six drinks per occasion for men (four for women) during a single drinking episode at any time in the past, be willing to drink beer, weighed 86–229 lbs, were not pregnant or nursing, had no difficulty walking, and had never been treated for alcohol or drug use. Participants were also not on medication or did not have a medical condition that contraindicated alcohol ingestion, did not experience alcohol flushing, did not use marijuana more than three times a week in the last month, and did not use drugs other than marijuana in the last week. Eligible individuals were scheduled for our gait data collection study and were instructed in advance - no water at least 2 hours prior to arrival, no food or other drinks at least 4 hours prior to arrival, and no alcohol or marijuana at least 24 hours prior to arrival. Of those who provided consent, 121 provided data usable for this analysis. All participants were provided cab rides to and from the study session; no study participant was allowed to drive themselves.
2). Procedures: Baseline:
Upon arrival at the study office, individuals completed an Informed Consent form and a brief eligibility check to confirm their age (driver’s license or other state-issued identification), weight, pregnancy status, recent drug use (urine toxicology), and Breath Alcohol Concentration (BAC). Urine toxicology was assessed using a self-contained test cup (Screeners® Dip Drug Test with the Integrated Screeners® Autosplit® KO12B™); pregnancy (for women) was assessed with an hCG dipstick test (Alere, San Diego, CA); BAC was assessed by a handheld Alcosensor IV Breathalyzer (Intoximeters Inc., St. Louis, MO). If found ineligible, participants were compensated for their time and were not allowed to participate in the study session.
Eligible participants completed a brief interview and the Walking Protocol and Field Sobriety Tests (FSTs). Their baseline BAC was recorded, and they were then administered their first drink. The participant waited 15 minutes after completing the first drink before the next BAC was taken. Approximately after 5 and 15 minutes of completing each drink, participants rinsed their mouths with water and spat to purge any remaining alcohol. After the second BAC was recorded, the participant completed a second walk and FSTs, and was given another drink. This process was repeated until the individual reached a BAC of 0.10. Upon completing the walk and FSTs at this peak BAC, participants were allowed to eat as they wanted. Subjects’ BACs began to decline and were measured with walks and FSTs after every 7 minutes during the descending BAC limb.
Alcohol Protocol:
All participants received Hurricane Beer, having 8.1% alcohol content. Each participant started with either 3 or 4 ounces of alcohol, depending on weight (men over 150 lbs and women over 160 lbs received 4 ounces initially). A BAC was taken 15 minutes later (per Alco-Sensor IV Operator Manual instructions, 9/1/2016). The amount of alcohol each participant received subsequently depended on each BAC reading. If an individual ascended at an even pace (e.g., .02 BAC with each drink), they continued to receive the same amount of alcohol. If an individual’s BAC rose more than approximately .02, or if the BAC came very close but did not fully reach 0.10, less alcohol was provided at the next alcohol administration. Increasing the amount of alcohol administered per drink was also possible but rarely occurred. Figure 6 shows sample trajectories of subjects’ BACs during the study.
Fig. 6.
A sample of BAC values recorded based on our alcohol administration protocol
Walking Protocol:
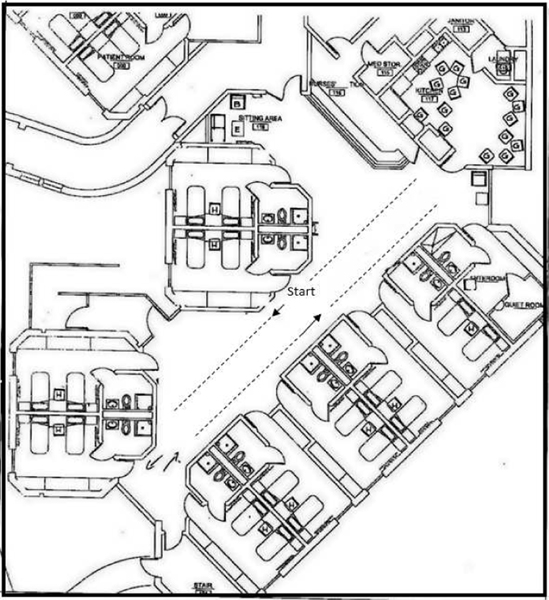
A 75-foot tape line was placed in a straight line on the floor in the Butler Hospital corridor shown in Figure 8. Participants started their walk in the middle of the line and walked at their normal pace to the end, turned, walked to the other end, turned, and returned to their starting point. Each walk lasted 45–60 seconds. A Google Pixel XL and an LG Watch Sport with the Alcogait application (preloaded) were used for data collection. Using a Velcro belt around the participant’s waist, the phone was holstered over the left-back pocket with the face accessible. The watch was placed on the left wrist. At the start of the study session, the participant’s ID, gender, age, height, and weight were entered into the phone app. Subjects then walked while the Alcogait app collected and recorded the smartphone’s accelerometer and gyroscope data for each walk.
Fig. 8.
Map of walking scenario at Butler Hospital
B. Neural Networks Intoxication Classification Pipeline
Our intoxication classification pipeline, shown in Figure 9, has three main stages; 1) Sensor signal pre-processing, 2) Conversion of time series sensor data to a GAF image, and 3) Classification of GAF image using a BiCNN model. These three stages are explained in detail in the following sections.
Fig. 9.
Overview diagram of our intoxication classification pipeline
1). Sensor signal pre-processing:
Pre-processing steps include step cycle detection, segmentation of the continuous gait signal into steps, elimination of physiologically implausible steps, and rescaling the subjects’ step length to a fixed value.
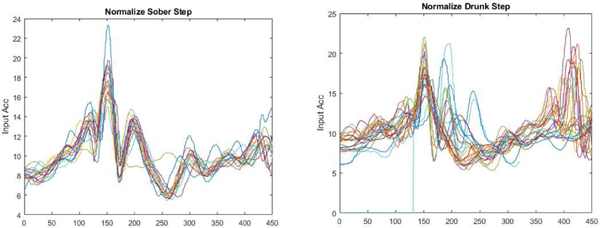
In pilot experiments, we discovered that various subjects’ strides and the cycles of sensor signals had varying lengths. However, neural network-based classification models require the signal inputs to be of the same length. Figure 10 shows plots comparing signals corresponding to normal gait vs. intoxicated gait. The variance in the signal lengths, start, and endpoints of each step in the intoxicated gait signal are easily observable. Such differences may be caused by gait abnormalities, including those caused by intoxication, such as shortened steps, stiff-legged weight-bearing, and stance phase with flexed but rigid knee [2]. Thus, one pre-processing step involves normalizing variable subject step lengths and gait cycles of accelerometer and gyroscope signals to a fixed length.
Fig. 10.
Examples of normalized and fixed-length (a) Sober gait; (b) Intoxicated gait;
IMU-based health care applications are susceptible to the sampling rates and the filter bandwidths utilized during preprocessing [46] [47]. In our experiments, we used the Google Pixel smartphone to collect data running a Bosch Sensortec BMI160 chip on the motherboard.
At lower sampling rates, consecutive sensor (accelerometer) readings were assigned the same timestamp repeatedly. We removed repeated sensor readings in which adjacent readings had zero difference, calculated as . The gyroscope, the higher frequency sensor, is then down-sampled to the same sampling rate as the accelerometer.
Gait step cycle detection and segmentation using the CyclePro algorithm:
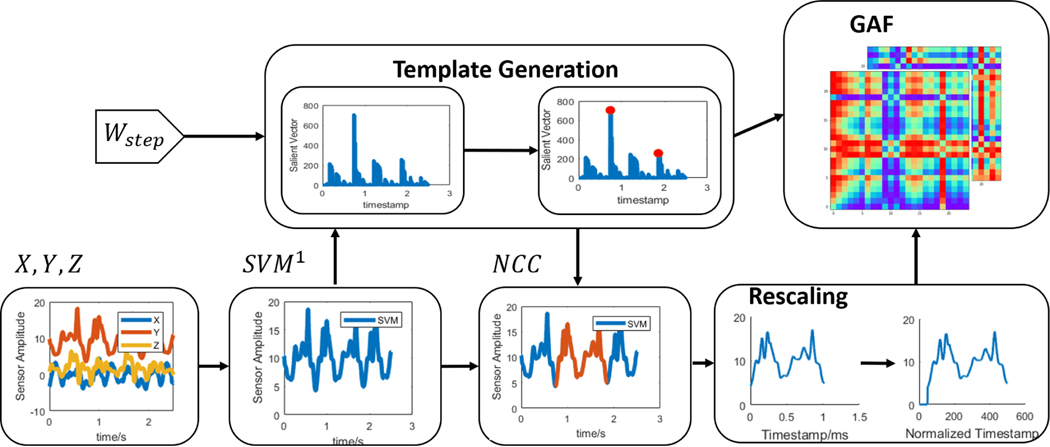
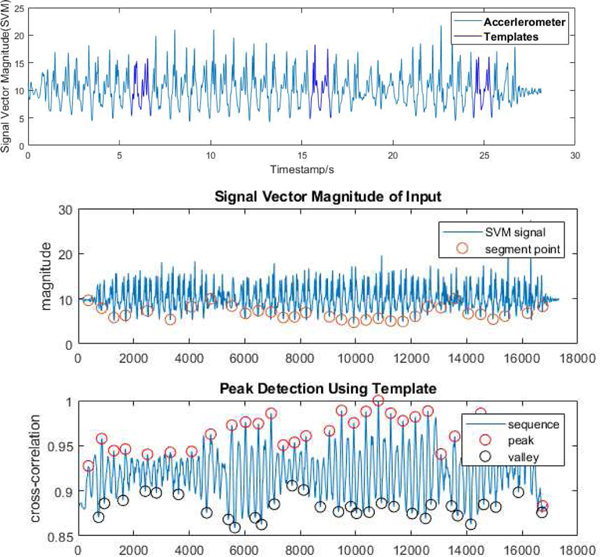
Step counting is a popular application that uses accelerometer data for health analysis and monitoring and as a pre-processing step for gait analysis. We extracted subjects’ steps from continuous gait sensor signal using the CyclePro algorithm proposed by Ma et al. [55] as it has outperformed other step cycle detection methods [52]. The CyclePro algorithm utilizes the normalized correlation of triaxial accelerometer data to detect the peaks and troughs of the Signal Vector Magnitude (SVM) of the accelerometer and gyroscope signal, as shown in equation 3. CyclePro was used to detect the step cycle to segment the continuous gait signal into individual steps that are the inputs to subsequent analysis. The CyclePro step cycle detection algorithm is robust to different signal sampling frequencies and sensor orientations (e.g., smartphones carried in different positions).
| (3) |
Rescaling subjects’ steps to a fixed length:
As subjects’ stride length varies, but deep learning requires fixed step length inputs, each individual step is then re-scaled to a fixed length on the time axis, which is also a hyperparameter used for training the Bilinear CNN deep learning model.
Filtering out physiologically implausible steps:
To filter out physiologically implausible data and scenarios, we compared each subject’s cadence (step rate) values to normal ranges for various age ranges, as shown in Table IV. In our experiments, the walking speed is calculated by dividing the distance covered by subjects based on the walking protocol distance (150 feet (45.72m)) by the time taken to cover this distance (See equation 4). If the subject’s speed falls within the range of normal speed values, the step cycle time is then calculated using equation 5. Otherwise, abnormal steps are removed based on their time, speed, and cadence.
TABLE V.
Bilinear CNN Model based on VGG-M
| Bilinear Arm 1 | |
|---|---|
| Layer name | parameter |
| convl | 7x7/2 |
| relul | |
| norml | |
| pooll | 3x3/2 |
| conv2 | 5x5/2 |
| relu2 | |
| norm2 | |
| pool2 | 3x3/2 |
| conv3 | 3x3/1 |
| relu3 | |
| conv4 | 3x3/1 |
| relu4 | |
| conv5 | 3x3/1 |
| relu5 | |
| pool5 | 3x3/2 |
Bilinear Arm 2 has the same structure
| (4) |
| (5) |
Gait data normalization:
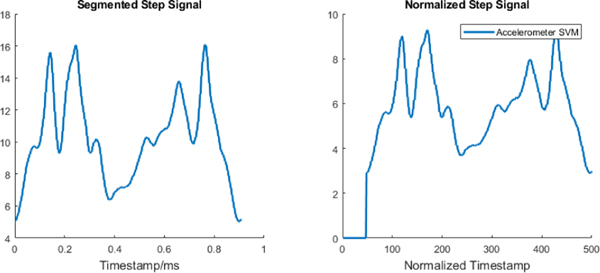
As motivated by prior work, our gait dataset should be segmented, standardized, and normalized [49] [51] [53]. We used a time-normalization method inspired by prior work by Tanawongsuwan, which compares and matches gait data from various subjects. They normalized time series data with respect to duration and footstep count (or walk cycles) [53], subtracted the mean of each signal followed by division by the estimated standard deviation. The pseudocode of our time-normalization method that we call rescaling in time is shown in figure 13 and pseudocode in 1. In Tanawongsuwan’s normalization, the authors used Dynamic Time Warping (DTW) to normalize the time series into the same length. DTW calculates the distance of two temporal sequences and standardizes them to the same length with a O(N2) time complexity. In our normalization method, we normalize the time series of one cycle before and after midswing. By keeping the first swing phase signal in figure 1, the final image could maintain the mid-swing data point at the same position and the speed information. This procedure is shown in the First Swing Phase of pseudocode 1. The after-swing data was normalized using linear interpolation and linear alignment. Compared with Tanawongsuwan’s algorithm, our method’s total time complexity is O(N).
Fig. 13.
Example: Step Segmentation and Normalization
For a sober subject, the normalized steps have similar speeds and smaller variance. As shown in figure 10, the normalized steps of an intoxicated subject has a short first swing and larger variance in the second swing.
Converting smartphone sensor time series signal into a Gramian Angular Field (GAF):
Previous research [15] demonstrates that GAF encoding of sensor time series data improves the classification performance of the Human Activity Recognition (HAR) task and various healthcare tasks [16] [17] [18]. During conversion to a GAF image, a time-series signal is firstly normalized to the [0, 1] range as follow:
Algorithm 1.
Normalization
| l: procedure INTERPOLATION |
| 2: signal ← sensor signal after mid-swing |
| 3: siglen ← length of signal |
| 4: len ← Target Length—First Swing Phase Length |
| 5: outputz : signal after first swing |
| 6: if siglen > len then |
| 7: r ← len/signal. |
| 8: return interp(sigual,r) |
| 9: else return signal(0:len) |
| 10: procedure FIRST SWING PHASE |
| 11: signal ← sensor signal of First swing |
| 12: siglen ← length of signal |
| 13: len ← Target First Swing Phase Length |
| 14: output: Signal of first swing |
| 15: if siglen < len then |
| 16: return zeros (len – siglen) + signal |
| 17: else return signal(siglen-len:siglen) |
| 18: procedure Main Normalization |
| 19: signal ← Signal of first swing + signal after first swing |
| 20: ratio ← (Attribute-Attributemin)/(Attribwtemax – Attributemin) |
| 21: output: Normalized Signal |
| 22: if length of signal = Target Length then |
| 23: return signal * ratio |
| 24: else return IllegalSampleError |
| (6) |
Each element of the N-length-series is then converted to polar coordinates by encoding the value as the angular cosine, and the timestamps of each element, divided by a regularizing constant factor, , the radius as shown in equation 7:
| (7) |
After the rescaled time-series has been transformed, the Gramian field is set by defining the angular perspective as the trigonometric sum of each point in the interval (Equation 8). The resulting Gramian Angular Field (GAF) is given by equation 9.
| (8) |
| (9) |
Figure 14 and Figure 15 illustrate two example results of GAF transformation of time series sensor data from the same subject at different sobriety levels.
Fig. 15.
Converting a Intoxicated Time-series Step into a GAF Image (a) Original accelerometer signal of one intoxicated segmented step (b) Representing a step cycle segment on Cartesian coordinates (c) Representing a step cycle in GAF
Gait data normalization to reduce inter-subject variability:
The alcohol consumption efficiency and subjects’ gait attributes such as walking speed and cadence length vary widely among individuals based on various factors. Numerous studies in clinical research have found gender differences in alcohol absorption. Since the female body has more lipid and less water than the male body, females experience a greater BAC increase than males after drinking the same amount of alcohol. Walk patterns and gait attributes such as range of cadence and cycle speed, as well as the effects of alcohol, vary between men and women. In addition, subject height will affect the cadence length and walking speed. Table IV shows the wide ranges of subjects’ ages, cadence, cycle times, and speeds in our dataset.
| (10) |
| (11) |
A popular mitigation strategy for inter-subject variability is to normalize each subject’s gait sensor data by demographic attributes such as age or physiological attributes [54]. Since Body Mass Index (BMI) (Equation 10) utilizes both weight and height and has been related to subjects’ BAC values, we normalize subjects’ gait sensor data by their BMI, weight, height, and age. Specific to alcohol, we also normalize each subject’s intoxicated gait data by their sober gait data (Equation 11). We compared improvements in our specific intoxication classification pipeline’s detection accuracy after various normalization approaches on our specific dataset.
C. Classification using a BiCNN Model
After segmentation, time-normalization, gait data normalization, and conversion to GAF images of dimension 512 ∗ 512, we used a BiCNN method to classify GAF images to determine whether a subject was under or above the limit of 0.08 BAC. We refer the reader to the original BCNN paper for additional details [1]. The authors compared the VGG-M, VGG-D, and customized VGG-M with SVM neural networks models. Besides, they applied boosted CNN techniques to accelerate the training process. The Boosted customized-VGG-M were found to outperform other models. Considering our smaller dataset, we did not utilize boosted CNN, deciding instead to utilize a Bi-linear VGG-M model.
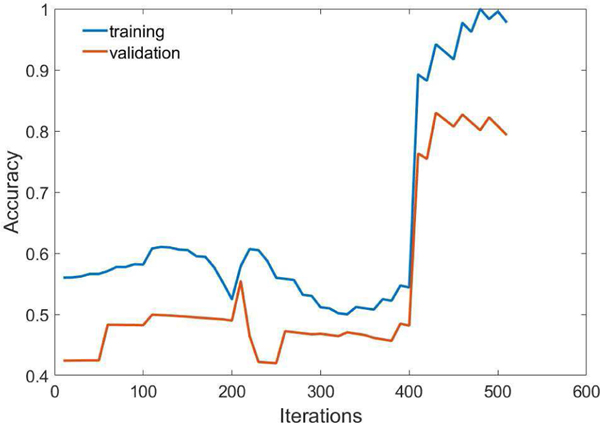
All GAF images derived from the smartphone accelerometer were imported into the Bi-VGG-M linear model as shown in the table V. We setup the batch size, momentum, and weight decay as 128, 0.9, and 0.0005 respectively. The learning rate of each layer were setup as 0.01 initially with a 0.001 decay rate. The Training and test process for 500 iterations are shown in figure 18. After fine-tuning the model and selecting optimal hyper parameters, the final model’s results were compared to baseline models. There are two leading methods of deploying deep learning model, which are built-in model in application and model in server to provide service. In previous research [24], we deployed a trained CNN regression model to a smartphone application to estimate BAC value. However, in this study, since the GAF encoding, sensor pre-processing tasks and BiCNN classification are more elaborate model, for most smartphone models, we envision that deployment of our gait analyses pipeline makes most sense in the cloud using a GPU. During development, our neural networks models were trained using the NVIDIA GeForce RTX 3080 GPUs and evaluated it on the personal computer. Our results are shown in tables IX and X.
TABLE VI.
SUBJECT DISTRIBUTION WITH RESPECT TO PERSONAL ATTRIBUTES
| Sample Category | Value |
|---|---|
| Gender total(Male/Female) | 96(41/55) |
| Gender Ratio(Male/Female) | 0.73:1 |
| Weight | 75.5 kg±13.1 kg |
| Height | 171.9 cm±15.4 cm |
| Age | 30.5± 10.12 years |
NOTE: All subjects are based on 96 subjects with usable gait data
Fig. 18.
Training Test Accuracy
TABLE IX.
BI-LINEAR CNN RESULTS BASED ON DIFFERENT NORMALIZATION METHODS WITH A SLIDING WINDOW
| Normalization | 5-Class | 2-Class | ||||
|---|---|---|---|---|---|---|
| Accuracy | P-value | Accuracy | P-value | F1 Score | F0.18 Score | |
|
| ||||||
| Weight | 50.58% | 0.027 | 81.00% | 0.027 | 0.83 | 0.84 |
| Height | 47.80% | 0.027 | 81.00% | 0.033 | 0.80 | 0.82 |
| Sober | 47.9% | 0.031 | 77.85% | 0.031 | 0.79 | 0.80 |
| Age | 48.90% | 0.031 | 77.13% | 0.036 | 0.80 | 0.81 |
| BMI | 55.20% | 0.028 | 80.25% | 0.029 | 0.82 | 0.85 |
|
| ||||||
| 5-Class | 2-Class | |||||
| Class | class 0 | 0 | class 0 | 0–0.08 | ||
| class 1 | 0–0.03 | class1 | 0.08–0.11 | |||
| class 2 | 0.03–0.06 | |||||
| class 3 | 0.06–0.08 | |||||
| class 4 | 0.08–0.11 | |||||
TABLE X.
Bi-linear CNN results based on step detection and different z-normalization methods
| Normalization | 5-Class | 2-Class | ||||
|---|---|---|---|---|---|---|
| Accuracy | P-value | Accuracy | P-value | F1 Score | F0.18 Score | |
|
| ||||||
| Weight | 58.60% | 0.023 | 82.33% | 0.026 | 0.84 | 0.87 |
| Height | 50.02% | 0.023 | 81.95% | 0.025 | 0.81 | 0.82 |
| Sober | 49.87% | 0.029 | 81.05% | 0.029 | 0.80 | 0.83 |
| Age | 53.25% | 0.027 | 79.50% | 0.570 | 0.80 | 0.81 |
| BMI | 59.55% | 0.021 | 83.50% | 0.027 | 0.88 | 0.90 |
|
| ||||||
| 5-Class | 2-Class | |||||
| Class | class 0 | 0 | class 0 | 0–0.08 | ||
| class 1 | 0–0.03 | class1 | 0.08–0.11 | |||
| class 2 | 0.03–0.06 | |||||
| class 3 | 0.06–0.08 | |||||
| class 4 | 0.08–0.11 | |||||
V. EVALUATION
A. Dataset Creation
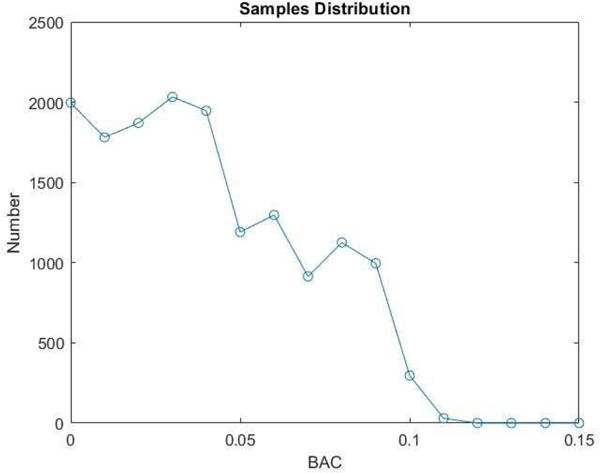
To facilitate deep learning classification experiments, we created a dataset from the data gathered in our controlled study. First, we checked that all data was valid and not corrupted. The demographics of subjects included in our dataset are summarized in table VI. Figure 17 shows the number of data instances collected from all subjects at various BAC levels; more data is collected at lower BAC levels.
TABLE VII.
Normalized Sample Distribution respects to personal attributes
| Sample Category | Value |
|---|---|
| Total numbers of samples by BAC(<0.08/≥0.08) | 3.06:1 |
| Total numbers of samples by gender Ratio(Male/Female) | 8092:12262 |
| Gender Ratio | 0.66:1 |
| Weight | 75.5 kg±13.1 kg |
| Height | 171.9 cm±15.4 cm |
| Age | 30.5±10.12 years |
NOTE: The dataset was generated from data of 96 subjects
Fig. 17.
Number of data instances collected at various BAC levels
Results after pre-processing of gait data:
As discussed in section IV, during signal pre-processing (Figure 11), NCC of signals were combined to generate a time-series template. Individual steps within the continuous gait signal were then detected, followed by segmentation, rescaling to a fixed length, and transformation into a corresponding GAF image.
Fig. 11.
Implementation of data preprocessing.(SVM denotes Signal Vector Magnitude; NCC denotes Normalized Cross Correlation;)
After segmenting and normalizing the alcohol dataset and splitting the dataset at the subject level, the distribution of data samples and dataset attributes are shown in Table VI. Subject level splitting refers to a splitting approach whereby all of each subject’s data appears either in the training or test set but not both.
B. Classification metrics
| (12) |
To rigorously evaluate our approach, we utilized accuracy, P-value, sensitivity, , and score. The score is a better measure of performance than accuracy for imbalanced datasets, where score is harmonic mean of the precision and recall given by equation 12.
C. Experiments
According to the previous study, We design two sets of experiments to solve the impaired gait classification task and three experiments to visualize and evaluate our model.
1). Comparing BiCNN vs Baseline models:
We compared our BiCNN classification model to the state-of-the-art deep learning models for the related Human Activity Recognition (HAR) task. Based on our previous research and state-of-the-art models [11] [48], we compared our approach to the three main algorithms used for the HAR task and detection of other impairments using IMU data: 1) A Convolutional Neural Networks (CNN) (3-layer), 2) Unidirectional Long Short Term Memory (LSTM) with Attention and 3) Support Vector Machine [49] [50]. Besides, to compare with other image encoding algorithm, we utilize recurrence plot as another baseline. Based on our findings in previous experiments, we pick a 50% sliding window to segment and GAF to image time-series with the same parameters used in the preprocessing steps in our previous work [51].
2). Comparing various normalization approaches :
As the performance of pre-processing, normalization, and machine learning algorithms tend to be dataset-specific and task-specific, we compared the effects of various normalization techniques motivated by the literature, including normalization by subject’s weight, height, and sober gait values, BMI, and age.
3). Evaluating the usefulness of step detection and z-normalization:
To evaluate the role of step detection and z-normalization on our proposed model’s performance, we assessed the performance of our BiCNN model with individual steps detected and z-normalization performed vs. a version without these operations.
4). Visualization features map:
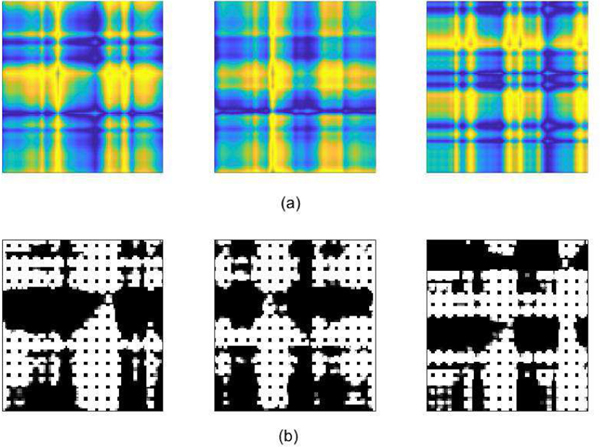
In order to gain some intuition about the model, we visualized the model’s learned filters, which contain the features extracted, from the previous layer. By examining the model’s feature map shown in figure 4, the parts of the GAF image that the model focused on to make its predictions were discovered.
5). Confidence in predicting intoxication for various BACs:
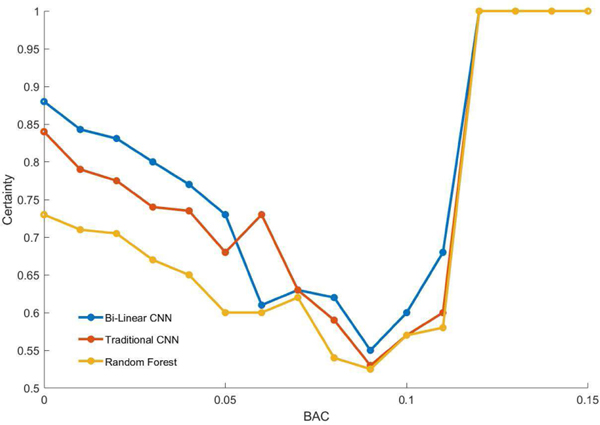
We computed the confidence of our models in predicting the intoxication of various subjects at various BACs for our BiCNN approach and baseline models. The confidence value is calculated using equation 13. It represents the probability of predicting a subject’s BAC correctly in each 0.01 BAC range.
| (13) |
6). Model running time:
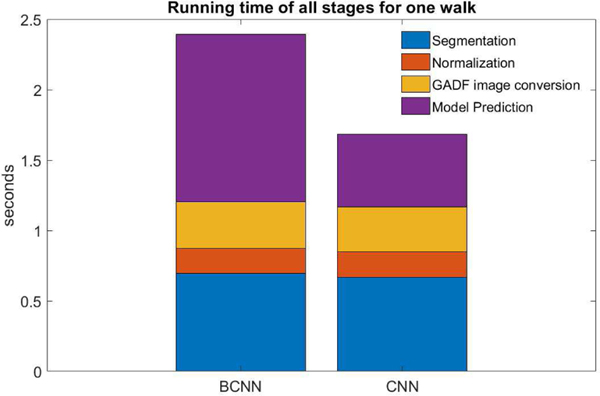
Our models were programmed using MATLAB and python; The compiler platforms we used were MATLAB and Pycharm. We evaluated our model’s running time for all stages on a Personal Computer with an Nvidia 2080 graphics card, 16GB of RAM and a 3.2GHz CPU.
VI. RESULTS
1). Comparing BiCNN vs Baseline models :
Our results in Tables VIII (baseline models) and X show that the BiCNN outperforms all baseline models. We considered both binary classification (Sober or Intoxicated) and 5-class classification of BAC levels.
TABLE VIII.
Baseline Results of 3-Layer CNN and LSTM with Attention using a sliding window [48]. Time series imaging methods are GAF and Recurrence Plot(RP) which are introduced in the Introduction. The Random Forest and Support Vector Machine baseline models used features from Arnold et al. [11]
| Algorithm | 5-Class | 2-Class | ||
|---|---|---|---|---|
| Accuracy | P-value | Accuracy | P-value | |
|
| ||||
| Random Forest | 34.8% | 71.1% | ||
|
| ||||
| Support Vector Machine | 30.8% | 68.3% | ||
|
| ||||
| CNN GAF | 43.25% | 0.027 | 77.00% | 0.026 |
|
| ||||
| CNN RP | 36.44% | 71.31% | ||
|
| ||||
| Attention LSTM | 42.50% | 0.026 | 74.25% | 0.029 |
2). Comparing various normalization approaches:
The performance of various gait data normalization methods is listed in Tables IX and X with the best performing highlighted using bold fonts. Normalization by the subject’s BMI produced the best results.
3). Evaluating the usefulness of step detection and z-normalization:
The results in tables Tables IX and X show that step detection and z-normalization boosted the accuracy of the BiCNN by approximately 3.5%.
4). Visualization features map:
The visualization of the activation layer’s features map in figure 19 shows that the model focused on the information in the first stride and demonstrate our conjectures previously described in part III-A: 1) The ”Star” is more pivotal than other parts of the image. 2) The Mid-Wing and the first step are important in gait analysis.
Fig. 19.
(a)GAF images ecoded from three walking gait(b)Visualization of Activation heatmaps of three GAF images.(Notes: the high intensity visuals(black part) reflects model’s interest)
5). Confidence in predicting intoxication for various BACs:
As shown in Figure 20, all three models had their lowest confidence in the region of the class boundary (BAC of 0.08). Confidence generally increased for BAC values further away from this 0.08 threshold.
Fig. 20.
Confidence of intoxication classification of subjects with various models
6). Model running time:
As shown in figure 21, it takes about 2.4 seconds for a single 30-second walk to be analyzed and for results to be received back. The model prediction time of about 1.1 seconds was the most significant component, followed by the time required to segment the continuous gait signal into individual steps (0.7 secs), then conversion to a GAF image (0.5 secs). Normalization of our gait data was the fastest step (0.15 seconds). These encouraging results indicate that our model could be useful in a near-real-time intoxicated gait system.
Fig. 21.
Running time of the main stages of our BiCNN model
VII. DISCUSSION
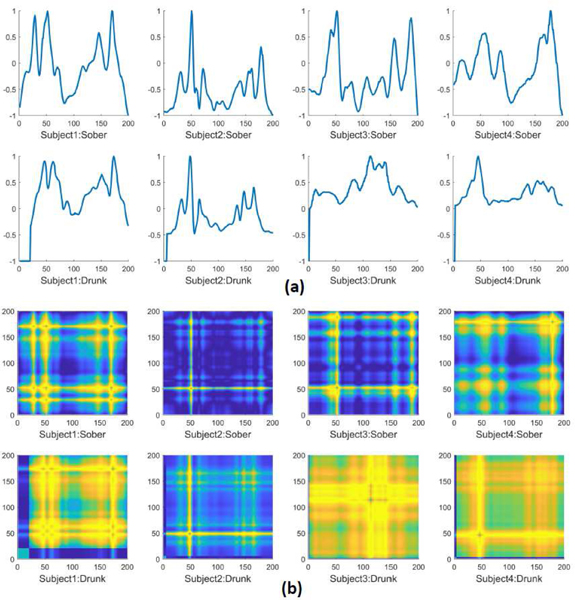
Our approach of converting sensor time series into a GAF image that was then classified using the BiCNN, a leading architecture for fine-grained image classification, produced convincing results. The pre-processing steps that played a vital role in improving the performance included detection, data rescaling, and normalization by the subject’s BMI. The baseline models and BiCNN assessed in this study were previously state-of-the-art in intoxicated gait classification research. Random Forest previously achieved an accuracy of 73% [11] using hand-crafted features. LSTM produced state-of-the-art results for BAC regression from gait data [48]. In other work, we utilized a sliding window and GAF on marijuana gait analysis [51], and found that using 50% overlapping sliding windows yielded the best results. In this paper, we extended our previous work by employing the detection of step cycles and segmentation using CyclePro. Tables IX and X demonstrate that compared with sliding-window segmentation, step segmentation could refine the dataset and improve classification accuracy. Figure 16 demonstrates a considerable similarity between the same subject’s sober and intoxicated gait. Still, we could distinguish the blurry intoxicated image from the same subject’s normal walking. The alcohol administration protocol we utilized yielded an imbalanced dataset with fewer samples in the upper BAC ranges, which ultimately impacted our model’s performance in those ranges. Less firm findings that will be explored further in future work include: a) Time-series gait signal data need to be segmented in a way that is tailored to the classification/regression task rather than divided into lengths directly; b) Even though table IV shows that subjects’ ages affected their gait, we found that with regards to intoxication, subjects’ weight and height both affected gait signal magnitude more than their age; c) Conversion of time-series to images and subsequent classification using CNNs increased the performance of deep learning. Additional analysis is necessary for future research before making these latter findings firmer. For a), Our CyclePro with a sliding window approach needs to be compared to other segmentation methods. For b) other normalization methods and subject attributes need to be explored. For c) The GAF imaging approach needs to be compared to other time-series imaging methods such as Markov Transition Fields (MTF) and Recurrence Plots (RP). Our work has several limitations. Due to the lack of availability of intoxicated gait datasets, the evaluation of our algorithm was based on one gait dataset collected by this study. Our dataset had only 121 subjects and was not large enough to contain adequate samples of all subject ages, weights, and height ranges. Other conclusions may be reached for specific demographics when larger sample sizes are utilized. Finally, our dataset was also imbalanced with relatively fewer intoxicated than sober samples.
Fig. 16.
(a) Normalized accelerometer signal with a fixed length of 200 data points; (b) Representing the accelerometer magnitude using a GAF image; In both (a) and ( b), the first row shows the sober step; the corresponding images in the second rows are intoxicated steps of the same subject; Parameters used figures (a) and (b) are selected to generate illustrative representations that explain GAF concepts.
VIII. CONCLUSION
In this paper, we explored gait data from smartphone motion sensors to detect persons with a blood alcohol concentration over the legal driving limit using a BiCNN model with a GAF image representation of the signal. Our pipeline integrates innovative methods for mitigating the specific issues with the intoxicated gait signal. Specifically, our approach involved a comprehensive set of custom pre-processing steps, including step detection, signal step-wise segmentation, normalization, and rescaling, with conversion to a GAF image before final classification using a BiCNN model. Among all the variations of BiCNN, the best-performing model used gait data normalized by the subject’s BMI and achieved an accuracy of 83.5%. Our method could facilitate pervasive assessment and early detection of smartphone users who could be alerted when they reach an elevated BAC to prevent unnecessary DUI incidents. Continuous tracking of drinking behavior using our approach could also monitor subjects currently undergoing treatment for problematic alcohol use, providing counselors with more detailed records to inform treatment.
Future Work:
In the future, we will expand the mix of applications of alcohol-induced impairment by detecting and exploring the pre-clustering of various walking styles to improve intoxication classification/regression performance. In addition, we will also explore other emerging gait step segmentation, time-series-imaging, and fine-grained classification methods. Finally, we will explore methods to generate synthetic gait data to augment data collection in our study using various methods such as Generative Adversarial Networks (GANs) to mitigate imbalance in our dataset to improve the accuracy further.
Fig. 2.
Three modalities of gait analysis: Vision, pressure and accelerometers [22]
Fig. 12.
(a) Accelerometer signal magnitude of one walking scenario and three templates generated through normalized cross correlation; (b) Utilizing the rank-1 templates to find all possible gait salient points; (c) The salient points (peak/valley) index recorded during a scenario
TABLE I.
Comparison of Related Work and Ours
| Related Work | Task description | Accuracy | Smartphone | Time-Imaging | Fine-Grain | LOSO* |
|---|---|---|---|---|---|---|
| [61] | Using 19 sensors on body to classify locomotion and posture | 95.8% | ||||
| [62] | Subject Identification | 91% | ✓ | ✓ | ||
| [63] | Uisng smartphone to detect freeze of gait | 93.8% | ✓ | ✓ | ||
| [64] | Using three IMU sensors to detect pathological condition | 90.5% | ✓ | ✓ | ||
| [65] | Using smartshoe to classify alcohol impaired and sober walk | 86.2% | ✓ | |||
| [66] | Using shoeprint to predict age | 40.23% | ✓ | |||
| [66] | Using shoeprint to predict gender | 86.07% | ✓ | |||
| Ours | Using smartphone to predict alcohol impaired level | 83.5% | ✓ | ✓ | ✓ | ✓ |
TABLE III.
Inertial sensors’ attribute of Google Pixel utilized in experiments
| IMU Sensors Datasheet | ||
|---|---|---|
| Parameter | Accelerometer | Gyroscope |
| Output Rate | 12.5 to 1600 Hz | 25 Hz to 3200 Hz |
| Sampling Rate | 30 kHz | |
| Final Frequency (3 dB Cutoff Bandwidth) | About 220 Hz | About 440 Hz |
TABLE IV.
Normal range for different subjects [2]
| Age | Cadence | Cycle Time | Speed |
|---|---|---|---|
| 18–49 | 98–138 | 0.87–1.22 | 0.94–1.66 |
| 50–64 | 97–137 | 0.88–1.24 | 0.91–1.63 |
ACKNOWLEDGMENT
This work was supported in part by NIH/NIAAA grant number 1R21AA025193-01.
Biographies

Ruojun Li received the B.S. degree from the Department of Optical Information, Huazhong University of Science and Technology, Wuhan, China, in 2016, and the M.S. degree from the Department of Electrical and Computer Engineering, Worcester Polytechnic Institute(WPI), Worcester, MA, USA, in 2019. She is currently working toward the Ph.D. degree in the Department of Electrical and Computer Engineering, WPI. Her research interests include biomedical signal and image processing, gait analysis using deep learning.

Emmanuel Agu is a Professor in the Computer Science Department, Worcester Polytechnic Institute, Worcester, MA, USA. He has been involved in research in mobile and ubiquitous computing for over 16 years. He is currently working on mobile health projects to assist patients with diabetes, obesity, depression, and alcohol abuse.

Atifa Sarwar holds a bachelor’s degree in computer science with Magna Cum Laude (distinction) from the National University of Computer and Emerging Sciences and master’s in information technology from the National University of Science and Technology, Pakistan. She is currently a Fulbright scholar and pursuing her Ph.D. in Department of Computer Science at Worcester Polytechnic Institute. Her research interests includes passive monitoring of health parameters for disease identification using deep learning.

Kristin Grimone is a graduate of Ohio State University, and has worked as both a research assistant and a project coordinator in the Behavioral Medicine and Addictions Research department at Butler Hospital for the past 7 years. She has contributed to several NIH studies and subsequent manuscripts focused on substance use, physical activity and fMRI correlates.

Debra Herman Ph.D is a Clinical Associate Professor in the Department of Psychiatry and Human Behavior and a Research Psychologist in the Behavioral Medicine and Addictions Research group at Butler Hospital. Dr. Herman has collaborated on over twenty NIH-funded clinical trials involving substance-abusing populations over the past two decades.

Dr. Ana M Abrantes is the Co-Director of Behavioral Medicine and Addictions Research at Butler Hospital and a Professor in the Department of Psychiatry and Human Behavior at the Alpert Medical School of Brown University. Dr. Abrantes has been continuously funded through the National Institutes of Health over the last decade, primarily conducting research in the area of addictive behaviors including alcohol use disorder, cigarette smoking, and opioid use disorder. Dr. Abrantes has placed an emphasis on the development of technology-supported interventions to improve treatment outcomes in these patient populations.

Michael Stein Michael D. Stein is Chair of Health Law, Policy & Management at Boston University and an internist who has been studying substance use and risk-taking for decades.
Contributor Information
Ruojun Li, Department of Optical Information, Huazhong University of Science and Technology, Wuhan, China; Department of Electrical and Computer Engineering, Worcester Polytechnic Institute(WPI), Worcester, MA, USA.
Emmanuel Agu, Computer Science Department, Worcester Polytechnic Institute, Worcester, MA, USA.
Atifa Sarwar, computer science with Magna Cum Laude.
Kristin Grimone, Ohio State University.
Debra Herman, Department of Psychiatry and Human Behavior and a Research Psychologist in the Behavioral Medicine and Addictions Research group at Butler Hospital..
Ana M Abrantes, Behavioral Medicine and Addictions Research at Butler Hospital and a Professor in the Department of Psychiatry and Human Behavior at the Alpert Medical School of Brown University..
Michael D. Stein, Chair of Health Law, Policy & Management at Boston University
REFERENCES
- [1].Lin Tsung-Yu, Aruni RoyChowdhury, Subhransu Maji,“Bilinear CNN Models for Fine-grained Visual Recognition, ” Proceedings of the IEEE International Conference on Computer Vision (ICCV), 2015, pp. 1449–1457 [Google Scholar]
- [2].Whittle M. (2007). “An Introduction to Gait Analysis(4th ed.),” Butterworth-Heinemann. [Google Scholar]
- [3].Alharthi AS, Yunas SU and Ozanyan KB, ”Deep Learning for Monitoring of Human Gait: A Review,” IEEE Sensors Journal, vol. 19, no. 21, pp. 9575–9591, 1 Nov.1, 2019. [Google Scholar]
- [4].Wang Z, Oates T. (2015). Imaging time-series to improve classification and imputation. arXiv preprint arXiv:1506.00327. [Google Scholar]
- [5].Marlene Oscar-Berman Mary M. Valmas, Sawyer Kayle S., Susan Mosher Ruiz Riya B. Luhar, Gravitz Zoe R.,“Chapter 12 - Profiles of impaired, spared, and recovered neuropsychologic processes in alcoholism, Handbook of Clinical Neurology,” Elsevier, Volume 125, 2014, pp. 183–210. [DOI] [PMC free article] [PubMed] [Google Scholar]
- [6].Demura S, Uchiyama M. “Influence of moderate alcohol ingestion on gait.” Sport Sci Health 4, 21–26 (2008). [Google Scholar]
- [7].Zhang S, Poon SK, Vuong K, Sneddon A, Loy CT. “A Deep Learning Based Approach for Gait Analysis in Huntington Disease.” Studies in Health Technology and Informatics. 2019. Aug;264:477–481 [DOI] [PubMed] [Google Scholar]
- [8].Li C, Min X, Sun S, Lin W, Tang Z.“ DeepGait: A Learning Deep Convolutional Representation for View-Invariant Gait Recognition Using Joint Bayesian.” Applied Sciences. 2017; 7(3):210. [Google Scholar]
- [9].Lee SI, Nam HS, Garst JH, Huang A, Campion A, Arnell M, Ghalehsariand N, Park S, Chang H-, Lu DC, Sarrafzadeh M,&Park E(2017).“Unobtrusive and Continuous Monitoring of Alcohol-impaired Gait Using Smart Shoes.” Methods of Information in Medicine, 56(01), 74–82. [DOI] [PubMed] [Google Scholar]
- [10].Camps J, Samà A, Martín M, Rodríguez-Martín D, Pérez-López C, Moreno Arostegui JM, Cabestany J, Català A, Alcaine S, Mestre B, Prats A, Crespo-Maraver MC, Counihan TJ, Browne P, Quinlan LR, Laighin GÓ, Sweeney D, Lewy H, Vainstein G, … Rodríguez-Molinero A. (2018).“ Deep learning for freezing of gait detection in Parkinson’s disease patients in their homes using a waist-worn inertial measurement unit.” Knowledge-Based Systems, 139, 119–131. [Google Scholar]
- [11].Arnold Z, Larose D. and Agu E, “Smartphone Inference of Alcohol Consumption Levels from Gait.” International Conference on Healthcare Informatics, Dallas, TX, 2015, pp. 417–426. [Google Scholar]
- [12].Gharani P, Suffoletto B, Chung T, & Karimi H. (2017). An Artificial Neural Network for Movement Pattern Analysis to Estimate Blood Alcohol Content Level. Sensors, 17(12), 2897. [DOI] [PMC free article] [PubMed] [Google Scholar]
- [13].Zaki THM, Sahrim M, Jamaludin J, Balakrishnan SR, Asbulah LH and Hussin FS, “The Study of Drunken Abnormal Human Gait Recognition using Accelerometer and Gyroscope Sensors in Mobile Application,” 2020 16 IEEE International Colloquium on Signal Processing & Its Applications (CSPA), Langkawi, Malaysia, 2020, pp. 151–156. [Google Scholar]
- [14].Lin T-Y, RoyChowdhury A, & Maji S. (2018). “Bilinear Convolutional Neural Networks for Fine-Grained Visual Recognition”. IEEE Transactions on Pattern Analysis and Machine Intelligence, 40(6), 1309–1322. 10.1109/tpami.2017.2723400 [DOI] [PubMed] [Google Scholar]
- [15].Li X, Kang Y, & Li F. (2020). “Forecasting with time series imaging. Expert Systems with Applications”, 160, 113680. 10.1016/j.eswa.2020.113680 [DOI] [Google Scholar]
- [16].Wang Z. and Oates T,“Imaging Time-Series to Improve Classification and Imputation”, International Joint Conference on Artificial Intelligence, 2015. [Google Scholar]
- [17].Wang Zhiguang Oates, “Tim Encoding Time Series as Images for Visual Inspection and Classification Using Tiled Convolutional Neural Networks”,2015. [Google Scholar]
- [18].Xu H. et al. , ”Human Activity Recognition Based on Gramian Angular Field and Deep Convolutional Neural Network,” in IEEE Access, vol. 8, pp. 199393–199405, 2020, doi: 10.1109/ACCESS.2020.3032699. bib [DOI] [Google Scholar]
- [19].Piosenka G. (2020, December 20). 250 Bird Species. Kaggle. https://www.kaggle.com/gpiosenka/100-bird-species [Google Scholar]
- [20].Zou Q, Wang Y, Wang Q, Zhao Y. and Li Q, ”Deep Learning-Based Gait Recognition Using Smartphones in the Wild,” in IEEE Transactions on Information Forensics and Security, vol. 15, pp. 3197–3212, 2020, doi: 10.1109/TIFS.2020.2985628. [DOI] [Google Scholar]
- [21].Whittle M. (2007). An Introduction to Gait Analysis (4th ed.). Butterworth-Heinemann. [Google Scholar]
- [22].Tanawongsuwan R. and Bobick A, 2001, December. Gait recognition from time-normalized joint-angle trajectories in the walking plane. In Proceedings of the 2001 IEEE Computer Society Conference on Computer Vision and Pattern Recognition. CVPR; 2001 (Vol. 2, pp. II-II). IEEE. [Google Scholar]
- [23].Mobile Fact Sheet, Pew Research Center, https://www.pewresearch.org/internet/fact-sheet/mobile/, April 7, 2021 [Google Scholar]
- [24].Li R, Balakrishnan GP, Nie J, Li Y, Agu E, Grimone K, Herman D, Abrantes AM and Stein MD, 2021. Estimation of Blood Alcohol Concentration From Smartphone Gait Data Using Neural Networks. IEEE Access, 9, pp.61237–61255. [DOI] [PMC free article] [PubMed] [Google Scholar]
- [25].Traffic Safety Facts 2013 Data. (n.d.). NHTSA. Retrieved April 26, 2021, from https://crashstats.nhtsa.dot.gov/Api/Public/ViewPublication/812102 [Google Scholar]
- [26].People Killed, by Highest Driver Blood Alcohol Concentration (BAC) in the Crash, 1982–2018. (n.d.). NHTSA. Retrieved April 26, 2021, from https://cdan.nhtsa.gov/SASStoredProcess/guest [Google Scholar]
- [27].Calhoun VD et al. “Using virtual reality to study alcohol intoxication effects on the neural correlates of simulated driving.” Applied psychophysiology and biofeedback vol. 30,3 (2005): 285–306. doi: 10.1007/s10484-005-6384-0 [DOI] [PubMed] [Google Scholar]
- [28].Rubenzer Steve. “Judging intoxication.” Behavioral sciences & the law vol. 29,1 (2011): 116–37. doi: 10.1002/bsl.935 [DOI] [PubMed] [Google Scholar]
- [29].Prakash Chandra, et al. “Recent Developments in Human Gait Research: Parameters, Approaches, Applications, Machine Learning Techniques, Datasets and Challenges.” Artificial Intelligence Review, vol. 49, no. 1, 2016, pp. 1–40., doi: 10.1007/s10462-016-9514-6. [DOI] [Google Scholar]
- [30].Alharthi AS, Yunas SU and Ozanyan KB, ”Deep Learning for Monitoring of Human Gait: A Review,” in IEEE Sensors Journal, vol. 19, no. 21, pp. 9575–9591, 1 Nov.1, 2019, doi: 10.1109/JSEN.2019.2928777. [DOI] [Google Scholar]
- [31].Garrison Fielding. ”An Introduction to the History of Medicine,: With Medical Chronology, Suggestions for Study and Bibliographic Data.” Enlarged: 4th, W.B. Saunders Company, 1966. [Google Scholar]
- [32].Hardt DE (1978). Determining Muscle Forces in the Leg During Normal Human Walking—An Application and Evaluation of Optimization Methods. Journal of Biomechanical Engineering, 100(2), 72–78. 10.1115/1.3426195 [DOI] [Google Scholar]
- [33].Steindler Arthur. “A HISTORICAL REVIEW OF THE STUDIES AND INVESTIGATIONS MADE IN RELATION TO HUMAN GAIT.” The Journal of Bone & Joint Surgery, vol. 35, no. 3, 1953, pp. 540–728. Crossref, doi: 10.2106/00004623-195335030-00002. [DOI] [PubMed] [Google Scholar]
- [34].Sutherland David H. “The Evolution of Clinical Gait Analysis Part l: Kinesiological EMG.” Gait & Posture, vol. 14, no. 1, 2001, pp. 61–70. Crossref, doi: 10.1016/s0966-6362(01)00100-x. [DOI] [PubMed] [Google Scholar]
- [35].Sutherland DH “The Evolution of Clinical Gait Analysis.” Gait & Posture, vol. 16, no. 2, 2002, pp. 159–79. Crossref, doi: 10.1016/s09666-362(02)00004-8. [DOI] [PubMed] [Google Scholar]
- [36].Sutherland DH “The Evolution of Clinical Gait Analysis Part III – Kinetics and Energy Assessment.” Gait Posture, vol. 21, no. 4, 2005, pp. 447–61. Crossref, doi: 10.1016/j.gaitpost.2004.07.008. [DOI] [PubMed] [Google Scholar]
- [37].Abdulhay Enas, et al. “Gait and Tremor Investigation Using Machine Learning Techniques for the Diagnosis of Parkinson Disease.” Future Generation Computer Systems, vol. 83, 2018, pp. 366–73. Crossref, doi: 10.1016/j.future.2018.02.009. [DOI] [Google Scholar]
- [38].Mannini Andrea, et al. “A Machine Learning Framework for Gait Classification Using Inertial Sensors: Application to Elderly, Post-Stroke and Huntington’s Disease Patients.” Sensors, vol. 16, no. 1, 2016, p. 134. Crossref, doi: 10.3390/s16010134. [DOI] [PMC free article] [PubMed] [Google Scholar]
- [39].Lee Howard, et al. “Video Analysis of Human Gait and Posture to Determine Neurological Disorders.” EURASIP Journal on Image and Video Processing, vol. 2008, 2008, pp. 1–12. Crossref, doi: 10.1155/2008/380867. [DOI] [Google Scholar]
- [40].Mehmood Asif, et al. “Prosperous Human Gait Recognition: An End-to-End System Based on Pre-Trained CNN Features Selection.” Multimedia Tools and Applications, 2020. Crossref, doi: 10.1007/s11042-020-089280. [DOI] [Google Scholar]
- [41].Deschamps Kevin, et al. “Efficacy Measures Associated to a Plantar Pressure Based Classification System in Diabetic Foot Medicine.” Gait & Posture, vol. 49, 2016, pp. 168–75. Crossref, doi: 10.1016/j.gaitpost.2016.07.009. [DOI] [PubMed] [Google Scholar]
- [42].Rogeberg Ole, and Elvik Rune. “The effects of cannabis intoxication on motor vehicle collision revisited and revised.” Addiction (Abingdon, England) vol. 111,8 (2016): 1348–59. doi: 10.1111/add.13347 [DOI] [PubMed] [Google Scholar]
- [43].Lin TY, RoyChowdhury A, Maji S. (2015). Bilinear cnn models for fine-grained visual recognition. In Proceedings of the IEEE international conference on computer vision (pp. 1449–1457). [Google Scholar]
- [44].Shetty S. and Rao YS, ”SVM based machine learning approach to identify Parkinson’s disease using gait analysis,” 2016 International Conference on Inventive Computation Technologies (ICICT), 2016, pp. 1–5, doi: 10.1109/INVENTIVE.2016.7824836. [DOI] [Google Scholar]
- [45].Yang Y, Wang X, Zhao Q, Sui T. (2019). Two-Level Attentions and Grouping Attention Convolutional Network for Fine-Grained Image Classification. Applied Sciences, 9(9), 1939. 10.3390/app9091939 [DOI] [Google Scholar]
- [46].Ahmad N, Ghazilla RAR, Khairi NM, Kasi V. (2013). Reviews on Various Inertial Measurement Unit (IMU) Sensor Applications. International Journal of Signal Processing Systems, 256–262. 10.12720/ijsps.1.2.256-262 [DOI] [Google Scholar]
- [47].Dabove P, Ghinamo G, Lingua AM (2015). Inertial sensors for smartphones navigation. SpringerPlus, 4(1). 10.1186/s40064-015-1572-8 [DOI] [PMC free article] [PubMed] [Google Scholar]
- [48].Li R, Balakrishnan GP, Nie J, Li Y, Agu E, Grimone K, Herman D, Abrantes AM, Stein MD (2021). Estimation of Blood Alcohol Concentration From Smartphone Gait Data Using Neural Networks. IEEE Access, 9, 61237–61255. 10.1109/access.2021.3054515 [DOI] [PMC free article] [PubMed] [Google Scholar]
- [49].Guan Y, Plotz T. (2017). Ensembles of Deep LSTM Learners for¨ Activity Recognition using Wearables. Proceedings of the ACM on Interactive, Mobile, Wearable and Ubiquitous Technologies, 1(2), 1–28. 10.1145/3090076 [DOI] [Google Scholar]
- [50].Xia K, Huang J, Wang H. (2020). LSTM-CNN Architecture for Human Activity Recognition. IEEE Access, 8, 56855–56866. 10.1109/access.2020.2982225 [DOI] [Google Scholar]
- [51].Li R. et al. , ”WeedGait: Unobtrusive Smartphone Sensing of Marijuana-Induced Gait impairment By Fusing Gait Cycle Segmentation and Neural Networks,” 2019 IEEE Healthcare Innovations and Point of Care Technologies, (HI-POCT), 2019, pp. 91–94, doi: 10.1109/HI-POCT45284.2019.8962787. [DOI] [Google Scholar]
- [52].Ma Y, Esna Ashari Z, Pedram M, Amini N, Tarquinio D, Nouri-Mahdavi K, Pourhomayoun M, Catena RD, Ghasemzadeh H. (2019). CyclePro: A Robust Framework for Domain-Agnostic Gait Cycle Detection. IEEE Sensors Journal, 19(10), 3751–3762. 10.1109/jsen.2019.2893225 [DOI] [Google Scholar]
- [53].Tanawongsuwan R, Bobick A. (2001). Gait recognition from time-normalized joint-angle trajectories in the walking plane. Proceedings of the 2001 IEEE Computer Society Conference on Computer Vision and Pattern Recognition. CVPR; 2001. Published. 10.1109/cvpr.2001.991036 [DOI] [Google Scholar]
- [54].Mundt M, Koeppe A, David S, Witter T, Bamer F, Pot-thast W, Markert B. (2020). Estimation of Gait Mechanics Based on Simulated and Measured IMU Data Using an Artificial Neural Network. Frontiers in Bioengineering and Biotechnology, 8. 10.3389/fbioe.2020.00041 [DOI] [PMC free article] [PubMed] [Google Scholar]
- [55].Ma Y, Ashari Z, Pedram M, Amini N, Tarquinio D, Nouri-Mahdavi K, Pourhomayoun M, Catena R, Ghasemzadeh H. (2019). CyclePro: A robust framework for domain-agnostic gait cycle detection. IEEE Sensors Journal, 19(10), 3751–3762. [Google Scholar]
- [56].Alcoholl and Public Health, Centers for Disease Control and Prevention, https://www.cdc.gov/alcohol/features/excessive-alcohol-deaths.html, May 23, 2022. [Google Scholar]
- [57].Christoforou Z, Karlaftis M, Yannis G. (2013). Reaction times of young alcohol-impaired drivers. Accident Analysis & Prevention, 61, 54–62. [DOI] [PubMed] [Google Scholar]
- [58].Steele C, Josephs R. (1990). Alcohol myopia: Its prized and dangerous effects.. American psychologist, 45(8), 921. [DOI] [PubMed] [Google Scholar]
- [59].Shults R, Elder R, Sleet D, Nichols J, Alao M, Carande-Kulis V, Zaza S, Sosin D, Thompson R, Task Force on Community Preventive Services, & others (2001). Reviews of evidence regarding interventions to reduce alcohol-impaired driving. American journal of preventive medicine, 21(4), 66–88. [DOI] [PubMed] [Google Scholar]
- [60].Jansen E, Thyssen H, Brynskov J. (1985). Gait analysis after intake of increasing amounts of alcohol. Zeitschrift fur Rechtsmedizin, 94(2), 103–107. [DOI] [PubMed] [Google Scholar]
- [61].Ordóñez F, Roggen D. (2016). Deep Convolutional and LSTM Recurrent Neural Networks for Multimodal Wearable Activity Recognition. Sensors, 16(1), 115. 10.3390/s16010115 [DOI] [PMC free article] [PubMed] [Google Scholar]
- [62].Zhao Y, Zhou S. (2017b). Wearable Device-Based Gait Recognition Using Angle Embedded Gait Dynamic Images and a Convolutional Neural Network. Sensors, 17(3), 478. 10.3390/s17030478 [DOI] [PMC free article] [PubMed] [Google Scholar]
- [63].Kim HB, Lee HJ, Lee WW, Kim SK, Jeon HS, Park HY, Shin CW, Yi WJ, Jeon B, Park KS (2018b). Validation of Freezing-of-Gait Monitoring Using Smartphone. Telemedicine and E-Health, 24(11), 899–907. 10.1089/tmj.2017.0215 [DOI] [PubMed] [Google Scholar]
- [64].Mannini A, Trojaniello D, Cereatti A, Sabatini A. (2016). A Machine Learning Framework for Gait Classification Using Inertial Sensors: Application to Elderly, Post-Stroke and Huntington’s Disease Patients. Sensors, 16(1), 134. 10.3390/s16010134 [DOI] [PMC free article] [PubMed] [Google Scholar]
- [65].Lee SI, Nam HS, Garst JH, Huang A, Campion A, Arnell M, Ghalehsariand N, Park S, Chang HJ, Lu DC, Sarrafzadeh M, Park E. (2017b). Unobtrusive and Continuous Monitoring of Alcohol-impaired Gait Using Smart Shoes. Methods of Information in Medicine, 56(01), 74–82. 10.3414/me15-02-0008 [DOI] [PubMed] [Google Scholar]
- [66].Hassan M, Wang Y, Wang D, Li D, Liang Y, Zhou Y, Xu D. (2021). Deep learning analysis and age prediction from shoeprints. Forensic Science International, 327, 110987. 10.1016/j.forsciint.2021.110987 [DOI] [PubMed] [Google Scholar]
- [67].Takemura N, Makihara Y, Muramatsu D, Echigo T, Yagi Y. (2019). On Input/Output Architectures for Convolutional Neural Network-Based Cross-View Gait Recognition. IEEE Transactions on Circuits and Systems for Video Technology, 29(9), 2708–2719. 10.1109/tcsvt.2017.2760835 [DOI] [Google Scholar]
- [68].Xu H, Li J, Yuan H, Liu Q, Fan S, Li T, Sun X. (2020). Human activity recognition based on Gramian angular field and deep convolutional neural network. IEEE Access, 8, 199393–199405. [Google Scholar]
- [69].Lee H, Yang K, Kim N, Ahn C. (2020). Detecting excessive load-carrying tasks using a deep learning network with a Gramian Angular Field. Automation in Construction, 120, 103390. [Google Scholar]
- [70].Arshad M, Jung D, Park M, Shin H, Kim J, Mun KR (2021). Gait-based Frailty Assessment using Image Representation of IMU Signals and Deep CNN. In 2021 43rd Annual International Conference of the IEEE Engineering in Medicine & Biology Society (EMBC) (pp. 1874–1879). [DOI] [PubMed] [Google Scholar]
- [71].Zhang G, Si Y, Wang D, Yang W, Sun Y. (2019). Automated detection of myocardial infarction using a gramian angular field and principal component analysis network. IEEE Access, 7, 171570–171583. [Google Scholar]
- [72].Thanaraj K, Parvathavarthini B, Tanik U, Rajinikanth V, Kadry S, Kamalanand K. (2020). Implementation of deep neural networks to classify EEG signals using gramian angular summation field for epilepsy diagnosis. arXiv preprint arXiv:2003.04534. [Google Scholar]
- [73].Kreuter D, Takahashi H, Omae Y, Akiduki T, Zhang Z. (2020). Classification of human gait acceleration data using convolutional neural networks. International Journal of Innovative Computing, Information and Control, 16(2), 609–619. [Google Scholar]


