Supplemental Digital Content is Available in the Text.
Key Words: HIV, estimates, spectrum
Abstract
Background:
Each year UNAIDS supports national teams to estimate key HIV indicators using their latest data. These estimates are produced using a collection of models and software tools. This paper describes the demographic and HIV projection models used in this process.
Methods:
The demographic model (DemProj) projects the population by sex and single age for each year of the estimate. This information is fed into the HIV model (AIDS Impact Model) to estimate key HIV indicators. The model uses program, survey and surveillance data along with incidence trends produced through 1 of several separate models, to estimate new HIV infections, HIV-related deaths, and the population living with HIV by sex, age, CD4 category, and treatment status.
Results:
These models allow the annual production of estimates of key HIV indicators including uncertainty intervals. This information is used to track progress toward national and global goals and to develop national strategic plans, Global Fund applications and PEPFAR country operational plans.
Conclusions:
Under the guidance of the UNAIDS Reference Group on Estimates, Modeling and Projections, these models are updated on a regular basis in response to evolving programmatic needs, new data, and analyses. This process of continuous review and improvement has led to mature models that make the best use of available data to provide estimates of indicators important to monitoring progress and developing future plans.
BACKGROUND
Every year UNAIDS supports Ministries of Health and national AIDS programs to produce updated estimates of key HIV indicators using their latest data. The estimates are supported by several models and software tools. Two of these tools are the Demographic Projection Model (DemProj) and the AIDS Impact Model (AIM) contained within the Spectrum software package.1 They have been used since 2002 to produce time trends of new HIV infections, HIV prevalence, HIV-related deaths, and other key indicators. Updates to these models have been described in a series of methods papers.2–8 This paper provides a complete description of the models used in the 2023 round of UNAIDS HIV estimates.
METHODS
Spectrum produces HIV estimates within an annual calculation loop. For each projection year, spectrum first performs demographic calculations, then projects adult HIV outcomes, and finally calculates HIV outcomes in children. The following paragraphs describe the methods of the demographic and HIV models. The main equations and tables of epidemiological parameters are presented in the Supplemental Digital Content, http://links.lww.com/QAI/C132.
Demographic Projections
The demographic model is a standard cohort component model9 that estimates the population by sex and single age for each year of the projection (see Equation 1 in Supplementary Appendix 1, Supplemental Digital Content, http://links.lww.com/QAI/C132). The inputs required for the population projection include the population by age and sex in the first year of the projection and, for all projection years, the total fertility rate, the age-distribution of fertility, the sex ratio at birth, life expectancy at birth, a life table that converts life expectancy at birth to age-specific survival rates and international migration by age and sex. For most country applications, these inputs are from a database produced by the United Nations Population Division called World Population Prospects (WPP).10 WPP publishes estimates of population size that refer to January 1st of each year. For the purposes of HIV estimates, these have been shifted by 1 day to December 31 of the previous year to align with the dates of the HIV program data. The software allows countries to replace these inputs with their own national population projection if they wish to do so.
The mortality rates provided in WPP represent all-cause mortality including an unknown proportion of deaths because of AIDS. Because AIM produces a separate estimate of HIV-related deaths, HIV-related mortality is removed from the WPP estimates before input into DemProj. This is performed by subtracting UNAIDS previous year estimates of HIV-related mortality rates by age, sex, year, and country from WPP all-cause mortality rates. HIV-related deaths calculated by AIM are added to HIV-unrelated deaths from DemProj as a competing risk of mortality as the model projects for each year. In this way, the population projection depends on the current estimate of HIV-related mortality.
These demographic calculations are applied to the population with and without HIV. However, HIV-unrelated mortality rates among people who inject drugs (PWID) are higher than non-PWID because of the risk of overdose, poor health, and violence associated with injecting drugs. This can have a noticeable effect on HIV estimates in settings where PWID are a significant portion of all people living with HIV (PLHIV). Therefore, an extra component of HIV-unrelated mortality for PLHIV is added, which assumes that the HIV-unrelated mortality rate for PWID living with HIV is 0.025 per person-year based on a review of the literature.11 The difference between this rate and the HIV-unrelated mortality rate at each adult age 15–49 is adjusted for the proportion of PLHIV that are PWID and added to the HIV-unrelated mortality rate (see Equations 2 and 3, Supplemental Digital Content, http://links.lww.com/QAI/C132).
Births are calculated from the total fertility rate, the distribution of lifetime fertility by age, and the number of women in each fertile age group (see Equation 4, Supplemental Digital Content, http://links.lww.com/QAI/C132).
Adult HIV Model
Figure 1 shows an outline of the adult HIV model in AIM. The figure represents the levels and flows for a specific sex and age. The demographic model provides the population by age and sex. Another model provides the incidence trend. These are combined in the adult HIV model, which distributes new HIV infections by age, sex, and CD4 count, (ϊ) then follows PLHIV as they progress through CD4 count categories (λ), die from HIV-related causes (µ), initiate antiretroviral therapy (ART) (c), discontinue ART (δ), or die on ART (α).
FIGURE 1.
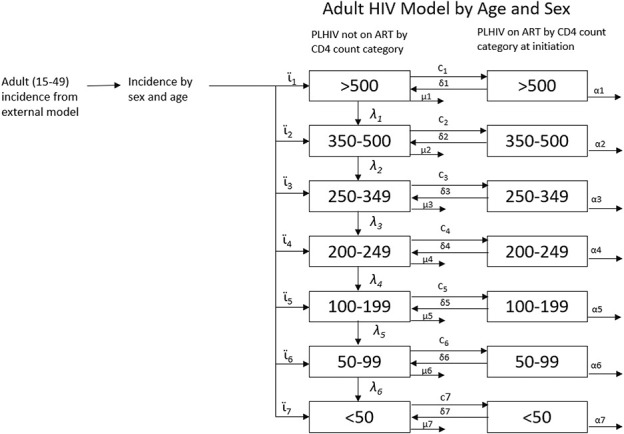
Adult HIV model.
Incidence Trends
Incidence trends are estimated by a model external to AIM. The best option for each country depends on the data available. The Epidemic Projection Package (EPP)12,13 is used by countries with good HIV prevalence surveillance data. The Case Surveillance and Vital Registration model (CSAVR)14 is used by countries with good case reports of new diagnoses and HIV-related deaths. The AIDS Epidemic Model (AEM) (formerly the Asia Epidemic Model)15 is used by countries with behavioral and HIV surveillance data on key populations. The European Center for Disease Control HIV model16 is used by European countries with good case reports of new diagnoses. A few countries use custom models. Many countries only have adequate data for 1 of these models. In countries with multiple types of data, national estimates teams may apply several models before selecting 1 that best fits the available data. In all cases, the incidence models produce trends of incidence among adults (aggregated by sex) aged 15–49 over time. EPP and AEM estimate incidence by fitting to HIV prevalence data. Since AIM has a different structure compared with EPP and CSAVR, it will not exactly reproduce the prevalence trends estimated by EPP or AEM, even when AIM uses their incidence trends as input. Therefore, AIM introduces small adjustments to incidence each year to match the prevalence trend.
Incidence by Age and Sex
The incidence trend from the external incidence model is split by sex using incidence rate ratios (IRR) for females relative to males, and by age using IRRs that describe the ratio of incidence at any age to incidence at ages 25–29 (see Equations 5–9, Supplemental Digital Content, http://links.lww.com/QAI/C132). IRRs by age are specified separately for each sex. These IRRs are estimated by fitting to survey estimates of prevalence by age and sex or program estimates of ART coverage by age and sex.7
Adult Progression and Mortality off ART
Adults living with HIV and not on ART are tracked by age, sex, and CD4 count as shown in Figure 1. New infections are first distributed by CD4 count (see Equation 10, Supplemental Digital Content, http://links.lww.com/QAI/C132) and then tracked as they progress to lower CD4 categories or die from HIV-related or HIV-unrelated causes (see Equation 11, Supplemental Digital Content, http://links.lww.com/QAI/C132). The distribution of new infections by CD4 count (ϊ, see Table S1, Supplemental Digital Content, http://links.lww.com/QAI/C131), HIV-related mortality rates (μ, see Table S2, Supplemental Digital Content, http://links.lww.com/QAI/C131), and progression rates (λ, see Table S3, Supplemental Digital Content, http://links.lww.com/QAI/C131) were estimated jointly by fitting to data from Population-based HIV Impact Assessments, HIV seroconverter studies from East Africa, and mortality rates from European, North American, and Australian seroconverter studies.17 These natural history parameters are assumed to apply to HIV populations in all countries. When applied to each cohort of new HIV infections, these inputs produce a pattern of survival similar to those shown in Figure 2.
FIGURE 2.
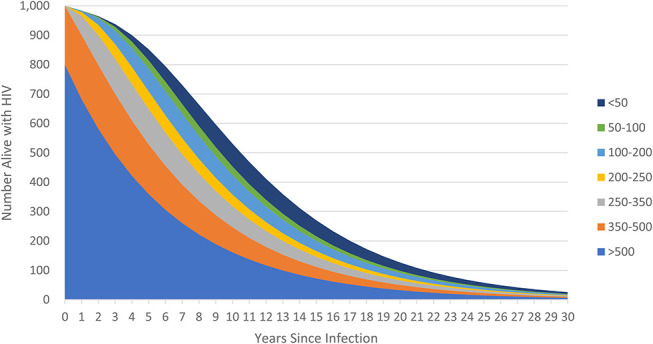
Evolution of a cohort of new HIV infections.
Mortality rates for PLHIV not on ART were estimated using data from cohorts before ART became available. Therefore, these rates describe the average mortality for a group of people in each CD4 category. However, in the era of widespread ART, it is likely that the characteristics of those not on ART in each CD4 category have changed. If those within each category who are most likely to die are also more likely to initiate ART than those at lower mortality risk, then the mortality rates for those not on treatment may have fallen as ART access increased. This phenomenon is reflected in HIV-related mortality data from European countries, which show mortality rates much lower than those estimated from pre-ART cohort data. To adjust for this effect, the off-ART mortality rates (µ) are adjusted for ART coverage such that they drop to 0 at 100% ART coverage (as described in more detail in ref. 7).
Adults on ART
Program data are used to specify the number of adult men and women on ART in each year. The model estimates the number of people that need to start ART to match the program data as shown below:
Where ARTs,t is the number of adults on ART as of December 31 by sex s and year t, α is the annual mortality rate of those on ART, δ represents patients in year t − 1 who discontinue treatment by year t, and newARTs,t is the number of new ART patients of sex s in year t.
The model does not distinguish between those who are initiating treatment for the first time and those who are restarting treatment after an interruption. ART patients are categorized by their CD4 count when they started treatment rather than their current CD4 count. This is done because more complete CD4 count information is available on CD4 counts at initiation than on current CD4 count. Patients who discontinue treatment are returned to the compartments for PLHIV not on treatment. In recognition of the likely increase in CD4 counts while on treatment, patients who discontinue ART after at least 1 year on treatment are placed in the CD4 category, 1 higher than that from which they initiated treatment, whereas patients who discontinue ART within 1 year of initiation return to their initial CD4 category.7
The distribution of new ART patients by CD4 count depends on changes in national ART eligibility criteria based on CD4 count thresholds and specific populations (eg, patients coinfected with tuberculosis, HIV-positive partners in serodiscordant couples, and others) who may have been eligible for ART regardless of CD4 count. AIM uses a weighted combination of 2 methods to estimate ART uptake by CD4 count, 1 in which patients are taken proportionally from all eligible CD4 count categories and 1 in which patients are started on treatment proportional to their expected mortality if they do not start treatment. By default, the weight for expected mortality is 0.2 and 0.8 for eligibility, based on the best fit to CD4 distributions from surveys.17
Mortality on ART
The number of people on ART at any time is calculated from the number on ART in the previous time step, HIV-related and HIV-unrelated mortality, the number newly initiating ART, and the number discontinuing treatment (see Equation 12, Supplemental Digital Content, http://links.lww.com/QAI/C132). Mortality rates for people on ART (α, see Table S4, Supplemental Digital Content, http://links.lww.com/QAI/C131) are much lower than for those not on ART. Mortality rates are defined by CD4 count at ART initiation, sex, age, time on ART (<6 months, 7–12 months and 12+ months), and region. Most regions use rates that were estimated by the International epidemiology Databases to Evaluate AIDS Collaboration (IeDEA) using treatment cohort data from sites around most of the world,18 whereas mortality rates for high-income settings were estimated from ART-CC cohorts.19 Figure 3 shows mortality rates by region for females 35–44 who have been on ART for more than 12 months. The full set of rates by age, sex, duration on treatment, and region are shown in the supplementary material (see Table S4, Supplemental Digital Content, http://links.lww.com/QAI/C131). These rates are further modified by time trends that describe the improvements in on-ART survival since the beginning of ARV therapy (see Table S5, Supplemental Digital Content, http://links.lww.com/QAI/C131).
FIGURE 3.
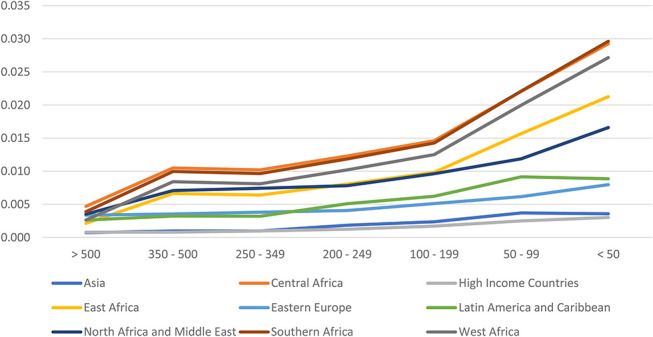
Mortality on ART by region for females 35–44 and on ART for more than 12 months.
Pediatric HIV Model
AIM calculates new HIV infections in children from fertility, breastfeeding behavior, and use of ARV regimens. The fertility of women of reproductive ages living with HIV is used to estimate the number of births to HIV+ women. Program data on the number of women receiving ARV prophylaxis by regimen, survey information on breastfeeding patterns, and rates of perinatal and postnatal mother-to-child transmission by ARV status are used to estimate the number of new HIV infections among children born to HIV-positive mothers. Infected children are followed by CD4 percent categories from the ages of 0–4 and then transitioned to CD4 count categories (Fig. 4). Children living with HIV (CLHIV) are followed as they progress through CD4 categories (λ), die (μ), and age. At age 15, CLHIV are transitioned to the adult HIV model. The number of orphans is estimated from deaths to women with living children under the age of 18. Each of these processes is described in detail below. The model tracks the HIV population by year, age, sex, CD4 percent or count, time of infection, and ART status.
FIGURE 4.
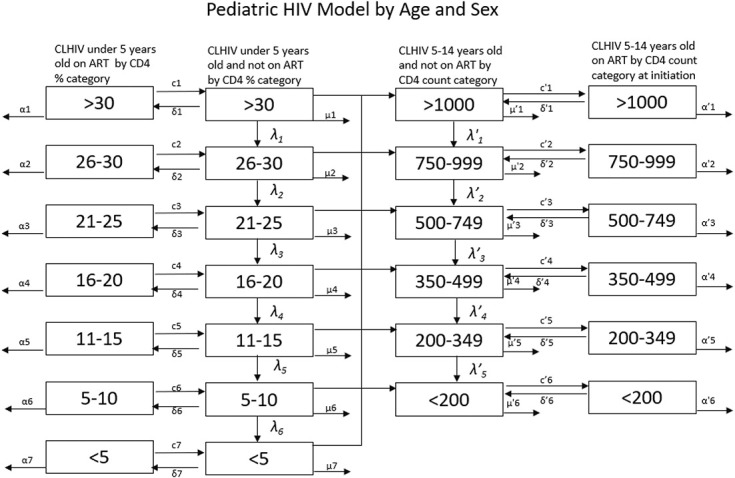
Structure of pediatric HIV model.
Births to HIV-Positive Women
Data from national household surveys show that the fertility of HIV-positive women is generally less than HIV-negative women.20 These data have been used to estimate the ratio of fertility among HIV-positive women to HIV-negative women by age, CD4 count, and ART status21,22 (see Table S6, Supplemental Digital Content, http://links.lww.com/QAI/C131).
Applying the total fertility rate and these HIV-related effects to HIV-positive women produces an initial estimate of the number of HIV-positive pregnant women (see Equations 13–14, Supplemental Digital Content, http://links.lww.com/QAI/C132). HIV prevalence among pregnant women can be estimated by dividing this number by the total number of births. Program data from antenatal clinics (ANC) provide another estimate of prevalence among pregnant women, if ANC attendance and HIV testing are nearly universal. In those cases, we further refine these estimates by multiplying the initial estimate of prevalence by a time-invariant local adjustment factor. This factor is determined by fitting to the prevalence reported by program data for those years with high ANC coverage and HIV testing.
Transmission of HIV From Mother to Child
Program data are used to indicate for each year, the number of HIV-positive pregnant women who receive some type of ARV prophylaxis or therapy. Options have varied over the years. Detailed analysis of study data have provided estimates of mother-to-child transmission rates by type of prophylaxis7 and the continuation on ARVs during pregnancy and breastfeeding.8 These rates are shown in Table S7, Supplemental Digital Content, http://links.lww.com/QAI/C131. The overall transmission rate during pregnancy and up to 6 weeks after birth is determined as a weighted average of the percentage of women in each prophylaxis category at the time of birth and the corresponding transmission rates (see Equation 15, Supplemental Digital Content, http://links.lww.com/QAI/C132). Transmission during breastfeeding is estimated for HIV-exposed uninfected children who are still breastfeeding by month (see Equations 16–21, Supplemental Digital Content, http://links.lww.com/QAI/C132).
Pediatric Progression and Mortality off ART
CLHIV are tracked by CD4 category in a process similar to that for adults, but there are some important structural differences. Children under the age of 5 are tracked by CD4 percent, a more reliable measure than CD4 count for young children. Children transition to pediatric CD4 count categories at age 5 and to the adult CD4 count categories at age 15. The transitions at age 5 are based on data from the IeDEA Consortium8 (see Table S8, Supplemental Digital Content, http://links.lww.com/QAI/C131), whereas the transitions at age 15 are simply a recategorization of the CD4 counts.
HIV-related mortality for children not on treatment depends on when the child became infected. For those infected perinatally, median survival without treatment is only about 2 years, but it is considerably longer for children infected through breastfeeding in the first 6 months (6 years), 7–12 months (11 years), or greater than 12 months (14 years) as shown in Figure 5.4,23 Therefore, the model tracks CLHIV not on ART by timing of infection.
FIGURE 5.
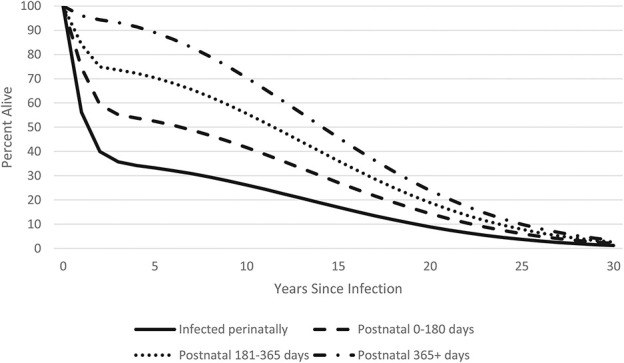
Survival of HIV-positive children by time of infection.
The initial distribution by CD4 percent of newly infected children is based on data from the HIV Pediatric Prognostic Markers Collaborative Study and the Cross Continents Collaboration for Kids (3Cs4kids) (see Table S9, Supplemental Digital Content, http://links.lww.com/QAI/C131, see Equation 22, Supplemental Digital Content, http://links.lww.com/QAI/C132).24,25
The progression and non-ART AIDS-mortality rates for each category of new infection (perinatal, 0–6, 7–12 and 12+ months of breastfeeding) were determined by fitting exponential curves (mortality) and quadratic curves (progression) to the survival curves (see Tables S10 and S11, Supplemental Digital Content, http://links.lww.com/QAI/C131).
HIV mortality in children can be reduced by the provision of cotrimoxazole by children on and off ART.26,27 The World Health Organization recommends cotrimoxazole for all HIV-exposed infants starting at 4–6 weeks of age and continuing until HIV-infection can be excluded.28 HIV-infected children should continue on cotrimoxazole at least until age 1 and longer in those in countries with a high burden of infectious diseases. In the model, cotrimoxazole reduces HIV-related mortality by 33% up to age 5 in children not on ART and in the first year of treatment for children who start ART (see Table S12, Supplemental Digital Content, http://links.lww.com/QAI/C131, see Equation 23, Supplemental Digital Content, http://links.lww.com/QAI/C132).
Pediatric ART Mortality
Program data determine the number of children on ART in each year. The model estimates the number of children newly starting ART from the total number on ART, mortality, aging, and discontinuation (see Equation 24, Supplemental Digital Content, http://links.lww.com/QAI/C132). New ART patients are distributed by age according to regional patterns derived from IeDEA treatment cohorts (see Table S13, Supplemental Digital Content, http://links.lww.com/QAI/C131).7 HIV-related mortality rates for children on ART are specified by age (0, 1–2, 3–4, 5–9, 10–14), sex, duration on treatment (0–6 months, 7–12 months, 12+ months), and geographic region (see Table S14, Supplemental Digital Content, http://links.lww.com/QAI/C131).29 As for adults, these rates include time trends in overall mortality that reflect improvements in regimens and services (see Table S15, Supplemental Digital Content, http://links.lww.com/QAI/C131).
Orphans
The information on HIV-related deaths and non-HIV deaths is used to estimate the number of orphans, defined as children younger than age 18 who have lost 1 or both parents. New orphans in year t are the surviving children younger than age 18 of adults who die in year t. Total orphans include children orphaned in previous years who survive to year t and still remain younger than age 18. Orphans are estimated by type including AIDS and non-AIDS and maternal, paternal and dual orphans.5 Dual orphans are estimated with a regression model fit to data from 34 demographic and health surveys.
Treatment cascade
AIM produces estimates of the number of PLHIV and the percent receiving ART. Estimates of the percent of PLHIV knowing their status are based on 1 of 3 methods: the CSAVR model (which estimates knowledge of status from data on new diagnoses and mortality), the Shiny90 model30 (which fits to survey and program data), or program estimates based on new diagnoses and HIV-related deaths. The percentage of PLHIV on ART who are virally suppressed is based on program data on viral load testing.
Uncertainty Analysis
Uncertainty around the model estimates is assessed by a Monte Carlo process that incorporates uncertainty around all key inputs (progression, mortality on and off ART, mother-to-child transmission rates, and HIV incidence trends). Typically, 300 projections are made using random draws from all key inputs to determine the lower and upper confidence bounds around each output indicator.
RESULTS
The Spectrum/AIM model described here produces estimates and projections, with uncertainty bounds, of the number of PLHIV by sex, year, single age, CD4 count, and ART status, as well as new infections and HIV-related deaths. Several special outputs are produced for tracking progress toward global goals. These include a full treatment cascade (PLHIV, knowledge of status, on ART and viral suppression), mother-to-child transmission rates by cause (on ART, discontinued ART, never on ART, and incident infection for the perinatal and breastfeeding periods) and indicators of epidemic transition including the incidence—mortality ratio (the ratio of new HIV infections to all-cause deaths to PLHIV) and the incidence—prevalence ratio (the ratio of the number of new HIV infections to PLHIV).31
DISCUSSION
The Spectrum DemProj and AIM modules are used every year by national estimates teams in over 100 countries to prepare estimates of key HIV indicators using their latest program, survey, and surveillance data. Annual updates to these and other models that are part of the estimates process are guided by the UNAIDS Reference Group on Estimates, Modeling, and Projections (www.epidem.org). The models and assumptions are updated in response to new needs for tracking progress toward goals, such as the 95–95–95 treatment goal32 and the elimination of mother-to-child transmission,33 and new data and analysis that improve our understanding of the epidemic. The estimation process has evolved over time to the point where it now provides robust estimates of key HIV indicators that are used to guide the development of national responses, Global Fund applications, PEPFAR country operational plans, and global monitoring. The results are published annually by UNAIDS and most estimates are available in public databases (https://aidsinfo.unaids.org/). Spectrum HIV estimates files for many countries can be requested from UNAIDS (https://hivtools.unaids.org/spectrum-file-request/). The software that implements the model described here is available for download at https://www.avenirhealth.org/software-spectrum.php.
Supplementary Material
ACKNOWLEDGMENTS
The development of the AIM and DemProj models has been guided by the UNAIDS Reference Group on Estimates, Modeling, and Projections (www.epidem.org).
Footnotes
J.S. and R.G. received support for this work from the Bill & Melinda Gates Foundation (OPP1191665 and INV-040115) and UNAIDS (PO#202912623).
The authors have no funding or conflicts of interest to disclose.
Supplemental digital content is available for this article. Direct URL citations appear in the printed text and are provided in the HTML and PDF versions of this article on the journal's Web site (www.jaids.com).
J.S. and R.G. authors contributed equally to this work.
REFERENCES
- 1.Avenir Health. Spectrum manual: Spectrum system of policy models. Available from: http://avenirhealth.org/Download/Spectrum/Manuals/SpectrumManualE.pdf
- 2.Stover J, Johnson P, Zaba B, et al. The Spectrum projection package: improvements in estimating mortality, ART needs, PMTCT impact and uncertainty bounds. Sex Transm Infect. 2008;84 (suppl l):i24–i30. [DOI] [PMC free article] [PubMed] [Google Scholar]
- 3.Stover J, Johnson P, Hallett T, et al. The Spectrum projection package: improvements in estimating incidence by age and sex, mother-to-child transmission, HIV progression in children and double orphans. Sex Transm Infect. 2010;86 (suppl l_2):ii16–ii21. [DOI] [PMC free article] [PubMed] [Google Scholar]
- 4.Stover J, Brown T, Marston M. Updates to the Spectrum/Estimation and Projection Package (EPP) model to estimate HIV trends for adults and children. Sex Transm Infect. 2012;88(suppl l_2):i11–ii16. doi. [DOI] [PMC free article] [PubMed] [Google Scholar]
- 5.Stover J, Andreev K, Slaymaker E, et al. Updates to the Spectrum model to estimate key HIV indicators for adults and children. AIDS. 2014;28:S427–S434. [DOI] [PMC free article] [PubMed] [Google Scholar]
- 6.Stover J, Brown T, Puckett R, et al. Updates to the Spectrum/Estimations and Projections Package model for estimating trends and current values for key HIV indicators. AIDS. 2017;31(suppl 1):S5–S11. [DOI] [PubMed] [Google Scholar]
- 7.Stover J, Glaubius R, Mofenson L, et al. Updates to the Spectrum/AIM model for estimating key HIV indicators at national and subnational levels. AIDS. 2019;33(suppl 3):S227–S234. [DOI] [PMC free article] [PubMed] [Google Scholar]
- 8.Stover J, Glaubius R, Kassanjee R, et al. Updates to the Spectrum/AIM model for the UNAIDS 2020 HIV estimates. J Int AIDS Soc. 2021;24(suppl 5):e25778. [DOI] [PMC free article] [PubMed] [Google Scholar]
- 9.United Nations. Manual III: Methods for Population Projections by Sex and Age. New York: Department of Economic and Social Affairs; 1956. [Google Scholar]
- 10.United Nations, Department of Economic and Social Affairs. World Population Prospects 2022: Summary of Results. UN DESA/POP/2022/TR/NO. 3. New York, NY: United Nations; 2022. [Google Scholar]
- 11.Mathers BM, Degenhardt L. Examining non-AIDS mortality among people who inject drugs. AIDS (London, England). 2014;28:S435–S444. [DOI] [PMC free article] [PubMed] [Google Scholar]
- 12.Ghys PD, Brown T, Grassly NC, et al. The UNAIDS Estimation and Projection Package: a software package to estimate and project national HIV epidemics. Sex Transm Infect. 2004;80(suppl 1):i5–i9. [DOI] [PMC free article] [PubMed] [Google Scholar]
- 13.Eaton JW, Brown T, Puckett R, et al. The Estimation and Projection Package Age-Sex Model and the r-Hybrid model: new tools for estimating HIV incidence trends in sub-Saharan Africa. AIDS. 2019;33(suppl 3):S235–S244. [DOI] [PMC free article] [PubMed] [Google Scholar]
- 14.Mahiane SG, Eaton JW, Glaubius R, et al. Updates to Spectrum's case surveillance and vital registration tool for HIV estimates and projections. J Int AIDS Soc. 2021;24(suppl 5):e25777. [DOI] [PMC free article] [PubMed] [Google Scholar]
- 15.Brown T, Peerapatanapokin W. The Asian Epidemic Model: a process model for exploring HIV policy and programme alternatives in Asia. Sex Transm Infect. 2004;80(suppl 1):i19–i24. [DOI] [PMC free article] [PubMed] [Google Scholar]
- 16.van Sighem A, Nakagawa F, De Angelis D, et al. Estimating HIV incidence, time to diagnosis, and the undiagnosed HIV epidemic using routine surveillance data. Epidemiology. 2015;26:653–660. [DOI] [PMC free article] [PubMed] [Google Scholar]
- 17.Glaubius R, Kothegal N, Birhanu S, et al. Disease progression and mortality with untreated HIV infection: evidence synthesis of HIV seroconverter cohorts, antiretroviral treatment clinical cohorts and population-based survey data. J Int AIDS Soc. 2021;24(suppl 5):e25784. [DOI] [PMC free article] [PubMed] [Google Scholar]
- 18.Anderegg N, Johnson LF, Zaniewski E, et al. All-cause mortality in HIV-positive adults starting combination antiretroviral therapy: correcting for loss to follow-up. AIDS. 2017;31(suppl 1):S31–S40. [DOI] [PMC free article] [PubMed] [Google Scholar]
- 19.Trickey A, van Sighem A, Stover J, et al. Parameter estimates for trends and patterns of excess mortality among persons on antiretroviral therapy in high-income European settings. AIDS. 2019;33(suppl 3):S271–S281. [DOI] [PMC free article] [PubMed] [Google Scholar]
- 20.Chen WJ, Walker N. Fertility of HIV-infected women: insights from demographic and health surveys. Sex Transm Infect. 2010;86 (suppl l_2):ii22–ii27. [DOI] [PMC free article] [PubMed] [Google Scholar]
- 21.Marston M, Nakiyingi-Miiro J, Kusemererwa S, et al. The effects of HIV on fertility by infection duration: evidence from African population cohorts before antiretroviral treatment availability. AIDS. 2017;31(suppl 1):S69–S76. [DOI] [PubMed] [Google Scholar]
- 22.Eaton JE, Glaubius R, Jonnalagadda S, et al. Fertility among HIV positive women in SSA. Presented at the Meeting of the UNAIDS Reference Group on Estimates, Modeling and Projections. Switzerland: Bern; 2018. [Google Scholar]
- 23.Marston M, Becquet R, Zaba B, et al. Net survival of perinatally and postnatally HIV-infected children: a pooled analysis of individual data from sub-Saharan Africa. Int J Epidemiol. 2011;40:385–396. [DOI] [PMC free article] [PubMed] [Google Scholar]
- 24.Dunn D. CD4 distributions in HIV Paediatric Prognostics Markers Collaborative Study and cross continents collaboration for kids. Presented to the October 2009 Meeting of the UNAIDS Reference Group on Estimates Modeling and Projections. Geneva, Switzerland: UNAIDS; 2009. [Google Scholar]
- 25.Dunn D, Woodburn P, Duong T, et al. Current CD4 cell count and the short-term risk of AIDS and death before the availability of effective antiretroviral therapy in HIV-infected children and adults. J Infect Dis. 2008;197:398–404. [DOI] [PubMed] [Google Scholar]
- 26.Chintu C, Bhat GJ, Walker AS, et al. Co-trimoxazole as prophylaxis against opportunistic infections in HIV-infected Zambian children (CHAP): a double-blind randomised placebo-controlled trial. Lancet. 2004;364:1865–1871. [DOI] [PubMed] [Google Scholar]
- 27.Bwakura-Dangarembizi M, Kendall L, Bakeera-Kitaka S, et al. A randomized trial of prolonged Co-trimoxazole in HIV-infected children in Africa. N Engl J Med. 2014;370:41–53. [DOI] [PMC free article] [PubMed] [Google Scholar]
- 28.WHO. Guidelines on Co-trimoxazole Prophylaxis for HIV-Related Infections Among Children, Adolescents and Adults: Recommendations for a Public Health Approach. Geneva: World Health Organization; 2006. [Google Scholar]
- 29.Kassanjee R, Johnson LF, Zaniewski E, et al. Global HIV mortality trends among children on antiretroviral treatment corrected for under-reported deaths: an updated analysis of the International epidemiology Databases to Evaluate AIDS collaboration. J Int AIDS Soc. 2021;24(suppl 5):e25780. [DOI] [PMC free article] [PubMed] [Google Scholar]
- 30.Maheu-Giroux M, Marsh K, Doyle CM, et al. National HIV testing and diagnosis coverage in sub-Saharan Africa: a new modeling tool for estimating the ‘first 90’ from program and survey data. AIDS. 2019;33(suppl 3):S255–S269. [DOI] [PMC free article] [PubMed] [Google Scholar]
- 31.Ghys PD, Williams BG, Over M, et al. Epidemiological metrics and benchmarks for a transition in the HIV epidemic. PLoS Med. 2018;15:e1002678. [DOI] [PMC free article] [PubMed] [Google Scholar]
- 32.Joint United Nations Programme on HIV/AIDS. Global AIDS Strategy 2021–2026—End Inequalities. End AIDS. Geneva: Joint United Nations Programme on HIV/AIDS; 2021. [Google Scholar]
- 33.Joint United Nations Programme on HIV/AIDS. Start Free, Stay Free, AIDS Free. Final Report on the 2020 Targets. Geneva: UNAIDS; 2021. [Google Scholar]
Associated Data
This section collects any data citations, data availability statements, or supplementary materials included in this article.


