Abstract
The general stress sigma factor ςS (RpoS) of Escherichia coli is strongly induced in response to glucose starvation. This increase in the cellular ςS level is due to stabilization of ςS, which under non-stress conditions is subject to rapid proteolysis. In the present study, it is demonstrated that ςS is also induced during the diauxic shift from glucose to lactose, i.e., under conditions of glucose exhaustion in the presence of another, less-preferred carbon source that eventually gets utilized. This ςS induction, which is due to stabilization, is transient and precedes the induction of β-galactosidase. In parallel, ςS-dependent genes are transiently activated, as was shown here for osmY. Although ςS can mediate transcription of lacZ in vitro, ςS does not contribute to the induction of β-galactosidase during the diauxic lag phase. Rather, the induction of ςS and the general stress response during the diauxic shift plays the role of a rapidly activated emergency system, which is shut off again as soon as the cells are able to cope with the stress situation by utilizing a more specific and more economical system.
The ςS subunit of RNA polymerase (or RpoS) is the master regulator of the general stress response in Escherichia coli. While ςS levels are low in rapidly growing cells not exposed to any particular stress, ςS is induced in response to a variety of rather diverse environmental stress conditions that include starvation for various nutrients, stationary phase in general, high osmolarity, and high or low temperature (for recent reviews, see references 3 and 4). These stresses differentially affect rpoS transcription and translation as well as the rate of proteolysis of ςS, which under non-stress conditions is a highly unstable protein (11). Glucose starvation in particular is one of the conditions that interferes with ςS turnover (11, 24). ςS induction is then followed by the activation of numerous ςS-dependent genes, which results in rather dramatic changes in physiology, including the expression of a strong general stress resistance, and even in cellular morphology (4, 7, 13).
The reaction to glucose exhaustion has been studied extensively under conditions where the medium contains a second utilizable, even though less-preferred, carbon source such as lactose. During growth on glucose, uptake and utilization of lactose are inhibited due to inducer exclusion and low-level expression of the lac operon mediated by enzyme IIAGlc, a component of the PTSGlc uptake and signal transduction system (14, 20–22). Here, glucose exhaustion results in a transient growth arrest termed the diauxic lag phase, during which lactose permease and β-galactosidase are induced, which then allow the cells to resume growth on lactose as the carbon source (2, 16).
The regulation of the lac operon has provided the basis for paradigms of specific gene regulation in bacteria, but the diauxic shift has not been looked at as a bacterial stress response. Therefore, we asked whether entry into the diauxic lag phase, i.e., starvation for glucose in the presence of another carbon source that eventually gets utilized, provokes a stress response similar to that observed upon glucose starvation in a medium that does not contain other carbon sources, i.e., during entry into stationary phase. Under the latter conditions, induction of ςS results in major physiological and morphological changes. However, when another carbon source could replace the missing glucose, the induction of such a complex response would not be necessary. E. coli might thus be able to discriminate between the two situations.
However, we observed ςS induction during the diauxic lag phase, which precedes the induction of the lac operon and lactose utilization. As cells resume growth on lactose, ςS levels are reduced again. Thus, ςS induction, which is due to inhibition of ςS proteolysis, has the characteristics of an immediate emergency system that the cells transiently resort to, even if in the somewhat longer run they can afford not to make use of it.
MATERIALS AND METHODS
Bacterial strains and growth conditions.
E. coli W3110 [F− IN(rrnD-rrnE)1 thyA36 deoC2] (1, 19) was used in the present study. The strain was kindly provided by the E. coli Stock Center (New Haven, Conn.). As it was recently observed that strain W3110 exists in a number of variants with respect to ςS levels and even ςS molecular weight (6), we initially tested ςS levels and stress inducibility and found that these were very similar in our W3110 strain and in strain MC4100, in which ςS has been well characterized previously (11). The rpoS mutant derivative of W3110 was obtained by P1 transduction (15) with strain RH90 (MC4100 rpoS359::Tn10 [10]) as a donor.
Standard batch cultures were grown at 37°C under aeration in a rotary shaker in minimal medium M9 (15) supplemented with 0.03% glucose and 0.1% lactose for diauxie experiments. In single-carbon-source experiments, glucose and lactose were used at concentrations of 0.2%. Growth was monitored by measuring the optical density at 578 nm (OD578).
SDS-PAGE and immunoblot analysis.
Sample preparations for sodium dodecyl sulfate-polyacrylamide gel electrophoresis (SDS-PAGE) (8) and immunoblot analysis were performed as described previously (11). Twenty micrograms of total cellular protein per lane was used on SDS gels. For detection of ςS and β-galactosidase, polyclonal sera produced in rabbits were used. Bands were visualized by using a goat anti-rabbit immunoglobulin G alkaline phosphatase conjugate (Sigma) and the chromogenic substrates BCIP (5-bromo-4-chloro-3-indolylphosphate)–nitroblue tetrazolium (Boehringer Mannheim). Relative ςS and β-galactosidase levels determined were normalized for the levels obtained during exponential growth on glucose.
Pulse labelling of cells and immunoprecipitation.
Pulse labelling of cells with l-[35S]methionine and immunoprecipitation of ςS were previously described (11). The OD578 of the samples was adjusted with supernatant from the same cultures obtained by centrifugation immediately before taking the samples for pulse labelling. The pulse time was 1.0 min. For the determination of relative rates of ςS synthesis, the chase time was 0.25 min, whereas for the determination of ςS half-life, chase times varied between 0.25 and 10 min. For immunoprecipitation, a polyclonal serum against ςS (11) was used. Protein bands on autoradiographs were quantitated densitometrically. The intensity of bands representing ςS was calculated relative to the intensity of bands representing stable proteins that weakly cross-reacted with the antisera used.
Preparation of mRNA and primer extension.
For the quantitation of osmY mRNA, strain W3110 transformed with pNH5, a pBR322 derivative carrying the osmY gene on a 1.4-kb PstI insert (4a), was used (W3110 carrying just the single copy of osmY on the chromosome does not produce enough osmY mRNA for reliable detection and quantification; osmY exhibits similar regulation when present in single or multiple copies [9], consistent with all its known regulators [9] being abundant proteins). Total RNA was prepared by hot phenol extraction of cells sampled during the different phases of the diauxie experiment. For primer extension reactions, a 5′ digoxigenin-labelled oligonucleotide with the sequence 5′-CAGTCTTGTCATAGTCATGG-3′, which is complementary to a region near the 5′ end of osmY, was used. The reactions were performed according to standard procedures (23) with 5 μg of total RNA and 12.5 units of avian myeloblastosis virus reverse transcriptase (Boehringer Mannheim) as previously described (9, 12). As a reference, double-strand sequencing reactions were performed with the same primer as that used in the primer extension experiments.
β-Galactosidase assay.
β-Galactosidase activity was assayed by use of ONPG (o-nitrophenyl-β-d-galactopyranoside) as a substrate and is reported as micromoles of o-nitrophenol per minute per milligram of cellular protein, as described by Miller (15).
RESULTS AND DISCUSSION
Cellular ςS levels rapidly and transiently increase due to stabilization of ςS during the diauxic lag phase.
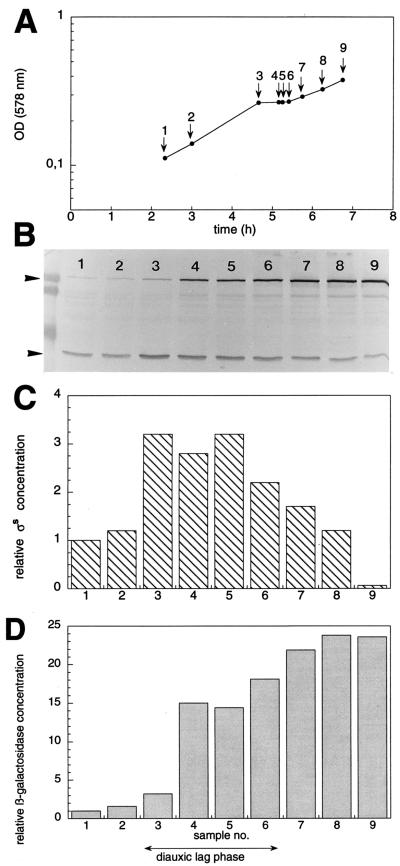
Classical diauxie experiments (16) were performed with E. coli W3110 by using a combination of 0.03% glucose and 0.1% lactose as carbon sources in a minimal medium batch culture. Relative cellular levels of ςS and β-galactosidase were determined by immunoblot analysis (Fig. 1). As expected, a diauxic lag phase of approximately 40 min was observed (Fig. 1A). Immediately after the onset of this lag phase, we found an approximately threefold induction of ςS (Fig. 1B and C). Increased ςS levels were maintained throughout the lag phase but started to gradually decline again as soon as the cells resumed growth. By contrast, a more than 20-fold induction of β-galactosidase occurred with slower kinetics and reached a permanent maximum after the cells had already started to grow on lactose. Similar results (fivefold induction of ςS) were obtained when the diauxic shift experiment was performed under batch fermentation conditions, where much higher cellular densities are reached (25).
FIG. 1.
Induction of ςS and β-galactosidase during the diauxic shift from glucose to lactose. Strain W3110 was grown in M9 minimal medium supplemented with 0.03% glucose and 0.1% lactose. Samples are designated with the same numbers throughout the entire figure. OD578s were measured (A) and relative levels of ςS and β-galactosidase were determined by immunoblot analysis (B) (with size standard proteins of 106, 80, and 49 kDa shown at the left side of the figure). Bands representing ςS (lower arrowhead) and β-galactosidase (upper arrowhead) were quantitated densitometrically (C and D, respectively), and the data obtained were normalized for the values determined during exponential growth on glucose (sample 1).
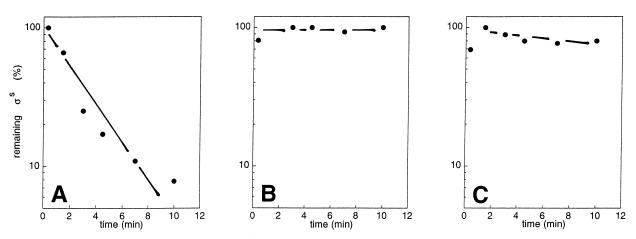
When cells are grown on glucose alone as a carbon source, glucose exhaustion results in a rapid stabilization of ςS (11, 24). The rapid kinetics of ςS induction at the onset of the diauxic lag phase (Fig. 1) also suggested an inhibition of proteolysis rather than regulation at the genetic level. Therefore, we tested ςS degradation in pulse-chase experiments during the different phases of the diauxie experiment (Fig. 2). We determined a ςS half-life of approximately 2 min during the “glucose phase” (Fig. 2A), which is very similar to previously observed half-lives during growth on glucose alone (11, 17, 18, 24). In the diauxic lag phase, however, ςS proteolysis was completely inhibited (Fig. 2B). ςS turnover remained relatively inefficient in the “lactose phase” (as determined approximately 45 min after cells had started to grow on lactose), with the ςS half-life being considerably higher (more than 20 min) than during the initial growth phase on glucose (Fig. 2C).
FIG. 2.
In vivo turnover of ςS during the different phases of the diauxic shift experiment. Strain W3110 was grown in M9 medium supplemented with 0.03% glucose and 0.1% lactose. Samples were taken during initial growth on glucose (OD578 = 0.16) (A), approximately 10 min after the onset of the diauxic lag phase (OD578 = 0.26) (B), and during growth on lactose (OD578 = 0.35) (C). The samples were pulse labelled with [35S]methionine as described in Materials and Methods. ςS was immunoprecipitated from cell extracts made of pulse-labelled cells and was visualized by SDS-PAGE and autoradiography. A densitometric quantitation of the autoradiographic data is shown.
After the diauxic lag phase, when cells resume growth on lactose, the cellular ςS content gradually declined to levels similar to those observed during initial growth on glucose (Fig. 1). Yet ςS stability was clearly higher during the lactose phase than during the glucose phase (Fig. 2), indicating that the rate of ςS synthesis might be low after cells start to grow on lactose. The 30% reduction in the relative rate of ςS synthesis in W3110 cells growing on lactose compared to that observed in cells growing on glucose (data not shown) did not seem sufficient to account for the observed decrease in ςS levels during the lactose phase. Whether and how various carbon sources or specific growth conditions differentially modulate rates of ςS synthesis and degradation, even though the resulting ςS levels might be similar, remains to be determined.
We conclude that glucose starvation, no matter whether another eventually utilizable carbon source is present or not, initially represents a stress condition the cells respond to by inhibiting ςS proteolysis and thus rapidly increasing their ςS content. As soon as the cells start to utilize lactose as the alternative carbon source, ςS levels are reduced again. Interestingly, this decrease in ςS content is not due to rapid proteolysis; rather, ςS synthesis seems to be reduced.
The increase in the cellular ςS level during the diauxic lag phase is accompanied by the induction of ςS-dependent genes.
The general stress response is dependent on many genes that require ςS for expression, but their expression profiles do not necessarily follow that of ςS, since often additional regulatory proteins are involved in their control. Many ςS-dependent genes (e.g., osmY [9]) are under the negative control of cyclic AMP (cAMP) receptor protein-cAMP complex (CRP-cAMP) (4). As cAMP levels rise during diauxic shift (5), we wondered whether those genes would really be activated in parallel to ςS induction.
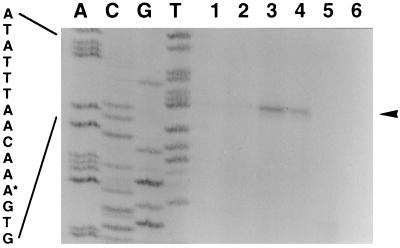
osmY mRNA was quantitated by primer extension before, during, and after the diauxic lag phase. We found that osmY mRNA levels increased in parallel to the ςS content of the cells during diauxic growth arrest. As soon as cells resumed growth on lactose, osmY mRNA rapidly decreased again to hardly detectable levels (Fig. 3).
FIG. 3.
Analysis of osmY mRNA during the different phases of the diauxic shift experiment. Strain W3110 carrying pNH5 was grown in M9 medium supplemented with 0.03% glucose and 0.1% lactose. RNA was prepared during growth on glucose (lane 1, OD578 = 0.15; lane 2, OD578 = 0.20), during the beginning (lane 3, OD578 = 0.27) and the end (lane 4, OD578 = 0.29) of the diauxic lag phase, and during growth on lactose (lane 5, OD578 = 0.31; lane 6, OD578 = 0.35). The reverse osmY transcript (for details, see Materials and Methods) is indicated by an arrowhead. As a reference, sequencing reactions were performed with pNH5 and the same primer as that used for primer extension. The sequence covering the osmY transcriptional start site is given, with the start site marked by an asterisk.
We conclude that not only ςS but also osmY (and probably other similarly regulated ςS-dependent genes) are induced during the diauxic lag phase, even though osmY is negatively controlled by CRP-cAMP (9). During the diauxic lag phase, cAMP levels increase in parallel to β-galactosidase levels (5, 19a), i.e., they lag behind the induction of ςS and osmY. This may explain why CRP-cAMP does not interfere with osmY activation. Rather, CRP-cAMP could contribute to the rapid and apparently complete shutoff of osmY and perhaps other ςS-dependent genes, i.e., to the termination of the general stress response around the end of the diauxic lag phase (before cAMP levels decrease again during the early phase of growth on lactose [5]).
Does the increase in the cellular ςS level during the diauxic lag phase play a role in the induction of the lac operon?
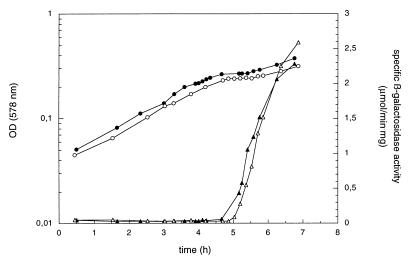
In in vitro transcription assays, the lac promoter can be recognized by RNA polymerase holoenzyme containing either ς70 or ςS (25). Therefore, it seemed possible that increased ςS levels during the diauxic lag phase could contribute to the expression of the lac operon. This would also be consistent with the kinetics of induction of ςS and β-galactosidase. However, induction of β-galactosidase during the diauxic lag phase is very similar in wild-type and otherwise isogenic rpoS mutant cells (Fig. 4), which demonstrates that ςS does not play a role in the expression of the lac operon in vivo.
FIG. 4.
Induction of β-galactosidase during the diauxic lag phase is not affected by a mutation in rpoS. Strain W3110 (closed symbols) and its rpoS::Tn10 derivative (open symbols) were grown in M9 minimal medium supplemented with 0.03% glucose and 0.1% lactose. Optical densities (circles) and specific β-galactosidase activities (triangles) were determined.
Conclusions.
During the diauxic lag phase, E. coli cells transiently induce ςS and ςS-dependent genes; i.e., they activate the general stress response, even though in the somewhat longer run they do not need this complex response. What is the function of increased levels of ςS and ςS-dependent stress-protective proteins during the diauxic lag phase?
With its rapid kinetics and transient nature, this induction of ςS and of the general stress response has the characteristics of a rapid emergency response. It may be that this response is initiated whenever the nutritional situation deteriorates but is reversed as soon as the cells induce another, more economical system that allows them to cope with the situation. Thus, the general stress and starvation response in E. coli is a flexible, very rapidly inducible, and probably at any time reversible response. Nevertheless, if not reversed, the physiological and morphological consequences and the protective potential of this ςS-mediated stress response are considerable and, in principle, comparable to the consequences of sporulation. With these properties, the general stress response is a key to the remarkable flexibility of enteric bacteria in surviving frequent, rapid, and extreme changes in their natural environments.
ACKNOWLEDGMENTS
We thank Andrea Muffler for preparing several figures. Part of this study was done in the laboratories of W. Boos, whose support is gratefully acknowledged.
Financial support was provided by the Deutsche Forschungsgemeinschaft (Schwerpunkt-Programm “Regulatory Networks in Bacteria,” He-1556/5) and by the Fonds der Chemischen Industrie (both to R.H.-A.).
REFERENCES
- 1.Bachmann B J. Pedigrees of some mutant strains of Escherichia coli K-12. Bacteriol Rev. 1972;36:525–557. doi: 10.1128/br.36.4.525-557.1972. [DOI] [PMC free article] [PubMed] [Google Scholar]
- 2.Epstein W, Naono S, Gros F. Synthesis of enzymes of the lactose operon during diauxic growth of Escherichia coli. Biochem Biophys Res Commun. 1996;24:588–592. doi: 10.1016/0006-291x(66)90362-7. [DOI] [PubMed] [Google Scholar]
- 3.Hengge-Aronis R. Back to log phase: ςS as a global regulator in the osmotic control of gene expression in Escherichia coli. Mol Microbiol. 1996;21:887–893. doi: 10.1046/j.1365-2958.1996.511405.x. [DOI] [PubMed] [Google Scholar]
- 4.Hengge-Aronis R. Regulation of gene expression during entry into stationary phase. In: Neidhardt F C, Curtiss III R, Ingraham J L, Lin E C C, Low K B, Magasanik B, Reznikoff W S, Riley M, Schaechter M, Umbarger H E, editors. Escherichia coli and Salmonella: cellular and molecular biology. Washington D.C: American Society for Microbiology; 1996. pp. 1497–1512. [Google Scholar]
- 4a.Henneberg, N., and R. Hengge-Aronis. Unpublished data.
- 5.Inada T, Kimata K, Aiba H. Mechanism responsible for glucose-lactose diauxie in Escherichia coli: challenge to the cAMP model. Genes Cells. 1996;1:293–301. doi: 10.1046/j.1365-2443.1996.24025.x. [DOI] [PubMed] [Google Scholar]
- 6.Jishage M, Ishihama A. Variation in RNA polymerase sigma subunit composition within different stocks of Escherichia coli W3110. J Bacteriol. 1997;179:959–963. doi: 10.1128/jb.179.3.959-963.1997. [DOI] [PMC free article] [PubMed] [Google Scholar]
- 7.Kolter R, Siegele D A, Tormo A. The stationary phase of the bacterial life cycle. Annu Rev Microbiol. 1993;47:855–874. doi: 10.1146/annurev.mi.47.100193.004231. [DOI] [PubMed] [Google Scholar]
- 8.Laemmli U K. Cleavage of structural proteins during the assembly of the head of bacteriophage T4. Nature. 1970;227:680–685. doi: 10.1038/227680a0. [DOI] [PubMed] [Google Scholar]
- 9.Lange R, Barth M, Hengge-Aronis R. Complex transcriptional control of the ςS-dependent stationary-phase-induced and osmotically regulated osmY (csi-5) gene suggests novel roles for Lrp, cyclic AMP (cAMP) receptor protein-cAMP complex, and integration host factor in the stationary-phase response of Escherichia coli. J Bacteriol. 1993;175:7910–7917. doi: 10.1128/jb.175.24.7910-7917.1993. [DOI] [PMC free article] [PubMed] [Google Scholar]
- 10.Lange R, Hengge-Aronis R. Identification of a central regulator of stationary-phase gene expression in Escherichia coli. Mol Microbiol. 1991;5:49–59. doi: 10.1111/j.1365-2958.1991.tb01825.x. [DOI] [PubMed] [Google Scholar]
- 11.Lange R, Hengge-Aronis R. The cellular concentration of the ςS subunit of RNA-polymerase in Escherichia coli is controlled at the levels of transcription, translation and protein stability. Genes Dev. 1994;8:1600–1612. doi: 10.1101/gad.8.13.1600. [DOI] [PubMed] [Google Scholar]
- 12.Lange R, Hengge-Aronis R. The nlpD gene is located in an operon with rpoS on the Escherichia coli chromosome and encodes a novel lipoprotein with a potential function in cell wall formation. Mol Microbiol. 1994;13:733–743. doi: 10.1111/j.1365-2958.1994.tb00466.x. [DOI] [PubMed] [Google Scholar]
- 13.Loewen P C, Hengge-Aronis R. The role of the sigma factor ςS (KatF) in bacterial global regulation. Annu Rev Microbiol. 1994;48:53–80. doi: 10.1146/annurev.mi.48.100194.000413. [DOI] [PubMed] [Google Scholar]
- 14.Magasanik B. Glucose effects: inducer exclusion and repression. In: Beckwith J, Zipser D, editors. The lactose operon. Cold Spring Harbor, N.Y: Cold Spring Harbor Laboratory Press; 1970. pp. 189–220. [Google Scholar]
- 15.Miller J H. Experiments in molecular genetics. Cold Spring Harbor, N.Y: Cold Spring Harbor Laboratory Press; 1972. [Google Scholar]
- 16.Monod J. The phenomenon of enzymatic adaptation. Growth. 1947;11:223–289. [Google Scholar]
- 17.Muffler A, Barth M, Marschall C, Hengge-Aronis R. Heat shock regulation of ςS turnover: a role for DnaK and relationship between stress responses mediated by ςS and ς32 in Escherichia coli. J Bacteriol. 1997;179:445–452. doi: 10.1128/jb.179.2.445-452.1997. [DOI] [PMC free article] [PubMed] [Google Scholar]
- 18.Muffler A, Fischer D, Altuvia S, Storz G, Hengge-Aronis R. The response regulator RssB controls stability of the ςS subunit of RNA polymerase in Escherichia coli. EMBO J. 1996;15:1333–1339. [PMC free article] [PubMed] [Google Scholar]
- 19.Neidhardt F C. Proteins induced by anaerobiosis in Escherichia coli. J Bacteriol. 1983;154:336–343. doi: 10.1128/jb.154.1.336-343.1983. [DOI] [PMC free article] [PubMed] [Google Scholar]
- 19a.Neubauer, P. Unpublished data.
- 20.Postma P W, Lengeler J W, Jacobson G R. Phosphoenolpyruvate:carbohydrate phosphotransferase systems of bacteria. Microbiol Rev. 1993;57:543–594. doi: 10.1128/mr.57.3.543-594.1993. [DOI] [PMC free article] [PubMed] [Google Scholar]
- 21.Roseman S, Meadow N D. Signal transduction by the bacterial phosphotransferase system. J Biol Chem. 1990;265:2993–2996. [PubMed] [Google Scholar]
- 22.Saier M H., Jr Protein phosphorylation and allosteric control of inducer exclusion and catabolite repression by the bacterial phosphoenolpyruvate:sugar phosphotransferase system. Microbiol Rev. 1989;53:109–120. doi: 10.1128/mr.53.1.109-120.1989. [DOI] [PMC free article] [PubMed] [Google Scholar]
- 23.Sambrook J, Fritsch E F, Maniatis T. Molecular cloning: a laboratory manual. 2nd ed. Cold Spring Harbor, N.Y: Cold Spring Harbor Laboratory Press; 1989. [Google Scholar]
- 24.Takayanagi Y, Tanaka K, Takahashi H. Structure of the 5′ upstream region and the regulation of the rpoS gene of Escherichia coli. Mol Gen Genet. 1994;243:525–531. doi: 10.1007/BF00284200. [DOI] [PubMed] [Google Scholar]
- 25.Teich, A., and P. Neubauer. Unpublished data.


