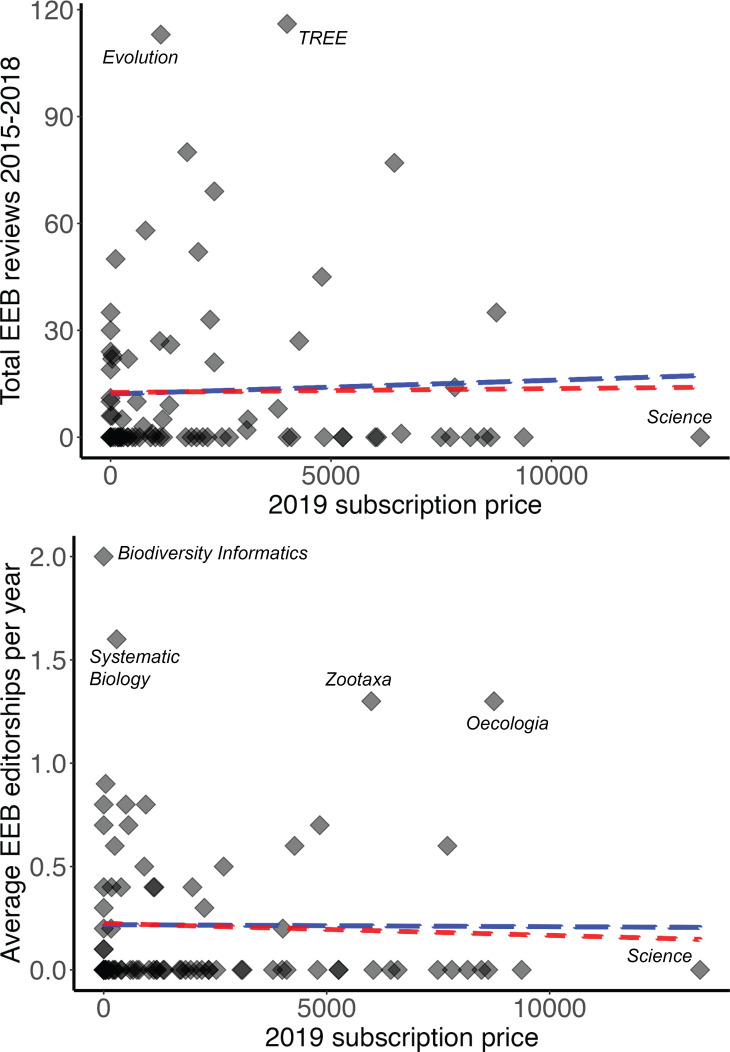
Figure 2. Two metrics of faculty investment in journals (numbers of reviews and editorships), as a function of 2019 subscription price.
Blue trendline shows a simple linear regression including all journals, whereas the red trendline shows the relationship when the outlier journals Science and Nature are excluded from the analysis. Journals falling well away from the main cloud of journals (i.e., additional outliers) are labeled for discussion in the text.

