Abstract
Plasma membrane heterogeneity has been tied to a litany of cellular functions and is often explained by analogy to membrane phase separation, yet models based on phase separation alone fall short of describing the rich organization available within cell membranes. We present comprehensive experimental evidence motivating an updated model of plasma membrane heterogeneity in which membrane domains assemble in response to protein scaffolds. Quantitative super-resolution nanoscopy measurements in live B lymphocytes detect membrane domains that emerge upon clustering B cell receptors (BCR). These domains enrich and retain membrane proteins based on their preference for the liquid-ordered phase. Unlike phase separated membranes that consist of binary phases with defined compositions, membrane composition at BCR clusters is modulated through the protein constituents in clusters or the composition of the membrane overall. This tunable domain structure is detected through the variable sorting of membrane probes and impacts the magnitude of BCR activation.
INTRODUCTION
The impact of phase separation within cells has become appreciated in recent years, largely through visualizations of micron-scale, high-contrast protein- and/or nucleic acid-rich liquid droplets in the cytoplasm and nucleus1,2. Analogous phase separation has long been proposed as an organizing principle in cell membranes, especially within the plasma membrane, where such domains are often referred to as “lipid rafts”3,4. Membrane domains are associated with all facets of plasma membrane function, including trafficking, polarization, sensing, and transport5. The evidence for a role for lipid rafts in immune receptor signaling is particularly abundant, strong, and longstanding, with past work implicating domains in the initial activation of receptors and the modulation of signaling responses6-9. Prominent early work proposes that clustered receptors translocate into pre-existing rafts10-12, sequestering them from downregulating phosphatases while recruiting activating kinases.
While phase separation is often invoked when describing raft-mediated heterogeneity in cells, it is clear that plasma membrane assemblies are not straightforward phase separated domains13, leaving open questions about the nature and properties of these structures. This disconnect has prevented a mechanistic understanding of how membrane heterogeneity contributes to cellular functions. Here, we directly test if and how lipid phase separation translates to living cell membranes using single molecule fluorescence localization microscopy in live B cells. Our methods are sensitive and quantitative, exploiting the nanoscale signaling platforms that assemble following B cell receptor (BCR) activation to template long lived membrane domains7,14-17. We demonstrate that the lipid phase preference of a membrane protein anchor is a quantitative determinant of its local concentration and dynamics within BCR signaling platforms. Our findings support a novel framework of membrane domains in cells, one in which domains assemble at protein scaffolds to tune functional interactions between membrane components.
RESULTS
BCR clusters stabilize domains at the plasma membrane
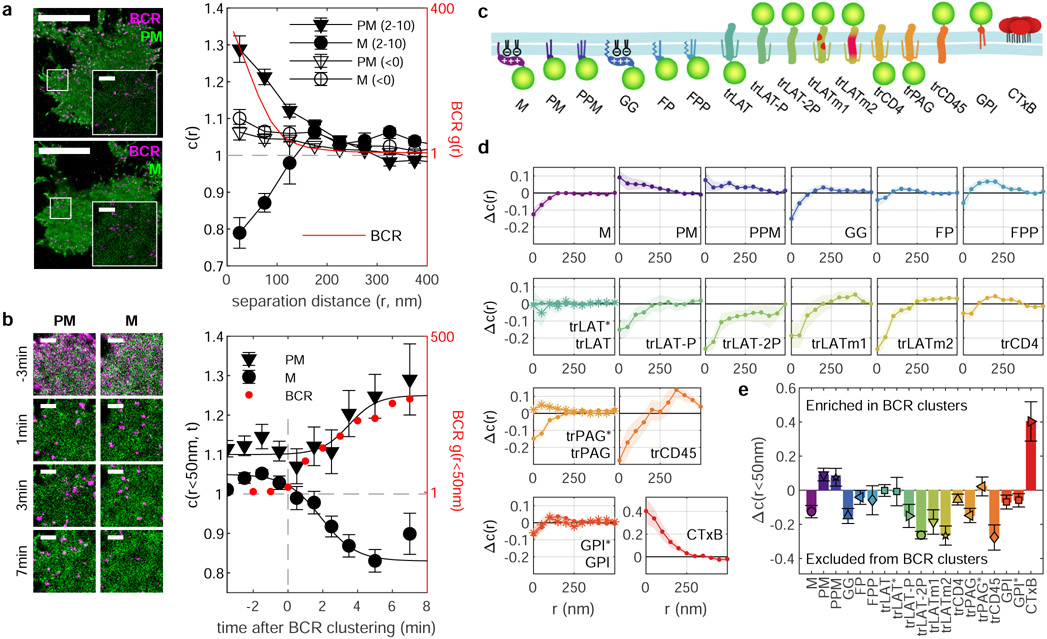
Figure 1a shows CH27 B cells expressing the fluorophore mEos3.2 anchored to the plasma membrane via similar yet biophysically distinct lipidated peptide motifs, both derived from Src family kinases that anchor to the inner leaflet of the plasma membrane. One motif contains myristoyl and palmitoyl groups (PM) and the second contains a myristoyl modification and a polybasic sequence (M). These probes are imaged in live cells alongside BCR labeled with an antibody fragment (Fab) against the μ subunit of IgM BCR that is both biotinylated and fluorescently tagged with an organic fluorophore (silicon rhodamine, SiR). These probes are imaged in cells under conditions where individual molecules can be localized, and images are reconstructed as two dimensional (2D) histograms of localized positions acquired over time. BCR crosslinking with multivalent streptavidin organizes receptors into tight clusters7. In Fig. 1a, images are reconstructed from localizations detected between 2 and 10 min after streptavidin addition, showing BCR puncta and relatively uniform distributions of both PM and M anchors. Although time-averaged reconstructed images appear well resolved, both single molecules and BCR puncta are dynamic. Supplementary Movies 1-6 show single molecule motions and the evolution of BCR clusters over time.
Figure 1: BCR clustering produces membrane domains that differently sort plasma membrane-anchored fluorescent proteins.
a, Reconstructed live-cell super-resolution images of CH27 B cells imaged between 2 and 10 min after BCR clustering and quantification through the spatial-temporal cross-correlation function c(r,τ) extrapolated to τ=0 both before (<0) and after (2-10) BCR clustering for the same single cells. Values of c(r)=1 indicate a random co-distribution, c(r)>1 indicate co-clustering, and c(r)<1 indicate exclusion. Error bars represent uncertainty in extrapolating to τ=0 in single cells. The BCR autocorrelation (g(r)) is shown (red) on a different scale (right axis) evaluated over the same time-period. Here, τ=0.5s is shown to reduce the impact of multiple localizations of the same fluorophore (described in Extended Data Fig. 1) b, Images of the region of interest from a reconstructed from 2min of acquired data centered at the time indicated. Anchor partitioning over time is quantified using the amplitude of cross-correlations (c(r<50nm)) averaged over n=6 cells for each anchor and error-bars represent the SEM. The amplitude of BCR autocorrelations (red points) shows the evolution of BCR clustering averaged over all n=12 cells. Lines are drawn to guide the eye and are not a fit to any theory. Points for individual cells are provided in Supplementary Fig. 2. Scale-bars are 10μm in a and are 1μm in a insets and b. c, Schematic representation of anchors used in this study. d, Traces showing the change in c(r) between anchors and BCR between 2 and 10 min after BCR clustering and the curve obtained for times before BCR clustering (Δc(r)). Error bounds indicated by the shaded region represent the SEM over at least n=5 cells. Representative images of cells are shown in Extended Data Fig. 2 and curves for c(r) before and after clustering are shown in Extended Data Fig. 3. e, Summary of Δc(r) for separation distances less than 50nm redrawn from d. In d and e, * symbols and anchor labels ending in * indicate that values are from experiments where BCR was clustered in the presence of 5μM PP2. Cell numbers interrogated for each anchor and distributions of c(r<50nm) and Δc(r<50nm) are shown in Supplementary Fig. 3.
We quantify the co-localization of anchors with BCR using spatio-temporal cross-correlation functions18. Spatial cross-correlation functions, c(r), report the average density of anchors as a function of distance, r, from the average labeled BCR and are normalized to the average density of anchors in the membrane overall. In order to accurately report on the co-localization of mobile components, we restrict our analysis to pairs of molecules observed at short separation-times,τ, even though our datasets include localizations acquired over extended time-periods (minutes) to improve signal to noise. This approach allows us to detect subtle domain organization that persists for tens of ms or longer. Our analysis is robust to fluorophore bleed-through, complex regions of interest, and extended spatial gradients in label density19, as detailed in Materials and Methods, Supplementary Note 1, and Supplementary Figure 1. Past work has applied this and related analyses to a range of experimental and simulated controls17-20.
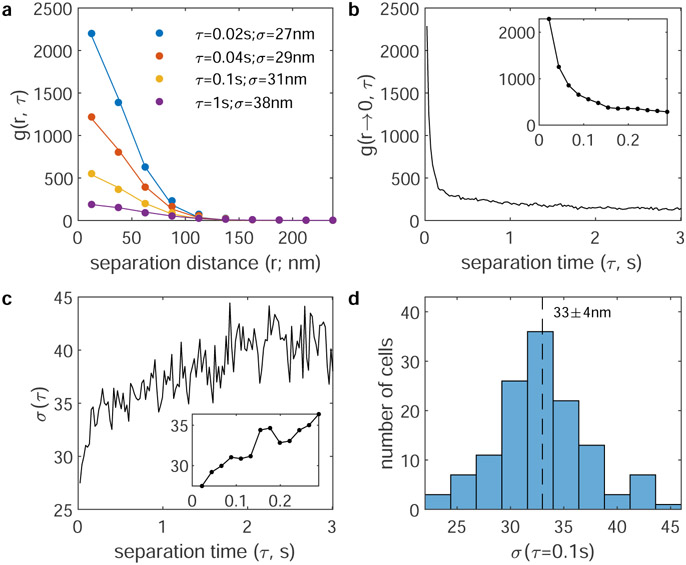
Figure 1a also presents c(r) curves that quantify the partitioning of PM and M anchors with respect to clustered BCR for localizations acquired between 2 and 10 min after BCR clustering. The value of c(r) for distances less than 50nm, c(r<50nm), is 1.28±0.04 for the PM anchor, indicating that the local density of PM within 50nm of the average BCR is 28% greater than the overall density of PM in the membrane. The inverse behavior is observed for the M anchor, with c(r<50nm) = 0.79±0.04 indicating that M is 21% depleted within 50nm of the average BCR. In both cases c(r) curves decay to 1 beyond a separation distance of 200nm, indicating that changes in probe density are local to BCR clusters. The average size and density of BCR clusters can be estimated using the auto-correlation, g(r), of BCR localizations (Figure 1a and Extended Data Figure 1). We find that IgM BCR clusters have radii of 33±4nm, which is somewhat smaller than is reported in past studies (60-100nm) that use different methods to quantify cluster size21,22. Cross-correlations of BCR with anchors extend to longer separation distances than correlations observed for BCR alone, indicating that the enrichment or depletion of anchors extends beyond the limits of the BCR clusters themselves. Figure 1a also includes separate c(r) curves from localizations acquired prior to crosslinking BCR that show modest colocalization between BCR and both anchors.
Figure 1b shows how anchor colocalization with BCR evolves over time by constructing images and c(r) from localizations acquired within 2 min windows. Only the first spatial bin of c(r) is shown corresponding to the relative density of anchors within 50nm of BCR. Results are averaged over multiple cells to improve signal to noise (Supplementary Figure 2). Modest colocalization between BCR and anchors converts to clear differential sorting on the same timescale as receptors assemble into tight puncta after the addition of streptavidin. This indicates that BCR clusters differentially sort probes that vary only by the structure of their membrane anchors and that this domain structure is induced by BCR clustering.
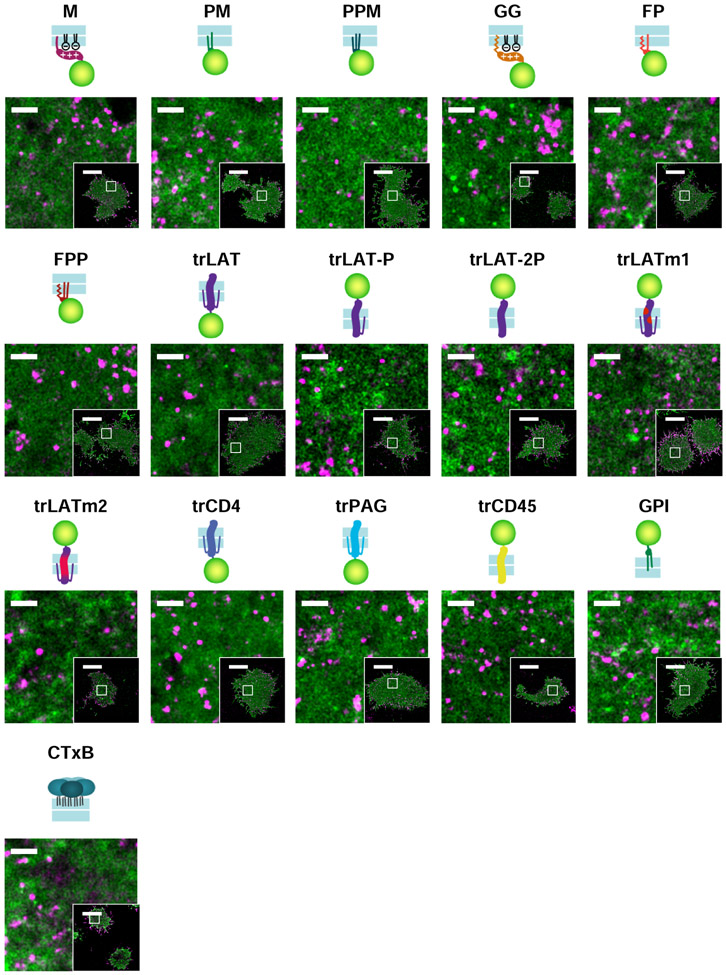
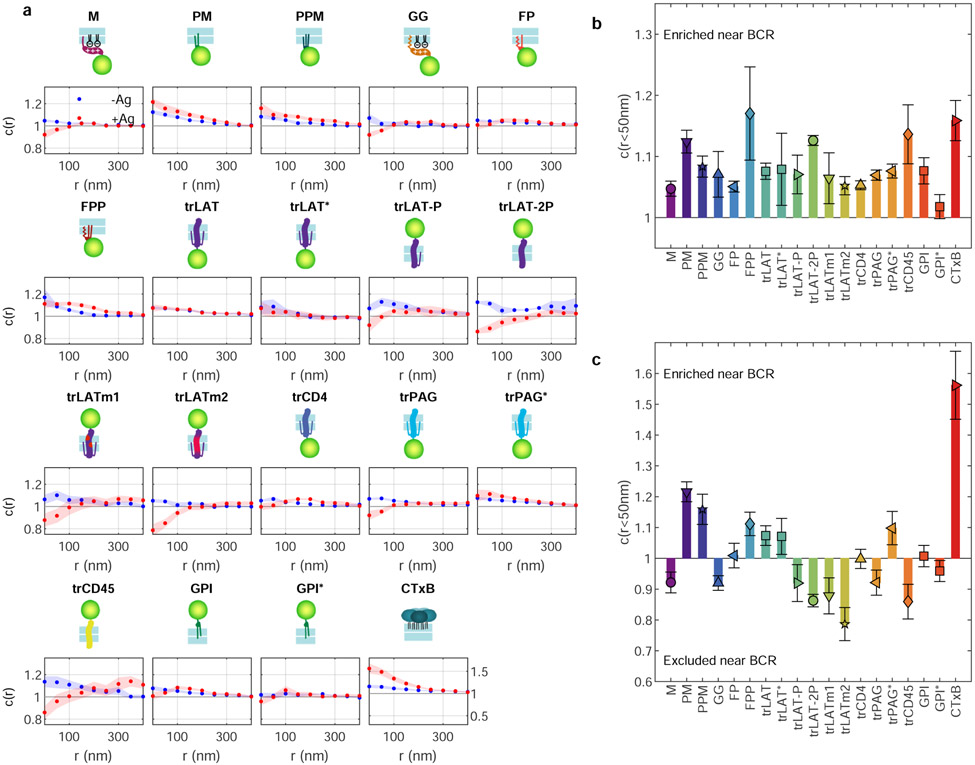
We extended these analyses to 16 plasma membrane probes representing different modes of membrane anchorage, schematically represented in Figure 1c. Sequences are included in Supplementary Table 1 and representative reconstructed images are in Extended Data Figure 2. Many of these probes are truncated anchors from endogenous proteins, others are engineered constructs, and all were imaged alongside labeled BCR both before and after BCR clustering in live CH27 B cells. As in Fig. 1a,b, we observe modest colocalization between unclustered BCR and anchors to varying degrees for all cells and anchors (Extended Data Figure 3), therefore we attribute a general effect unrelated to anchor BCR interactions, such as non-planar membrane topography23. In subsequent analysis, we report the change in c(r) induced by BCR clustering and cellular activation, Δc(r).
This panel of anchors exhibits diverse localization behavior as summarized by the Δc(r) curves of Fig. 1d. The magnitude of Δc(r) at the smallest separation distances (r<50nm; Fig. 1e) is a quantitative measure of anchor partitioning into the BCR-cluster-proximal membrane domain. Importantly, we find that the expression of anchor constructs does not significantly impact the size or density of streptavidin-induced BCR clusters, nor the magnitude of BCR activation as measured by specific labeling of the BCR CD79A subunit phosphorylated at Tyr182 (Supplementary Figures 4-5). We also find that the magnitude of Δc(r<50nm) does not correlate with BCR cluster properties, with the exeption of GPI whose enrichment correlates with BCR cluster density (Supplementary Figure 6).
For trLAT, trPAG and GPI, results are included for cells treated with the Src family kinase inhibitor PP2 prior to BCR clustering to inhibit BCR activation and signaling. While PP2 pre-treatment has little effect on trLAT and GPI distributions, trPAG distributions change significantly. trPAG is robustly excluded from BCR clusters in untreated cells and enriched in BCR clusters with PP2 treatment. Further investigation revealed that trPAG localizes with adhesive structures marked by Focal Adhesion Kinase after BCR clustering, likely via signaling-dependent protein interactions within the PAG transmembrane domain (Extended Data Figure 4).
Concentration at BCR clusters is given by phase partitioning
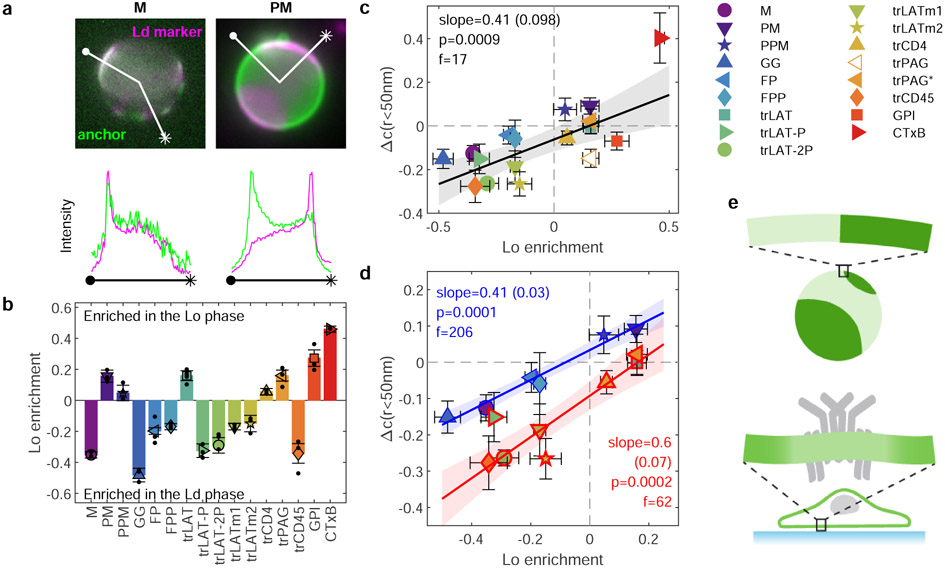
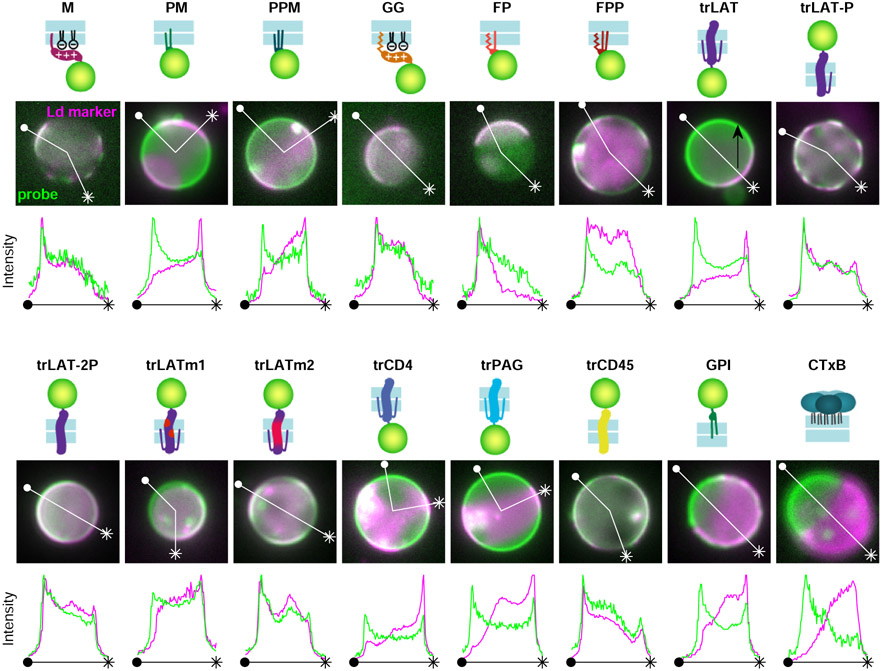
The anchors depicted in Fig. 1c also exhibit diverse partitioning behavior in isolated giant plasma membrane vesicles (GPMVs) with coexisting liquid-ordered (Lo) and liquid-disordered (Ld) phases (Figure 2a). To quantify this effect, GPMVs were prepared from RBL-2H3 or HEK cells expressing anchors under conditions shown previously to preserve protein palmitoylation24. GPMVs were imaged using epi-fluorescence microscopy under conditions where vesicles robustly separate into coexisting Lo and Ld phases, visualized by a fluorescent lipid analog with strong preference for the Ld phase. Representative images of isolated GPMVs with M and PM anchors are shown in Fig. 2a, and representative images for all anchors are included in Extended Data Figure 5. Phase partitioning is quantified by measuring the background-corrected fluorescence intensity of anchors in the two phases, which is proportional to their concentration. Anchor enrichment in the Lo phase is calculated from line-scans through intensity images of the vesicle mid-plane (as in Fig. 2a) according to: ([Lo]−[Ld])/([Lo]+[Ld]). This quantity is bounded by −1 for an anchor that is exclusively present in the Ld phase and 1 for probes exclusively present in the Lo phase. The trends observed across anchors (Fig. 2b) are in good agreement with past findings24,25 in that palmitoylation is required for enrichment in the Lo phase and bulky transmembrane domains favor enrichment in the Ld phase.
Figure 2: Anchor concentrations near receptor clusters are quantitatively predicted by GPMV partitioning measurements.
a, Fluorescence images of phase separated GPMVs from cells expressing M or PM anchors (green) alongside a fluorescent marker for the Ld phase (DiO or DiI, magenta). Line scans show the fluorescence intensity in both channels along the trajectory shown. Similar images for all anchored probes are shown in Extended Data Fig. 5. b, Quantification of the Lo phase enrichment of anchors. Error bars show average and SEM over 3 experiments where 10 vesicles were quantified. c, Changes in the magnitude of co-localization between anchors and BCR upon clustering in cells (Δc(r<50nm) mean and SEM replotted from Fig. 1e) plotted vs. Lo enrichment in isolated GPMVs (mean and SEM replotted from b). Values of 0 on either axis represent equal partitioning with respect to domains. d, A subset of the means and SEMs replotted from c, separated by anchor class with peripheral anchors at the inner leaflet outlined in blue and transmembrane peptides outlined in red. Trends in c, d are fit to a linear model and the significance is assessed with a p-value of the two-sized hypothesis test against their being no correlation (lower values indicate greater significance), and an f-statistic that reports how well the variance in the data is described by the linear fit (higher values indicate greater significance). No adjustments were made for multiple comparisons. Shaded regions in c,d indicate the 95% confidence interval of the linear fit. trPAG* Δc(r) in c,d are from cells treated with 5μM PP2 and the point corresponding to trPAG (open symbol) is excluded from the linear model in c and not plotted in d. The slope of the line quantifies how anchor partitioning at BCR clusters compares to partitioning to Lo domains in GPMVs. Slopes less than 1 indicate that cellular domains have less compositional contrast than domains in vesicles. e, Schematic showing reduced contrast for BCR clusters in cells compared to phase separated domains in GPMVs.
Figure 2c directly compares anchor partitioning near BCR clusters in live B cells (Δc(r<50nm); replotted from Fig. 1e) with Lo enrichment of anchors in isolated GPMVs (replotted from Fig. 2b). There is a robust, statistically significant correlation between anchor partitioning in these two contexts when all anchors are considered together (p=0.0009; Fig. 2c). The scatter of the points around the linear trend is larger than expected given the error bounds of individual measurements, indicating that anchor properties besides Lo phase enrichment contribute to anchor co-localization with BCR clusters. Of note, both GPI and trPAG partition with the Lo phase in GPMVs and are excluded from BCR clusters in cells. For the case of trPAG, pre-treating cells with PP2 (trPAG*) brings BCR partitioning in line with the linear trend (Extended Data Fig. 4). For the case of GPI, we detect significant correlations between BCR partitioning and BCR cluster density, suggesting specific interactions between this anchor and membrane components (Supplementary Fig. 6). Similar plots showing probe enrichment in cells with unclustered or clustered BCR are included in Extended Data Figure 6.
Considering points corresponding to peripheral anchors and transmembrane anchors separately increases the significance of the linear model substantially (Fig. 2d). Grouping points according to anchor class also brings experimental errors in line with the scatter of points around the linear trend, indicating that Lo phase partitioning in GPMVs is sufficient to explain the observed enrichment in BCR clusters (or vice versa) within anchor classes. The linear model describing inner leaflet peripheral anchors passes close to the point (0, 0), indicating that peripheral probes that partition equally between phases in GPMVs also show no preference for BCR clusters. The linear model describing transmembrane peptides is systematically shifted to lower values across the whole range of GPMV Lo enrichment, indicating that transmembrane anchors experience a repulsive force from BCR clusters beyond that experienced by peripheral anchors.
This linear relationship between partitioning results in isolated vesicles and living cells over a broad range of anchor motifs provides clear evidence that phase separation is an organizing principle underlying membrane protein sorting at BCR clusters. The strength of this effect is different in these two systems; cellular domains have less compositional contrast than phase separated domains in vesicles, as shown schematically in Fig. 2e. Reduced contrast means that the membrane domain defined by the BCR cluster is more similar to the composition of the membrane overall than a Lo domain is similar to the composition of the GPMV overall. This is reflected by the observation that the slopes of the lines in Fig. 2d are less than 1. These slopes are both close to 0.5, indicating that the magnitude of probe enrichment or depletion at BCR clusters is close to half that of Lo domains in GPMVs. We note that this value modestly underestimates the true contrast at the center of BCR clusters because the size of BCR clusters is close to the spatial resolution of the measurement (Supplementary Figure 7).
The observation of weaker partitioning in cells than vesicles is not easily explained based on past work in phase separated GPMVs, where anchor partitioning is resistant to changes in temperature or composition26. In contrast, past work reports weaker partitioning when domains are induced in otherwise uniform membrane vesicles through local perturbations of membrane structure27, leading us to speculate that domains at BCR clusters more closely resemble induced rather than phase separated domains in model membranes. One property of induced domains in vesicles is that their composition depends both on the magnitude of the perturbation and on the proximity of the membrane to the phase transition27. This led us to hypothesize that the contrast of the ordered membrane domain at BCR clusters is sensitive to the protein composition of clusters and the thermodynamic state of the membrane.
Tuning contrast at BCR clusters modulates BCR function
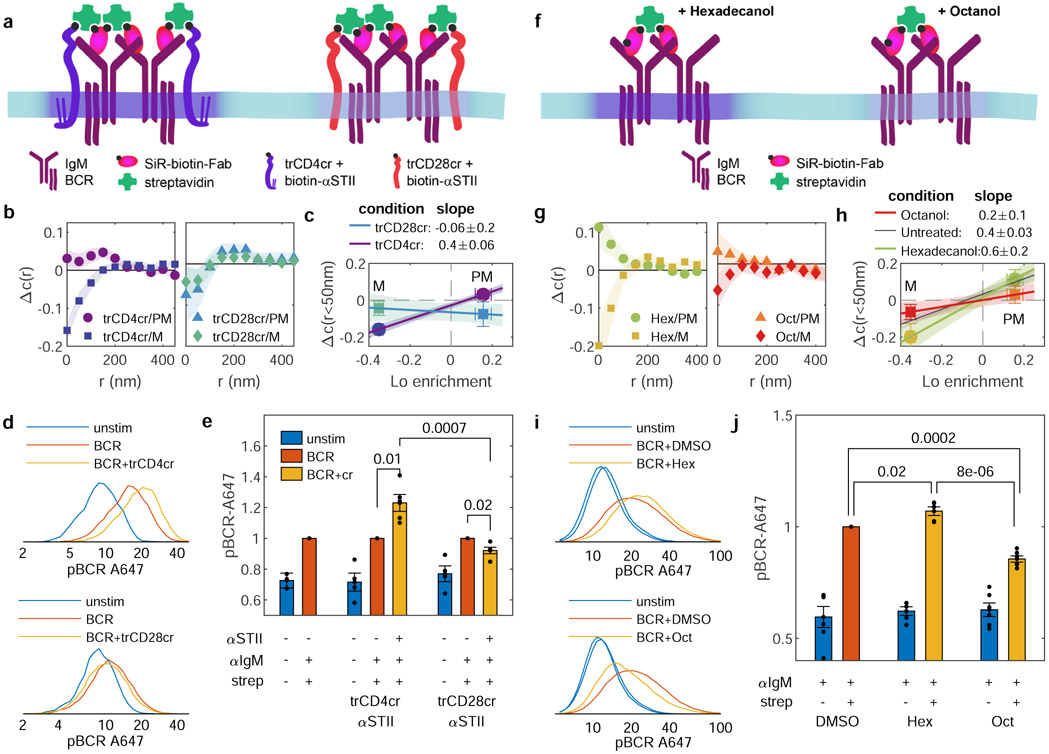
We next explored the hypothesis that the contrast of the membrane domain at BCR clusters is sensitive to the protein composition of clusters and the thermodynamic state of the membrane. Our first strategy was to incorporate additional components that either favor or oppose formation of ordered membrane domains. To accomplish this, BCR was co-ligated with one of two engineered minimal co-receptors stably expressed at the plasma membrane of CH27 cells, illustrated schematically in Figure 3a. One minimal co-receptor has the palmitoylated transmembrane domain of CD4, which incorporates into the Lo phase in GPMVs (trCD4cr, Lo enrichment is 0.06±0.02; Fig. 2b), while the second has the transmembrane domain of CD28, which lacks palmitoylation sites and is robustly excluded from the Lo phase in GPMVs (trCD28cr, Lo enrichment is −0.32±0.04, Supplementary Fig. 8). Both minimal co-receptors are truncated variants of chimeric antigen receptors that lack intracellular signaling domains and contain an extracellular Strep-tagII (STII) epitope tag used to co-ligate with IgM BCR using biotinylated anti-STII and anti-IgMμ antibodies, as described in Methods and Supplementary Table 2. Labeled BCR and transduced co-receptors assemble into tight puncta upon addition of streptavidin (Supplementary Figure 9). The partitioning of components with respect to these puncta was assayed using PM and M, anchors that sort strongly with the Lo and Ld phase, respectively. Δc(r) curves for BCR clusters co-ligated with trCD4cr indicate differential sorting of PM and M (Fig. 3b). While these curves are qualitatively similar to measurements without minimal co-receptors (Fig. 1d), differences in stimulation conditions prevent a direct quantitative comparison. Here, a smaller fraction of IgM BCRs are labeled with SiR-biotin-Fab αlgMμ than for BCR clustering in untransduced cells (Fig. 1) to ensure incorporation of co-receptors into BCR clusters. BCR clusters that incorporate co-receptors are slightly larger and are present at slightly lower density than BCR-only clusters (Supplementary Figure 11). In contrast to trCD4cr, Δc(r) curves for BCR-trCD28cr co-clustering indicate exclusion of both PM and M to a similar extent (Fig. 3b). Findings are summarized in Fig. 3c, which plots the partitioning of PM and M at co-clusters (Δc(r<50nm)) against the Lo enrichment of these same anchors in GPMVs. The slope of each line connecting measured points reflects the contrast of domains at BCR-co-receptor co-clusters relative to contrast in phase separated GPMVs. The differences in the slopes for BCR-trCD28cr vs. BCR-trCD4cr co-clusters indicate that these co-receptors can tune the membrane domain contrast at BCR clusters, with incorporation of Lo-preferring trCD4cr enforcing higher contrast than trCD28cr.
Figure 3: BCR phosphorylation is modulated by perturbations of domain contrast.
a, Schematic summary of approach using minimal co-receptors to modulate membrane domain contrast. b, Δc(r) between BCR and either PM or M anchors where BCR is co-ligated with minimal co-receptors trCD4cr or trCD28cr. Error bounds indicated by the shaded region represent the SEM over at least 5 cells. Cell numbers and the distribution of c(r<50nm) and Δc(r<50nm) for individual conditions are in Supplementary Fig. 10. c, Co-ligation induced change in M or PM probe sorting with respect to BCR (mean and SEM of Δc(r<50nm) replotted from b plotted vs. Lo enrichment of M or PM in isolated GPMVs (means and SEM replotted from Fig. 2b). The slope of the line connecting these points reports the extent to which sorting in cells quantitatively compares to sorting in phase separated vesicles. Shaded regions calculated by propagating SEMs of measured points onto the line connecting the means. d, Representative histograms from a single flow cytometry measurement of pBCR staining with antibodies against Tyr182 of the CD79A subunit of BCR (log axis scale) over a population of cells expressing trCD4cr or trCD28cr for cells fixed and stained before (unstim) or after either BCR clustering (BCR) or co-ligation of BCR and minimal co-receptors. e, Mean and SEM pBCR levels of minimal co-receptor co-ligation with BCR (+STII +strep) normalized to the BCR cross-linking condition for untransduced, trCD4cr-expressing, and trCD28cr-expressing cells (−STII +strep) for n=4 experiments. p-values for cells expressing the same minimal co-receptor come from a single-tail t-test of normalized responses, while a 2-tailed t-test was used to compare normalized responses in cells expressing different minimal co-receptors. f, Schematic summary of approach using n-alcohols to modulate membrane domain contrast. g-j, Results of imaging (g,h) and flow cytometry (i,j) experiments conducted in parallel with experiments described in b-e, where untransduced cells were pre-treated with either hexadecanol or octanol before BCR crosslinking. In j, p-values comparing n=6 experiments each of cells treated with alcohols come from a single-tail t-test of normalized responses, while a 2-tailed t-test was used to compare normalized responses in experiments with different n-alcohols.
Regulatory proteins responsible for phosphorylation and dephosphorylation of BCR on its activation motifs, such as Lyn kinase and CD45 phosphatase, are anchored to the membrane via motifs sorted by BCR clusters according to their Lo preference (PM and trCD45 in Fig. 2d), suggesting a mechanism where ordered domains can tune kinase/phosphatase concentrations to favor receptor phosphorylation17,28. By extension, conditions that reduce membrane domain contrast would also reduce BCR phosphorylation. To test this prediction, BCR phosphorylation (pBCR) was assayed by flow cytometry. CH27 cells stably expressing either trCD4cr or trCD28cr were stimulated in suspension through co-ligation of minimal co-receptors with IgM BCR using biotinylated antibodies against STII and IgMμ, respectively, similar to co-clustering in imaging experiments. Cells were then chemically fixed, permeabilized, and phosphorylation at Tyr182 of the CD79A subunit of BCR was detected using phospho-Tyr182-specific antibodies. Consistent with our hypothesis, pBCR staining was enhanced by BCR co-ligation with trCD4cr as compared to trCD28cr (Fig. 3d,e). We also see significant differences in pBCR stimulated by BCR-co-receptor co-ligation vs. BCR clustering alone using equivalent BCR labeling conditions in the same co-receptor expressing cells.
Our second strategy to modulate the contrast of BCR clusters was through chemical agents that either enhance or suppress membrane phase separation, shown schematically in Fig. 3f. To that end, we incubated cells with either octanol or hexadecanol, hydrophobic n-alcohols shown previously to lower or raise miscibility transition temperatures in isolated GPMVs29. The specific concentrations used have an equal and opposite impact on membrane phase transition temperatures in GPMVs. Hexadecanol stabilizes domains (raising transition temperatures) and octanol destabilizes domains (lowering transition temperatures). Δc(r) curves between BCR and anchors show that hexadecanol treatment results in BCR clusters that more effectively sort PM and M anchors indicating a higher contrast ordered domain, while octanol treatment results in BCR clusters that only weakly sort these anchors (Fig. 3g) indicating a lower contrast ordered domain. We did not observe significant differences in BCR cluster size or density in treated vs. untreated cells (Supplementary Figure 11). Except for the presence of DMSO, the same BCR labeling and stimulation conditions are used here as experiments shown in Fig. 1,2, allowing for direct comparison with these results, but not results with minimal co-receptors in Fig 3b,c. Results are summarized by comparing partitioning at BCR clusters and Lo domains in GPMVs, where it is found that hexadecanol enhances and octanol reduces contrast as measured by evaluating the slope connecting the two measured points (Fig. 3h). Flow cytometry measurements of pBCR on cells treated with n-alcohols before BCR clustering indicate that hexadecanol treatment enhances and octanol treatment inhibits phosphorylation of clustered BCR (Fig 3i,j), consistent with our hypothesis that domain contrast tunes the local concentration of regulatory proteins that control BCR phosphorylation.
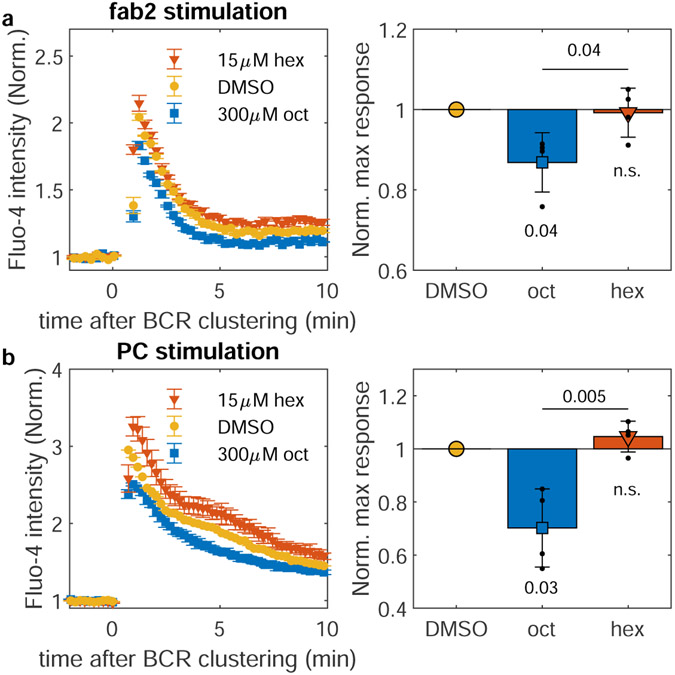
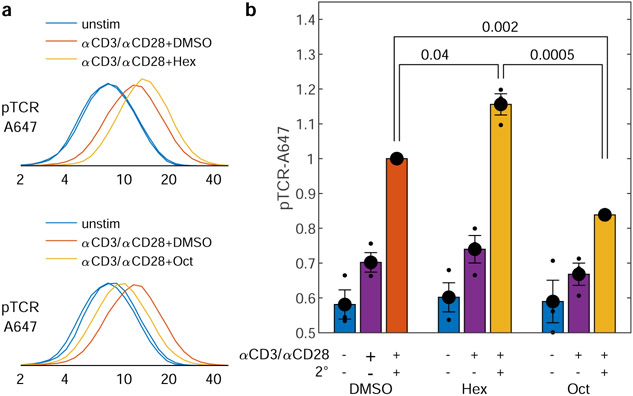
N-alcohol treatment also leads to significant differences in cellular calcium mobilization as measured by the calcium-sensitive dye Fluo-4 (Extended Data Figure 7), indicating that the impact on function at the level of BCR phosphorylation (Fig. 3j) propagates to downstream signaling responses. We also extended our phospho-flow cytometry assay to T cell receptor (TCR) phosphorylation upon CD3/CD28 co-stimulation in Jurkat T cells. Initial TCR activation is determined by a similar kinase-phosphatase balance involving Lck, which is anchored with a PPM motif instead of the PM anchor of Lyn kinase. n-alcohol treatment leads to modulation of TCR phosphorylation similar to its effects on BCR (Extended Data Figure 8), suggesting that variable domain partitioning is a general functional mechanism that spans cell types and signaling systems, in agreement with past studies that implicate membrane domains in TCR triggering, e.g.30,31.
Phase preference determines changes in anchor mobility
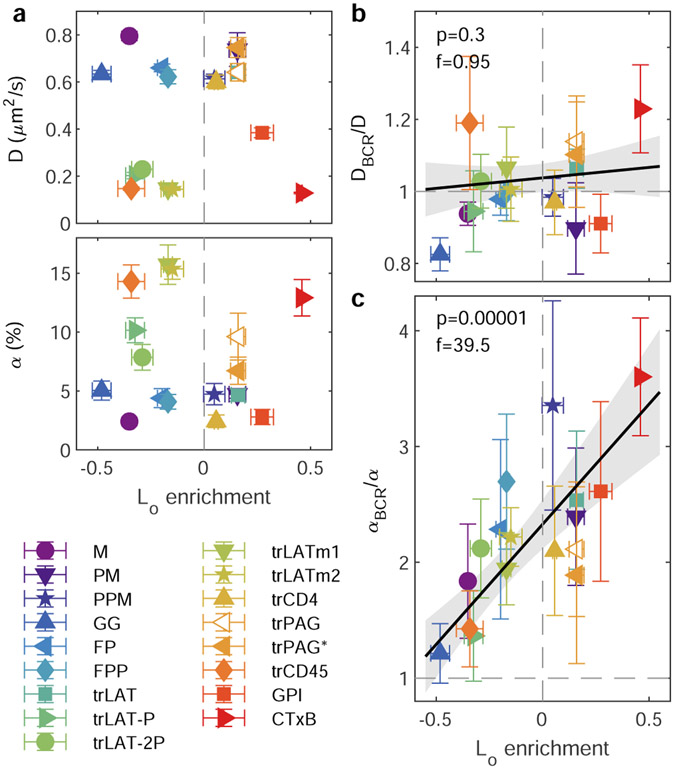
The same fluorescent localizations used to characterize spatial correlations can also be used to quantify anchor mobility, via the temporal evolution of the anchor’s auto-correlation function, g(r, τ). This approach to quantifying diffusion is similar to single particle tracking but enables unambiguous determination of mobility parameters when probes are imaged at the high densities required for robust cross-correlation analysis. We find that g(r) at each τ is minimally described as a superposition of two populations with distinct mean squared displacements (MSDs), and their evolution in τ reveals that one is highly confined and one is more diffusive over a range of time-intervals (15 ≤ τ ≤ 200ms; Supplementary Figure 12). Neither the diffusion coefficient associated with the mobile state (D), nor the percentage of confined molecules (α) trend with Lo enrichment of anchors in GPMVs (Fig. 4a). Anchor diffusion depends most strongly on the position of the fluorescent tag (Extended Data Figure 10), suggesting that differences in the obstacles present on the two faces of the plasma membrane dominate any membrane-mediated effects on absolute anchor mobility. We note that while fluorophore position impacts mobility and surface expression, it does not significantly impact BCR partitioning (Extended Data Figure 9)
Figure 4: Relative anchor mobility is predicted by Lo enrichment.
a, The mobility of anchors imaged 2-10min after BCR clustering is minimally described as a superposition of two populations, one mobile characterized by a diffusion coefficient (D, top), and a second confined, with the fraction of anchors in the confined state characterized by a parameter α (bottom), as described in Methods and Supplementary Figure 14. Mean and SEM of fit parameters for each anchor from same cells as in Fig. 1 are plotted vs. Lo enrichment in GPMVs, with means and SEMs replotted from Fig. 2c. b,c, Ratios of mobility parameters describing the subset of anchors that pass within 100nm of a BCR cluster (DBCR, αBCR) to those describing anchors in the membrane overall (D, α). Points show mean and SEM over ratios taken in the same individual cells used in a. Trends in b,c, are fit to a linear model and the significance is assessed with a p-value of the two-sized hypothesis test against their being no correlation (lower values indicate greater significance), and an f-statistic that reports how well the variance in the data is described by the linear fit (higher values indicate greater significance). Shaded regions indicate the 95% confidence interval of the linear fit. No adjustments were made for multiple comparisons.
To isolate effects on diffusion that arise from the distinct membrane regions around clustered receptors, we quantify the mobility of anchors that pass within 100nm of a clustered BCR, relative to the mobility of all anchors as described in Supplementary Note 1. The diffusion coefficient of the mobile component is not impacted by proximity to BCR clusters (DBCR/D is ~1 for all anchors in Fig. 4b). In contrast, the fraction of probes occupying the confined state is larger for BCR proximal anchors compared to those in the membrane overall (αBCR/α; Fig. 4c) and a highly significant trend is observed when this ratio is considered alongside Lo enrichment measured in GPMVs. The most Lo-enriched anchors are 3-4 times more likely to be confined near a BCR cluster than in the membrane overall, while strongly Ld-enriched anchors are minimally impacted by the presence of a BCR cluster. This trend holds despite the lack of significant correlation between Lo partitioning and either α or αBCR when considered individually (Extended Data Figure 10). This independent analysis provides complementary support for the trend of Fig. 2d, and together they indicate that the ordered membrane environment around clustered BCR influences not only recruitment but also the retention of specific membrane components.
DISCUSSION
Clustering the BCR leads to assembly of a signaling platform with a distinct protein and lipid composition, establishing a local environment that facilitates functional interactions between signaling proteins. These signaling platforms are held together by signaling and scaffolding proteins, but also exhibit distinct local membrane environments that influence downstream signaling responses. While extensive studies have linked BCR signaling to biochemically defined “lipid rafts”, the lack of a structural correlate or mechanistic basis in intact cells impedes a corresponding predictive model of the immune response.
Here, we report that a membrane domain emerges upon BCR clustering in which membrane-mediated interactions are sufficient to alter composition proximal to BCR (Fig. 1). A role for phase separation arises examination of a diverse panel of membrane anchoring motifs using quantitative methods that directly measure protein concentration in parallel but independent experiments in live cells and in phase-separated isolated membranes. We observe remarkable agreement between probe enrichment in BCR clusters and Lo preference in isolated GPMVs (Fig. 2), fully consistent with past implications7,14-17 that BCR signaling platforms are extended ordered domains. While BCR membrane domains are related to Lo phases in vesicles, their contrast is variable and integrates both the nature of the stimulus and thermodynamics of the membrane, providing a mechanism to produce a tunable response (Fig. 3). Our methods also report on probe dynamics, and we find that phase preference predicts the local mobility of anchors at BCR clusters (Fig. 4). The convergence between live cell and equilibrated vesicle measurements directly and conclusively establishes phase separation as a functional organizing principle in cell plasma membranes.
Our observations, combined with other recent studies17,31-34, put to rest the long-running debate regarding the existence of ordered membrane domains, often referred to as ‘lipid rafts’, in cells. Our findings clearly demonstrate that ordered domains can and do exist in intact cells, that they can emerge in response to stimuli (Fig. 1), and that their presence impacts the concentration, dynamics, and function of membrane proteins (Figs. 2-4). At the same time, these domains differ in important ways from phase separated domains in vesicles: they have tunable contrast, and are dependent on the assembly of scaffolding proteins. Both observations are consistent with a plasma membrane best described as a single thermodynamic phase, but poised to readily reorganize in response to imposed structure.
Analogous observations of domain formation in response to external stimuli have been reported in model membranes. Extended phase-selective domains form when proteins or lipids are clustered through adhesion27 or when membranes are coupled to protein complexes35, cytoskeletal scaffolds36, or phase separated protein droplets37. These past results indicate that single phase model membranes near macroscopic Lo-Ld phase transitions are highly susceptible to perturbations that organize components with specific phase preferences. The results of the current study reinforce that the same principle extends to living cell membranes.
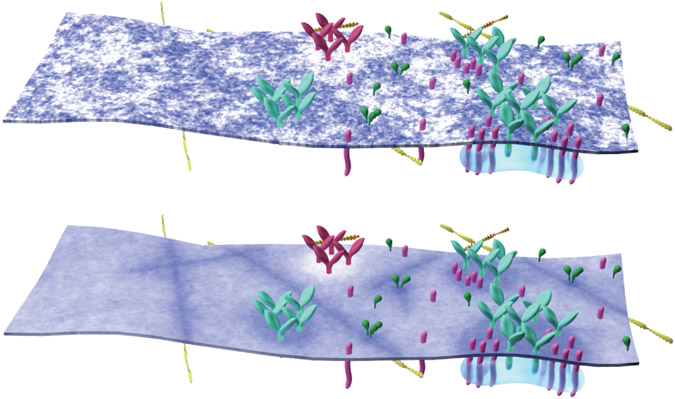
We propose that the marginal loss of contrast inherent to tuning away from macroscopic phase separation is functionally outweighed by the adaptability the membrane acquires in this unique physical state. Near, but not at, phase separation, extended domains capable of sorting components based on their phase preferences can assemble or disassemble locally in response to external stimuli without global changes in the thermodynamic parameters of the membrane (Fig. 5). In this framework, the contrast of the stabilized domain is dictated both by the phase preference of the domain-scaffolding elements, and by the proximity of the membrane to its phase transition. Membrane domains in cells are frequently described as small, dynamic, and difficult to visualize5 and the physical mechanisms underlying their formation remain an area of active debate in model and cell membranes alike13. Nonetheless, small, dynamic structure is detected in both cells and isolated plasma membranes at or near cell growth temperature38-42. One possibility is that protein scaffolds recruit and retain pre-existing but dynamic fluctuations or nanodomains to different extents, converting binary nanoscale structures to domains with variable contrast when membrane composition is averaged over time (Fig. 5, top vs. bottom).
Figure 5: A model for adaptive membrane organization.
Nanoscale membrane domains preferentially assemble at protein scaffolds to establish functional compartments in the plasma membrane. (top) Instantaneous snapshot of a heterogeneous membrane containing protein structures of increasing complexity, including cortical actin, clustered receptors, adaptor proteins, and membrane proximal signaling assemblies. This membrane contains numerous domains of different sizes and shapes, some of which surround protein rich structures. (bottom) The same membrane drawn above but now membrane composition is averaged over time to show continuous areas of altered local concentration, demonstrating how nanoscale structure can give rise to distinct local membrane environments and define membrane compartments. This is a representation of one specific physical model of membrane heterogeneity (see methods and Supplementary Fig 13) but we expect this effect to be general across models.
In this study, we observe changes in domain contrast when we incorporate minimal “co-receptors” into BCR clusters or treat cells with compounds that alter membrane transition temperatures. These changes in contrast have a clear functional consequence on the extent of BCR phosphorylation. Our results suggest a mechanistic interpretation of past studies of BCR signaling. For example, the co-receptors CD19 and FcγRIIB modulate signaling when co-clustered with BCR, in part through modulating the composition and longevity of biochemically defined rafts43,44. Our current findings suggest that these co-receptors amplify or counteract the ability of BCR to sort signaling effectors based on their phase preference. Past work also documents different levels of raft engagement of BCR clusters during B cell development and maturation45,46. Changes in global membrane composition during development may alter the thermodynamic stability of domains, providing a mechanism to alter the contrast of membrane domains at BCR clusters. Membrane composition is also acutely altered as a consequence of early signaling events, for example through loss of lipid asymmetry47 or enzymatic conversion between lipid species48 and these too could feed back onto the thermodynamic stability of membrane domains.
To conclude, we propose a refinement of the traditional picture of rafts as stable, pre-existing domains that can grow or coalesce in response to stimuli. Instead, we envision membrane phases acting as an adaptive solvent that is highly susceptible to forces acting in and on membranes. This solvent impacts the local concentration and dynamics of proteins within domains, shifting the balance of biochemical reactions and their resulting membrane-mediated functions. These domains are sufficient to sort membrane components based on their phase preference and are sensitive to both external cues and to thermodynamic parameters within the membrane. In this way, the membrane phase transition works in concert with other organizing principles to facilitate and modulate cell function.
METHODS
Constructs
The anchor constructs used in this study were derived from existing anchor-fluorescent protein fusion constructs, with the fluorescent protein sequence replaced by that of mEos 3.2 via standard molecular cloning. Detailed sequence and source 17,24,25,49-53 information for all anchor constructs is provided in Supplementary Table 1. FAK-eGFP plasmid DNA was obtained from the Baird-Holowka lab. Constructs for minimal “co-receptors” trCD4cr and trCD28cr were derived from truncated, fluorescently tagged versions of chimeric antigen receptor (CAR) constructs obtained from the Stanley Riddell Lab and described previously54. Sequence information is provided in Supplementary Table 2. Constructs were cloned in the lentiviral epHIV7 vector55. Lentiviral supernatants were produced in HEK 293T cells transfected with lentiviral vector plasmids along with PAX2 and VSVG packaging plasmids. Viral particles were concentrated via ultracentrifugation before use for transduction.
Preparation of CH27 cell samples for super-resolution imaging
CH27 B-cells (mouse, Millipore Cat# SCC115, RRID:CVCL_7178)56 were acquired from Neetu Gupta (Cleveland Clinic) and maintained in culture as previously described18. Cells were transiently transfected with plasmid DNA encoding membrane anchor constructs by Lonza Nucleofector electroporation (Lonza, Basel, Switzerland) with electroporation program CA-137. Typically, 106 CH27 cells were transfected with 1 μg of plasmid DNA. Cells were then either transferred to glass-bottom Mattek culture dishes (P35G-1.5-10) and incubated overnight, or incubated overnight in flasks and plated on Mattek dishes on the day of sample preparation. CH27 cells stably expressing minimal co-receptors (trCD4cr or trCD28cr) were prepared via viral transduction. Concentrated viral supernatants were mixed at a 1:1 ratio with cell growth media containing 106 cells and 8 μg/ml polybrene (Sigma: TR-1003) in a 6-well plate. Plates were spun for 2500 rpm for 30 min then incubated for 24 hours at 30°C with 5% CO2. After a media exchange, transduced cells were then maintained in cell culture at 37°C as normal.
For imaging experiments involving treatment with alcohols only, transfected cells were plated on Mattek dishes coated with recombinant VCAM-1 for 10-20 min prior to imaging to promote cell adhesion and maintain membrane flatness. VCAM-1 coated dishes were prepared by incubation of oxygen plasma cleaned Mattek dishes with Fcy-specific goat anti-human IgG antibody (Jackson Immunoresearch Cat# 109-005-170, RRID:AB_2810885) in PBS at 100 μg/mL for 30 min at room temperature. Dishes were blocked for 30 min with a 5% BSA solution, then incubated for 1 hour at room temperature with recombinant VCAM-1/human Fc chimeric protein (R&D Systems, Cat# 862-VC-100) at 10 μg/mL, and rinsed thoroughly before use.
Goat anti-mouse IgM(μ) Fab fragments were obtained from Jackson Immunoresearch (Cat# 115-007-020, RRID:AB_2338477) and were conjugated with biotin and silicon rhodamine (SiR) NHS esters (Invitrogen: B1582, Spirochrome: SC003) to produce “SiR-biotin-Fab”. Cholera Toxin subunit B (CTxB) was from Sigma (Sigma: C9903) and was conjugated with Cy3B NHS ester (Cytiva: PA63101) or with both SiR and biotin as with SiR-biotin-Fab. Anti-GFP nanobody used to label FAK-eGFP was from Chromotek (Chromotek: gt-250) and was conjugated to JaneliaFluor 646 through incubation with JF646 NHS ester (gift of Luke Lavis, Janelia Farms). Antibodies, Fab fragments, and CTxB were all labeled via NHS ester chemistry using methods described previously17,19.
BCR was labeled by incubation with 5 μg/ml SiR-biotin-Fab in culture medium for 10 min at room temperature. When Cy3B-CTxB was imaged alongside SiR-biotin-Fab-labeled BCR, Cy3b-CTxB was added to the SiR-biotin-Fab labeling solution at a concentration of 5 μg/ml. For co-ligation of minimal co-receptors with BCR, biotin-labeled mouse monoclonal antibody against the Strep-tagII (“NWSHPQFEK”) was purchased from Genscript (Cat# A01737, RRID:AB_2622222). BCR and co-receptors were labeled in a single incubation step with a mixture of 1 μg/ml SiR-biotin-Fab and 5 μg/ml biotinylated mouse anti-Strep-tagII mAb for 10 min at room temperature. Labeling was performed immediately prior to live cell imaging or chemical fixation.
For chemically fixed samples, labeled cells were rinsed with HEPES-buffered salt solution with BSA (HBSS-BSA: 30mM HEPES, 5.6 mM glucose, 100 mM NaCl, 5 mM KCl, 1 mM KCl, 1 mM MgCl2, 1.8 mM CaCl2, .1% w/v BSA, pH 7.4) and were either chemically fixed or biotinylated labeling proteins were clustered through addition of 1 μg/ml streptavidin for 6 min at room temperature. Samples were rinsed with PBS, then fixed (2% PFA .15% glutaraldehyde in PBS) for 10 min at room temperature. Samples were blocked and permeabilized using block solution (PBS with .5% w/v BSA, .05% v/v fish gelatin, .01% Triton-X 100) for 1 hour. For FAK labeling, cells were transiently transfected with FAK-eGFP plasmid DNA and were labeled with JF646 anti-GFP nanobody (1 μg/ml) for 30 min at room temperature after fixation, permeabilization, and blocking. Samples were then thoroughly rinsed with block solution and imaged.
Single molecule imaging
Imaging was performed using an Olympus IX81-XDC inverted microscope. TIRF laser angles where achieved using a cellTIRF module, a 100X UAPO TIRF objective (NA = 1.49), and active Z-drift correction (ZDC) (Olympus America) as described previously17,18. SiR and JF646 were excited using a 647 nm solid state laser (OBIS, 100 mW, Coherent) and Cy3B was excited using a with a 561 nm solid state laser (Sapphire 561 LP or OBIS 561-120FP, Coherent). Photoactivation of mEos3.2 was accomplished with a 405 nm diode laser (CUBE 405-50FP, Coherent) and simultaneously excited with the 561 nm solid state laser. Simultaneous imaging of SiR or JF646 and mEos3.2 or Cy3B was accomplished using a LF405/488/561/647 quadband filter cube (TRF89902, Chroma, Bellows Falls, VT). Emission was split into two channels using a DV2 emission splitting system (Photometrics) with a T640lpxr dichroic mirror to separate emission: ET605/52m to filter near-red emission, and ET700/75m to filter far-red emission (Chroma).
Live cell imaging was accomplished at room temperature in a buffer shown previously to be compatible with BCR mediated signaling responses (30 mM Tris, 9 mg/ml glucose, 100 mM NaCl, 5 mM KCl, 1 mM KCl, 1 mM MgCl2, 1.8 mM CaCl2, 10 mM glutathione, 8 μg/ml catalase, 100 μg/ml glucose oxidase, pH 8.517. Laser intensities were adjusted such that single fluorophores could be distinguished in individual frames and were generally between 5-20 kW/cm2 for 561 nm and 647 nm lasers, and 100-200 W/cm2 for the 405 nm laser. Integration times were maintained at 20ms. Generally, 5000 frames (~2min) were acquired in unstimulated cells, then an additional 20,000 frames (8-10min) were acquired after the addition of 1 μg/ml streptavidin, which crosslinks the SiR-biotin-Fab bound to BCR and initiates a signaling response. Throughout imaging, the laser intensity is modulated to maintain a suitable density of single molecules.
For measurements involving treatment with PP2, 5 μM PP2 (Sigma: 529573) from a 10 mM stock solution in DMSO was added to culture medium during the SiR-biotin-Fab labeling step prior to imaging. 5 μM PP2 was also added to all imaging buffers so that subsequent imaging and stimulation steps took place in the presence of PP2. For measurements involving treatment with alcohols, 15 μM 1-hexadecanol (Sigma: 258741) from a 6 mM DMSO stock solution or 300 μM 1-octanol (Sigma: 95446) from a 120 mM DMSO stock solution was added directly to the imaging buffer in Mattek dishes immediately before samples were transferred to the microscope for imaging. These treatments lead to a ±8C shift in miscibility transition temperatures for RBL-2H3 derived GPMVs29. Final DMSO concentration was .25% for both alcohol treatments. Alcohols in DMSO were also added to all imaging buffers so that subsequent imaging and stimulation steps took place in the presence of alcohols.
Imaging of chemically fixed cells was accomplished with the same illumination and data acquisition settings in a slightly modified buffer (100 mM Tris, 9 mg/ml glucose, 25 mM NaCl, 10 mM glutathione, 8 μg/ml catalase, 100 μg/ml glucose oxidase, pH 8.5. Individual fields of view were typically imaged over 20,000 frames, and multiple fields of view were imaged in each prepared dish of cells.
Image Processing, probe Localization, and pair-correlation analysis
Single molecules were localized in raw live cell movies with the ImageJ plugin ThunderSTORM57, using weighted least-squares fitting of an integrated Gaussian PSF with multi-emitter fitting analysis enabled to detect up to 2 single molecules within a diffraction-limited area. Localization data were then exported to our in-house MATLAB software for culling and successive post-processing steps17. Localizations in the two color channels were registered as published previously58. Cell regions were masked by hand for further analysis to exclude regions away from the cell as well as regions of extensive topography.
Steady-state cross-correlations from live cells were calculated as described previously18 with modifications to account for probe cross-talk between imaging channels and non-uniform spatial sampling. BCR cluster size and probe diffusion dynamics were extracted from steady-state auto-correlation functions18,59. Probe mobility measurements were corrected for the finite integration time (20ms) and localization precision as described previously60. BCR proximal probes are defined as anchor localizations that pass within Δr=100nm and Δτ = 2s of a BCR localization. Algorithms are detailed in Supplementary note 1, code is available as the smlm-analysis distribution on github.com/veatchlab, and detailed methods are described elsewhere61.
Determination of Lo enrichment in GPMVs
RBL-2H3 (rat, ATCC CRL-2256; RRID: CVCL_0591) and HEK-293 (HEK) (human, ATCC CRL-1573; RRID: CVCL_0045) cells were purchased from ATCC and cultured in medium containing 89% Eagle’s Minimum Essential Medium (EMEM), 10% FCS, and 1% penicillin/streptomycin at 37 °C in humidified 5% CO2. Cells were transiently transfected using nucleofection (Amaxa) according to protocols provided with the reagents. 4–6 h after transfection, cells were washed with PBS and then incubated with serum-free medium overnight. 1 h before preparation of GPMVs, the cells were given full-serum medium to synchronize cells.
Cell membranes were stained with 5 μg/ml of FAST-DiO (ThermoFisher: D3898), FAST-DiI (D7756), or DiD (D7757), respectively, green, red or far-red fluorescent lipid dyes that strongly partition to disordered phases. Following staining, GPMVs were isolated from transfected cells as described previously24. GPMV formation was induced by 2 mM N-ethylmaleimide (NEM) in hypotonic buffer containing 100 mM NaCl, 10 mM HEPES, and 2 mM CaCl2, pH 7.4. To quantify protein partitioning, GPMVs were observed on an inverted epifluorescence microscope (Nikon) at 4°C after treatment with 200 μM deoxycholic acid (DCA) to stabilize phase separation; this treatment has been previously demonstrated not to affect Lo phase affinity of various proteins26. The relative enrichment of probes in the Lo phase is defined as ([Lo]−[Ld])/([Lo]+[Ld]), where [Lo] and [Ld] are baseline corrected fluorescent intensity of the construct in the Lo and Ld phases respectively for >10 vesicles/trial, with at least 3 independent experiments for each anchor. Line scans are generally chosen to bisect the domain (i.e. capturing approximately the middle of the domain) to avoid possible confounding signals from domain edges. We use lines that are relatively thick (~1/5 of a given domain) to average out any lateral variation in fluorescence signals. We have previously tested other approaches, including (a) radial profiles, (b) measuring average intensity within different domains, and (c) drawing several different lines within a given domain. All these approaches and the one we have used here give quantitatively similar results, suggesting that the reported observations are robust to the specifics of the measurements. Lo enrichment is simply related to the partition coefficient Kp = [Lo]/[Ld] as Lo enrichment = (Kp−1)/(Kp+1) but is more appropriate for comparison with cell results because it is normalized to the total concentration rather than the concentration in the Lo phase, as is the case with cross-correlation functions. Most measurements were carried out in RBL-2H3 cells, but in some cases HEK cells were also used due to the enhanced surface expression of some probes in this cell type. When used, partitioning measurements in HEK cells produced partitioning results that were consistent with those obtained in RBL-2H3 cells but with improved signal to noise.
Flow cytometry
Activation of BCR was assessed through immunolabeling of phosphorylated BCR and measurement via flow cytometry. 500,000 CH27 cells per test condition were labeled in suspension at a concentration of 500,000 cells per ml. For alcohol treatment experiments, BCR was labeled with biotinylated goat anti-mouse IgM(μ) Fab fragments (Jackson ImmunoResearch Cat# 115-067-020, RRID:AB_2338587) at 5 μg/ml. For co-receptor experiments, trCD4cr or trCD28cr-transduced cells were used and both BCR and co-receptors were labeled with biotinylated goat anti-mouse IgM(μ) Fab fragments at 1 μg/ml and biotinylated mouse anti-STII antibody at 5 μg/ml, respectively, for 10 min at room temperature. Unlabeled and unstimulated controls were included for all treatments. Cells were pelleted and suspended twice in PBS containing 1% BSA, then stimulated with Alexa Fluor 568-conjugated streptavidin (ThermoFisher Cat# S-11226, RRID:AB_2315774) at a final concentration of 1 μg/ml for 6 min at room temperature. For alcohol-treated samples, 15 μM 1-hexadecanol from a 6 mM DMSO stock solution or 300 μM 1-octanol from a 120mM DMSO stock solution was added directly to cells in suspension while vortexing, immediately before addition of Alexa Fluor 568 streptavidin. Cell samples were fixed by addition of 4% paraformaldehyde to a final concentration of 1.5% and incubated for 20 min at room temperature. Cells were pelleted and rinsed with PBS-BSA to remove paraformaldehyde, then pelleted, placed on ice, and resuspended with 500 μl ice cold methanol. Cells were allowed to permeabilize on ice for 15 min, then pelleted and rinsed twice with cold PBS-BSA. Samples were resuspended in 100 μl PBS-BSA with 5 μg/ml rabbit monoclonal antibody against the CD79A subunit of BCR phosphorylated at Tyr182 (Cell Signaling Cat# 5173, RRID: AB_10694763) and incubated for 30 min at room temperature. Cells were pelleted and resuspended twice in cold PBS-BSA to remove primary antibody, then resuspended in 200 μl PBS-BSA with 5 μg/ml Alexa Fluor 647 goat anti-rabbit IgG secondary antibody (Jackson Immunoresearch Cat# 111-005-144, RRID:AB_2337919). Cells were labeled at room temperature for 60 min, then pelleted and rinsed with cold PBS-BSA. Cells were kept on ice until measurement via flow cytometry.
Activation of TCR in Jurkat cells was assessed through immunolabeling of phosphorylated TCR. Jurkat cells (human, ATCC TIB-152; RRID:CVCL_0065) were obtained from Akira Ono (University of Michigan) and cultured in medium containing 1640 RPMI, 10% heat inactivated FBS, and penicillin streptomycin at 37 °C in humidified 5% CO2. Jurkat cells were harvested and labeled with a mixture of mouse anti-CD3 (clone OKT3) (Biolegend Cat# 317326, AB_11150592) and mouse anti-CD28 antibodies (ThermoFisher: Cat# 16-0289-81, RRID:AB_468926) at 5 μg/ml and 3 μg/ml, respectively, for 10 min at room temperature. Cells were pelleted and suspended in PBS containing .1% BSA. Cell samples were then treated with alcohols as described above for flow cytometry of CH27 cells. A subset of samples were stimulated by addition of Alexa Fluor 568-conjugated goat anti-mouse secondary antibodies (ThermoFisher Cat# A-11004, AB_2534072) at a final concentration of 10 μg/ml for 10 min at room temperature. Cell samples were fixed as described above for CH27 cells and labeled in 100 μl PBS-BSA with 20 μL pre-diluted Alexa Fluor 647-conjugated antibodies against the TCR CD3ζ subunit phosphorylated at Tyr142 (BD Biosciences: Cat# 558489, RRID: AB_647152) for 30 min at room temperature. Cells were pelleted and resuspended twice in cold PBS-BSA and kept on ice until measurement via flow cytometry.
Flow cytometry was performed on an Attune NxT flow cytometer (ThermoFisher) with fluorescence measurements of eGFP, Alexa Fluor 568, and Alexa Fluor 647 using 488, 561, and 647nm laser lines for co-receptor experiments or Alexa Fluor 568 and Alexa Fluor 647 using 561 and 647nm laser lines for alcohol treatment experiments. Fluorescence bleed-through was corrected using compensation procedures. Data was collected using Attune NxT software and was exported as .fcs files and was read and analyzed using the fca_readfcs.m function and custom analysis scripts in MATLAB. Single intact cells were gated based on forward- and side-scatter measurements to exclude dead cells and debris. For trCD4cr and trCD28cr expressing cells, cell populations were gated to select for eGFP positive cells where the threshold was set using an untransduced control. This population represents 10-20% of the total population of forward and side-scatter gated cells. A representative example of the gating procedure can be found in Supplementary Figure 14. For samples where mEos3.2 labeled anchors are transiently expressed, mEos3.2-positive cells were identified based on a threshold set using an untransfected control, then mEos3.2-positive cells were equally divided into low-, medium-, and high-expressing populations based on cells with the lowest, medium, and highest mEos3.2 signal, with each category comprising approximately 1/3 of positive cells.
Ca2+ mobilization
Ca2+ flux responses downstream of BCR activation was measured using the calcium-sensitive cytoplasmic dye Fluo-4 AM (Thermofisher Cat #F14201) with fluorescence detection using a SpectraMax iD3 Microplate reader (Molecular Devices). 3 million CH27 cells were loaded with 2 μg/mL Fluo-4 AM for 5 min at room temperature in 1 mL HEPES-buffered salt solution with BSA and sulfinpyrazone (HBSS/B/S: 30mM HEPES, 5.6 mM glucose, 100 mM NaCl, 5 mM KCl, 1 mM KCl, 1 mM MgCl2, 1.8 mM CaCl2, .1% w/v BSA, and 0.25 mM sulfinpyrazone, pH 7.4). The cell suspension was subsequently diluted to a final volume of 15 mL with HBSS/B/S buffer and incubated for 30 min at 37°C to allow for dye loading. Cells were spun down and washed twice with 3 mL HBSS/B/S, then resuspended in 3 ml HBSS/B/S. 500,000 cells each were treated with DMSO (.25% final concentration), 1-hexadecanol or octanol. Cells were distributed in a black 96 well plate (100,000 cells per well) and Fluo-4 fluorescence was recorded by the microplate reader using excitation centered at 485 nm and emission centered at 520 nm before and after injection of antigen solutions. Either BCR was stimulated using F(ab’)2 fragments against the μ subunit of IgM BCR (Jackson Immunoresearch Cat# 115-006-020, RRID:AB_2338469) or cells were stimulated via the phosphocholine (PC)-specific BCRs expressed by the CH27 cell line by addition of 100nm lipid vesicles containing 1-palmitoyl-2-oleoyl-sn-glycero-3-phosphocholine (POPC) lipids (Avanti Polar lipids: Cat# 850457). F(ab’)2 was added at a final concentration of 2.5, 3, 3.6, or 10 ug/mL. For PC vesicle stimulation, large unilamellar vesicles were prepared through extrusion using an Avanti Polar Lipids Mini Extruder following manufacturer protocols and were composed of either 100% POPC or a 1:1 mixture of POPC with 1-palmitoyl-2-oleoyl-sn-glycero-3-phosphoethanolamine (POPE) (Avanti Polar lipids Cat# 850758).
Fitting to linear models and associated statistics
Cellular results were plotted vs. GPMV probe partitioning data and fit to a linear model to assess the magnitude and significance of correlations. This was done using the function lmfit() in MATLAB, and in all cases values were weighted by the inverse variance of the cellular measurement. When ratios were considered, values of the stated quantity were tabulated on a cell-by-cell basis and the variance was calculated from the standard error of the mean of the ratio across cells.
The function lmfit() returns p value against the null hypothesis that the data is described by a constant model (with no linear slope). An ANOVA analysis is then conducted using the anova() function in MATLAB. The f-statistic reported is the ‘F-statistic vs. constant model’ output of this function. In several instances, statistical significance is reported when comparing two empirical observations. These are conducted using either the ttest or ttest2 functions in MATLAB which implement, respectively, a 1-sample or unpaired two-sample t-test.
Generation of the membrane for Figure 5:
The membrane shown in Figure 5 was generated from a 2D matrix of pixel values (p), half normally distributed around the value −1 and half normally distributed around the value +1. Pixels were allowed to redistribute across the matrix through non-local exchanges and with periodic boundary conditions using a Monte Carlo algorithm that satisfied detailed balance, which tabulates the energy at each position i as where represents the pixel value of the 4 nearest neighbors. Temperature was chosen such that the size of structure in the simulation was small compared to the size of the matrix.
After equilibration, a weak field was introduced to bias the location of pixels within certain regions of the matrix. This field provided the additional energy Efi = −piFi. Plots showing the distribution of pixel values and the applied field matrix are found in Supplementary Figure 13. The remaining values of the field were set to zero. The average image was generated by averaging 50 different simulation snapshots with the same applied field.
Extended Data
Extended data Figure 1: Estimating the size of BCR clusters.
a, BCR auto-correlation functions, g(r, τ), for a single cell expressing the M anchor between 2-10min after BCR crosslinking. Curves are fit at fixed τ to to extract the amplitude (A) and range (σ) of correlations. b, Plots of A vs. τ for the same cell. We attribute the large amplitude at short τ (<0.1s) to multiple sequential observations of the same fluorophore, while correlations at larger τ (>0.1s) largely arise from different fluorophores in the same BCR cluster. c, Plots showing the σ vs τ for the same cell. At short τ (<0.1s), the range of correlations reports on the localization precision of the measurement. At larger τ (>0.1s), σ reflects the size of BCR clusters convoluted with the motion of clusters, which tends to further broaden g(r) at long τ. Based on this we estimate average BCR cluster radius in this cell to be near 34nm, which is roughly σ(0.1s). d, A histogram showing the distribution of σ(0.1s) extracted from BCR autocorrelations over 125 cells from Figure 1 has a mean and SEM of 33±4nm.
Extended data Figure 2: Representative images from cells expressing the anchors reconstructed using localizations acquired between 2 and 10 min after BCR clustering.
Reconstructed images of representative B cells expressing mEos3.2 conjugated to the indicated anchor (pseudo-colored green) from localizations acquired between 2 and 10 min after BCR clustering. Cells are labeled with biotinylated and SiR-labeled Fab anti-IgMμ (pseudo-colored magenta) that is crosslinked with soluble streptavidin. Scale bars are 1μm in the main figures and 10μm in the insets. The cell shown is representative of total number of cells imaged for each anchor that is shown in Supplemental Figure 3.
Extended data Figure 3: Steady-state cross-correlation functions in cells before and after BCR crosslinking.
a, Average cross-correlation functions, c(r), between BCR and anchors in cells prior to BCR crosslinking (−Ag) or between 2-10min after streptavidin addition (+Ag). Points represent the average over multiple cells and the shaded region represents the SEM. Cell numbers interrogated for each anchor and distributions of c(r<50nm) are shown in Supplemental Figure 3. b,c, Mean and SEM for c(r<50nm) for cells imaged prior to BCR crosslinking (b) or between 2-10min after BCR crosslinking (c) replotted from part a. All anchors show weak co-localization with unclustered BCR (c(r<50nm) close to 1.1). Amplitudes are more varied across anchors after BCR crosslinking. Anchor labels ending in * indicate that values are from experiments where BCR was clustered in the presence of 5μM PP2. Distributions of c(r<50nm) values across anchors are presented in Supplemental Figure 3.
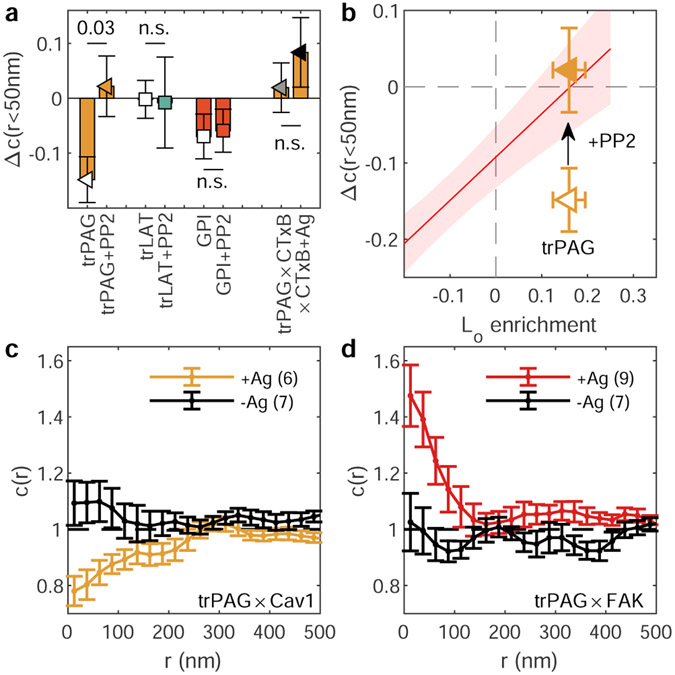
Extended data Figure 4: trPAG experiences specific, stimulation dependent interactions that contribute to its organization and mobility.
a, Changes in cross-correlation amplitudes (mean and SEM Δc(r<50nm) over at least 6 cells replotted from Figure 1) for BCR and select transmembrane anchors both in the presence and absence of 5μM PP2. The exact number of cells in each condition are presented in Supplemental Figure 3. trPAG was also imaged alongside clustered CTxB (×CTxB) in cells with (+Ag; N=4) and without (N=10) BCR clustering. p-values shown are assessed using a two-tailed ttest. b, PP2 treatment brings trPAG partitioning in-line with the correlations for transmembrane anchors redrawn from Fig. 2d. Points are means and SEMs redrawn from Fig. 2d and red line is linear fit to transmembrane anchors with the red shaded region representing the 95% confidence interval of the linear fit, also replotted from Fig. 2d. c,d, Cells expressing trPAG were chemically fixed either without BCR crosslinking (-Ag) or after 5 min after BCR cross-linking (+Ag). Points represent mean and SEM over multiple cells (N shown in legends). Either Caveolin 1 (Cav1; c) or Focal Adhesion Kinase (FAK; d) were labeled post-fixation with specific primary and secondary antibodies. Together, these results indicate that trPAG experiences stimulation dependent interactions not found for trLAT or GPI that lead it to localize away from BCR clusters (a,b). A subset of trPAG localizes with adhesive structures labeled by FAK (d), suggesting a stimulation dependent interaction gives rise to deviations from trends exhibited by other transmembrane anchors.
Extended data Figure 5: Representative images of GPMVs containing all anchors.
Schematic representation of anchors above images of representative GPMVs and intensity traces. Vesicles are representative of 30 vesicles imaged over 3 distinct experiments for each anchor.
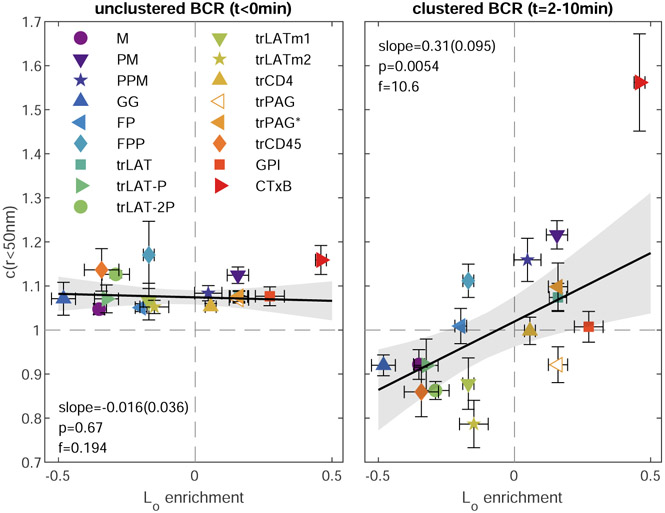
Extended data Figure 6: Correlations between GPMV and BCR partitioning of membrane anchors before (left) and after (right) BCR clustering.
Points represent mean and SEM of c(r<50nm) replotted from Extended data Figure 3b (left) and c (right) vs means and SEM of Lo enrichment from GPMV measurements replotted from Fig. 2b. Cell numbers for each condition are shown in Supplemental Fig. 3. PAG* values were obtained from experiments where BCR was clustered in the presence of 5μM PP2. Trends in are fit to a linear model and the significance is assessed with a p-value of the two-sized hypothesis test against their being no correlation (lower values indicate greater significance), and an f-statistic that reports how well the variance in the data is described by the linear fit (higher values indicate greater significance). Gray shaded regions in indicate the 95% confidence interval of the linear fit.
Extended data Figure 7: Alcohol treatments that modulate BCR cluster domain contrast also modulate downstream Ca2+ mobilization responses.
a, Representative Calcium mobilization traces for CH27 cells pretreated with n-alcohols and stimulated with 2.5μg/ml F(ab’)2 fragments against the μ subunit of IgM BCR, as measured by the calcium-sensitive dye Flou-4 AM (left). , Baseline drift was corrected by fitting a line to the Fluo-4 fluorescence trace prior to antigen addition and dividing the entire fluorescence trace by this baseline. Hexadecanol (hex) or octanol (oct) were added from stock solutions in DMSO, or an equivalent final concentration of DMSO was added as a carrier control. Points are mean and SEM from 2 technical replicates per condition. (Right) Maximum fluorescence signal from calcium traces normalized to maximum values for the DMSO treated control. Cells were stimulated with varied F(ab’)2 concentrations (3.6, 3, 2.5 and 10 μg/ml). Peak values of fluorescence fold increase traces for hexadecanol or octanol-treated cells were normalized by peak values for DMSO-treated cells recorded during the same experiment with equivalent stimulation conditions. Colored symbols show mean and SE of 4 independent measurements. b, Calcium mobilization was measured and quantified as in a, but cells were stimulated via the phosphocholine (PC)-specific BCRs expressed by the CH27 cell line by addition of 100nm lipid vesicles containing POPC lipids at 300μg/ml. (right) Same as in a but cells were stimulated with either 300μg/ml POPC vesicles or vesicles composed of 1:1 mixture of POPC and POPE. Colored symbols show mean and SE of 4 independent measurements. In both a and b, p-values from a single-tail t-test estimate the significance of deviations of responses of treated cells compared to the (normalized) DMSO control, while a 2-tail t-test is used to compare responses in Hex and Oct treated cells.
Extended data Figure 8: Alcohol treatments that modulate domain contrast also modulate T cell receptor phosphorylation in Jurkat cells.
a, Representative histograms from flow cytometry measurements of pTCR staining (log axis scale). Jurkat cells were pre-treated with either hexadecanol (Hex; top) or octanol (Oct; bottom) before co-stimulation through the T cell receptor (CD3) and CD28 coreceptor with primary (α) and secondary (2°) antibodies. Phospho-TCR is labeled using an antibody against the phosphorylated form of Y142 on CD3ζ. b, Summary of pTCR levels of various treatments normalized to pTCR levels of DMSO treated (control) cells stimulated with anti-CD3, anti-CD28, and secondary antibodies. Large points represent mean and SEM over 3 independent measurements for each condition. p-values come from a single-tail t-test estimate the significance of deviations of responses of treated cells compared to the (normalized) DMSO control, while a 2-tail t-test is used to compare responses in Hex and Oct treated cells.
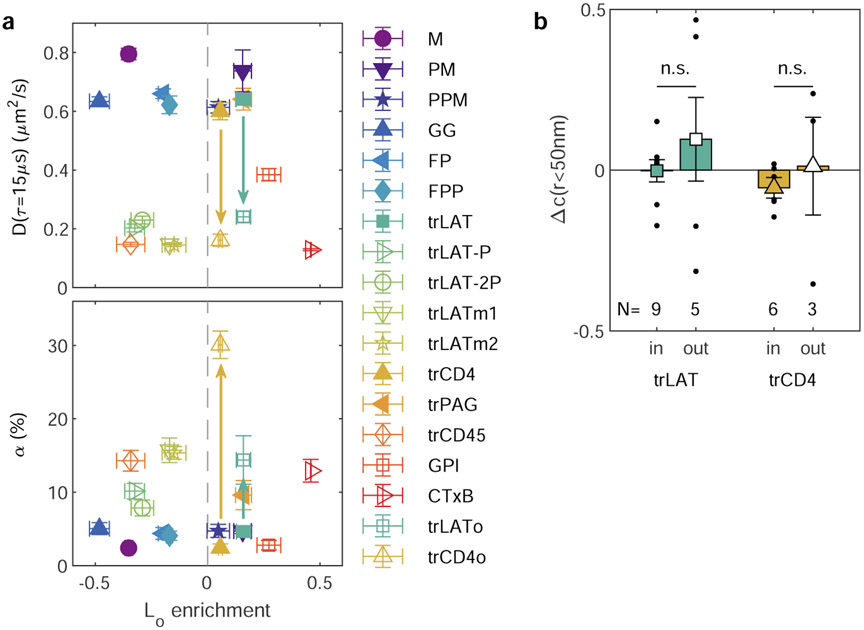
Extended data Figure 9: moving mEos3.2 probe to the extracellular terminus slows diffusion (D) and increases the population of confined diffusers (α) for both trLAT and trCD4.
a, Diffusion coefficients (D) for the mobile component and the fraction of molecules in the confined state (α) are plotted vs. Lo enrichment in GPMVs. Points for D and α are averages and SEMs over values extracted from single cells and Lo enrichment is mean and SEM replotted from Figure 2b. Most points are replotted from Fig. 4a. Constructs with extracellular mEos3.2 are shown as open symbols and arrows highlight the change for trLAT and trCD4 when the probe is moved from the cytoplasmic side of the transmembrane anchor (trLAT and trCD4) to the extracellular space (trLATo and trCD4o). Cell numbers for each condition are shown in Supplemental Figure 3 other than trLATo (N=5) and trCD4o (N=3). b, Probe enrichment at BCR clusters for two anchors where for trLAT and trCD4 anchors with intracellular or extracellular probes. Large points indicate mean and SEM over values in individual cells, with cell numbers indicated. Repositioning the probe does not significantly impact probe enrichment at BCR clusters as evaluated using a two-tailed t-test. For these anchors, positioning mEos3.2 on the extracellular face dramatically impacts anchor surface expression, leading to large statistical errors.
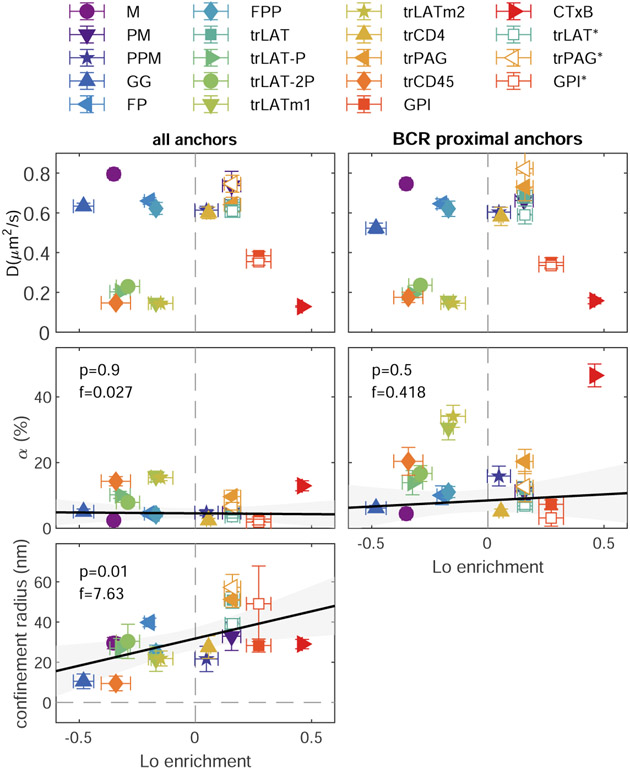
Extended data Figure 10: Summary of fit parameters describing anchor mobility at τ=15ms.
Diffusion coefficients (D) for the mobile component, the fraction of molecules in the confined state (α), and the confinement radius averaged over cells expressing the specified anchor for all conditions investigated. In all panels, vertical positions are means and SEM of the specified parameter over multiple cells, with cell numbers for each anchor reported in Supplemental Figure 3. Horizontal positions for all panels are means and SEMs replotted from Fig. 2b. Anchor labels ending in * indicate that values are from experiments where BCR was clustered in the presence of 5μM PP2. For the condition “BCR proximal”, anchor localizations found within 100nm of a BCR localization are cross-correlated with all anchor localizations as described in methods. The fitting of BCR proximal curves was accomplished by fixing the confinement radius to the value obtained for all trajectories (t=2-10min) to improve the robustness of fitting to correlation functions with reduced signal to noise. Trends in α and confinement radius and are fit to a linear model and the significance is assessed with a p-value of the two-sized hypothesis test against their being no correlation (lower values indicate greater significance), and an f-statistic that reports how well the variance in the data is described by the linear fit (higher values indicate greater significance). All points are included in the linear fit. Shaded regions indicate the 95% confidence interval of the fit.
Supplementary Material
Supplementary Video 1: Single molecule motions of BCR and PM before BCR crosslinking. Time-lapse video showing reconstructed single molecule positions evolving in time for BCR (magenta) and PM (green) for the same PM expressing cell shown in Fig. 1 a. These localizations were acquired <1min prior to the addition of streptavidin. Localizations are drawn on a reconstructed image of all PM localizations for this cell. The movie is displayed with a frame rate that is 5x slower than real time. Images were acquired at nearly 50 frames per second under total internal reflection illumination. Scale bar is 5 μm.
Supplementary Video 2: Single molecule motions of BCR and PM after BCR crosslinking. Time-lapse video showing reconstructed single molecule positions evolving in time for BCR (magenta) and PM (green) for the same PM expressing cell shown in Fig. 1 a. These localizations were acquired ~2min after addition of streptavidin. Localizations are drawn on a reconstructed image of all PM localizations for this cell. The movie is displayed with a frame rate that is 5x slower than real time. Images were acquired at nearly 50 frames per second under total internal reflection illumination. Scale bar is 5 μm.
Supplementary Video 3:Single molecule motions of BCR and M before BCR crosslinking. Time-lapse video showing reconstructed single molecule positions evolving in time for BCR (magenta) and M (green) for the same M expressing cell shown in Fig. 1 a. These localizations were acquired <1min prior to the addition of streptavidin. Localizations are drawn on a reconstructed image of all M localizations for this cell. The movie is displayed with a frame rate that is 5x slower than real time. Images were acquired at nearly 50 frames per second under total internal reflection illumination. Scale bar is 5 μm.
Supplementary Video 4: Single molecule motions of BCR and M after BCR crosslinking. Time-lapse video showing reconstructed single molecule positions evolving in time for BCR (magenta) and M (green) for the same M expressing cell shown in Fig. 1 a. These localizations were acquired ~2min after addition of streptavidin. Localizations are drawn on a reconstructed image of all M localizations for this cell. The movie is displayed with a frame rate that is 5x slower than real time. Images were acquired at nearly 50 frames per second under total internal reflection illumination. Scale bar is 5 μm.
Supplementary Video 5: Time lapse of BCR and PM organization before and after BCR cross-linking. Time lapse movie composed of reconstructed images of BCR (magenta) and PM (green) from the same representative cell shown in Fig. 1 a, shown here at higher time resolution to demonstrate how BCR and PM organization evolve over time. Each sequential image is reconstructed from a window of 750 frames (~20sec) incremented by 250 (~6sec) frames for each image. The entire time lapse spans the length of the live cell experiment and the real time of data acquisition is shown in the bottom-left, where 0 min corresponds to streptavidin addition. Before streptavidin addition, both BCR and PM are relatively uniformly distributed across the plasma membrane. After streptavidin addition, BCR rapidly forms tight clusters. BCR clusters are relatively immobile compared to PM but do exhibit dynamics that are evident in the time lapse. Scale bar is 5 μm.
Supplementary Video 6: Time lapse of BCR and M organization before and after BCR cross-linking. Time lapse movie composed of reconstructed images of BCR (magenta) and M (green)from the same representative cell shown in Fig. 1 a. Parameters for reconstruction of individual frames of the time lapse are the same as in Supplementary Movie 3, and the time lapse shows similar organization of BCR and M before and after streptavidin addition. Time before and after streptavidin addition in shown in the bottom left and the scale bar is 5 μm.
ACKNOWLEDGEMENTS
We thank Ben Machta, Thomas Shaw, Isabella Graf, Nirmalya Bag, and Barbara Baird for helpful conversations and Andrea Stoddard with assistance preparing minimal co-receptor constructs and transduced cell lines. Research was supported by grants from the NIH (GM110052 to SLV, GM134949 and GM124072 to IL), the NSF (MCB1552439 to SLV), the American Cancer Society (PF1800401CCE to SAS), the Volkswagen Foundation (grant 93091 to IL), and the Human Frontiers Science Program (RGP0059/2019 to IL).
Footnotes
COMPETING INTERESTS STATEMENT
The authors declare no competing interests.
DATA AVAILABILITY
A subset of the data used in this study (localizations and regions of interests) are available along with data analysis scripts at https://github.com/VeatchLab/smlm-analysis. All raw localizations, regions of interest, and fcs data are available at https://zenodo.org/record/7508426 (DOI: 10.5281/zenodo.7508426).
CODE AVAILABILITY
Algorithms used by custom analysis code are described in detail in the Methods and the majority have been reported previously17,18,61. Analysis code, sample data, and example analysis scripts are available at https://zenodo.org/record/7478055 (DOI: 10.5281/zenodo.7478055). Updated versions may be available at https://github.com/VeatchLab/smlm-analysis.
REFERENCES
- 1.Lyon AS, Peeples WB & Rosen MK A framework for understanding the functions of biomolecular condensates across scales. Nat. Rev. Mol. Cell Biol 22, 215–235 (2021). [DOI] [PMC free article] [PubMed] [Google Scholar]
- 2.Shin Y & Brangwynne CP Liquid phase condensation in cell physiology and disease. Science 357, (2017). [DOI] [PubMed] [Google Scholar]
- 3.Brown DA & Rose JK Sorting of GPI-anchored proteins to glycolipid-enriched membrane subdomains during transport to the apical cell surface. Cell 68, 533–544 (1992). [DOI] [PubMed] [Google Scholar]
- 4.Simons K & Ikonen E Functional rafts in cell membranes. Nature 387, 569–572 (1997). [DOI] [PubMed] [Google Scholar]
- 5.Lingwood D & Simons K Lipid rafts as a membrane-organizing principle. Science 327, 46–50 (2010). [DOI] [PubMed] [Google Scholar]
- 6.Holowka D & Baird B Roles for lipid heterogeneity in immunoreceptor signaling. Biochim. Biophys. Acta 1861, 830–836 (2016). [DOI] [PMC free article] [PubMed] [Google Scholar]
- 7.Pierce SK & Liu W The tipping points in the initiation of B cell signalling: how small changes make big differences. Nat. Rev. Immunol 10, 767–777 (2010). [DOI] [PMC free article] [PubMed] [Google Scholar]
- 8.Varshney P, Yadav V & Saini N Lipid rafts in immune signalling: current progress and future perspective. Immunology 149, 13–24 (2016). [DOI] [PMC free article] [PubMed] [Google Scholar]
- 9.Zech T. et al. Accumulation of raft lipids in T-cell plasma membrane domains engaged in TCR signalling. EMBO J. 28, 466–476 (2009). [DOI] [PMC free article] [PubMed] [Google Scholar]
- 10.Baird B, Sheets ED & Holowka D How does the plasma membrane participate in cellular signaling by receptors for immunoglobulin E? Biophys. Chem 82, 109–119 (1999). [DOI] [PubMed] [Google Scholar]
- 11.Cheng PC, Dykstra ML, Mitchell RN & Pierce SK A role for lipid rafts in B cell antigen receptor signaling and antigen targeting. J. Exp. Med 190, 1549–1560 (1999). [DOI] [PMC free article] [PubMed] [Google Scholar]
- 12.Janes PW, Ley SC, Magee AI & Kabouridis PS The role of lipid rafts in T cell antigen receptor (TCR) signalling. Semin. Immunol 12, 23–34 (2000). [DOI] [PubMed] [Google Scholar]
- 13.Shaw TR, Ghosh S & Veatch SL Critical Phenomena in Plasma Membrane Organization and Function. Annu. Rev. Phys. Chem 72, 51–72 (2021). [DOI] [PMC free article] [PubMed] [Google Scholar]
- 14.Gold MR & Reth MG Antigen Receptor Function in the Context of the Nanoscale Organization of the B Cell Membrane. Annu. Rev. Immunol 37, 97–123 (2019). [DOI] [PubMed] [Google Scholar]
- 15.Gupta N & DeFranco AL Lipid rafts and B cell signaling. Semin. Cell Dev. Biol 18, 616–626 (2007). [DOI] [PMC free article] [PubMed] [Google Scholar]
- 16.Sohn HW, Tolar P, Jin T & Pierce SK Fluorescence resonance energy transfer in living cells reveals dynamic membrane changes in the initiation of B cell signaling. Proc. Natl. Acad. Sci. U. S. A 103, 8143–8148 (2006). [DOI] [PMC free article] [PubMed] [Google Scholar]
- 17.Stone MB, Shelby SA, Núñez MF, Wisser K & Veatch SL Protein sorting by lipid phase-like domains supports emergent signaling function in B lymphocyte plasma membranes. eLife 6, e19891 (2017). [DOI] [PMC free article] [PubMed] [Google Scholar]
- 18.Stone MB & Veatch SL Steady-state cross-correlations for live two-colour super-resolution localization data sets. Nat. Commun 6, (2015). [DOI] [PMC free article] [PubMed] [Google Scholar]
- 19.Shelby SA, Shaw TR & Veatch SL Measuring the co-localization and dynamics of mobile proteins in live cells undergoing signaling responses. in The Immune Synapse: Methods and Protocols (eds. Baldari CT & Dustin ML) vol. 2654 (Humana, 2023). [DOI] [PMC free article] [PubMed] [Google Scholar]
- 20.Stone MB, Shelby SA & Veatch SL Super-Resolution Microscopy: Shedding Light on the Cellular Plasma Membrane. Chem. Rev 117, 7457–7477 (2017). [DOI] [PMC free article] [PubMed] [Google Scholar]
- 21.Maity PC et al. B cell antigen receptors of the IgM and IgD classes are clustered in different protein islands that are altered during B cell activation. Sci. Signal 8, ra93–ra93 (2015). [DOI] [PubMed] [Google Scholar]
- 22.Mattila PK et al. The Actin and Tetraspanin Networks Organize Receptor Nanoclusters to Regulate B Cell Receptor-Mediated Signaling. Immunity 38, 461–474 (2013). [DOI] [PubMed] [Google Scholar]
- 23.Parmryd I & Önfelt B Consequences of membrane topography. FEBS J. 280, 2775–2784 (2013). [DOI] [PubMed] [Google Scholar]
- 24.Levental I, Lingwood D, Grzybek M, Coskun U & Simons K Palmitoylation regulates raft affinity for the majority of integral raft proteins. Proc. Natl. Acad. Sci. U. S. A 107, 22050–22054 (2010). [DOI] [PMC free article] [PubMed] [Google Scholar]
- 25.Lorent JH et al. Structural determinants and functional consequences of protein affinity for membrane rafts. Nat. Commun 8, 1219 (2017). [DOI] [PMC free article] [PubMed] [Google Scholar]
- 26.Zhou Y. et al. Bile Acids Modulate Signaling by Functional Perturbation of Plasma Membrane Domains. J. Biol. Chem 288, 35660–35670 (2013). [DOI] [PMC free article] [PubMed] [Google Scholar]
- 27.Zhao J, Wu J & Veatch SL Adhesion Stabilizes Robust Lipid Heterogeneity in Supercritical Membranes at Physiological Temperature. Biophys. J 104, 825–834 (2013). [DOI] [PMC free article] [PubMed] [Google Scholar]
- 28.Hui E & Vale RD In vitro membrane reconstitution of the T-cell receptor proximal signaling network. Nat. Struct. Mol. Biol 21, 133–142 (2014). [DOI] [PMC free article] [PubMed] [Google Scholar]
- 29.Machta BB et al. Conditions that Stabilize Membrane Domains Also Antagonize n-Alcohol Anesthesia. Biophys. J 111, 537–545 (2016). [DOI] [PMC free article] [PubMed] [Google Scholar]
- 30.Gaus K, Chklovskaia E, Fazekas de St. Groth, B., Jessup, W. & Harder, T. Condensation of the plasma membrane at the site of T lymphocyte activation. J. Cell Biol 171, 121–131 (2005). [DOI] [PMC free article] [PubMed] [Google Scholar]
- 31.Urbančič I. et al. Aggregation and mobility of membrane proteins interplay with local lipid order in the plasma membrane of T cells. FEBS Lett. 595, 2127–2146 (2021). [DOI] [PubMed] [Google Scholar]
- 32.Bag N. et al. Lipid-based and protein-based interactions synergize transmembrane signaling stimulated by antigen clustering of IgE receptors. Proc. Natl. Acad. Sci. U. S. A 118, e2026583118 (2021). [DOI] [PMC free article] [PubMed] [Google Scholar]
- 33.Koyama-Honda I. et al. High-speed single-molecule imaging reveals signal transduction by induced transbilayer raft phases. J. Cell Biol 219, (2020). [DOI] [PMC free article] [PubMed] [Google Scholar]
- 34.Kinoshita M. et al. Raft-based sphingomyelin interactions revealed by new fluorescent sphingomyelin analogs. J. Cell Biol. 216, 1183–1204 (2017). [DOI] [PMC free article] [PubMed] [Google Scholar]
- 35.Liu AP & Fletcher DA Actin Polymerization Serves as a Membrane Domain Switch in Model Lipid Bilayers. Biophys. J 91, 4064–4070 (2006). [DOI] [PMC free article] [PubMed] [Google Scholar]
- 36.Honigmann A. et al. A lipid bound actin meshwork organizes liquid phase separation in model membranes. eLife 3, (2014). [DOI] [PMC free article] [PubMed] [Google Scholar]
- 37.Chung JK et al. Coupled membrane lipid miscibility and phosphotyrosine-driven protein condensation phase transitions. Biophys. J 120, 1257–1265 (2021). [DOI] [PMC free article] [PubMed] [Google Scholar]
- 38.Ge M. et al. Ordered and Disordered Phases Coexist in Plasma Membrane Vesicles of RBL-2H3 Mast Cells. An ESR Study. Biophys. J 85, 1278–1288 (2003). [DOI] [PMC free article] [PubMed] [Google Scholar]
- 39.Heberle FA et al. Direct label-free imaging of nanodomains in biomimetic and biological membranes by cryogenic electron microscopy. Proc. Natl. Acad. Sci 117, 19943–19952 (2020). [DOI] [PMC free article] [PubMed] [Google Scholar]
- 40.Li G, Wang Q, Kakuda S & London E Nanodomains can persist at physiologic temperature in plasma membrane vesicles and be modulated by altering cell lipids[S]. J. Lipid Res 61, 758–766 (2020). [DOI] [PMC free article] [PubMed] [Google Scholar]
- 41.Swamy MJ et al. Coexisting domains in the plasma membranes of live cells characterized by spin-label ESR spectroscopy. Biophys. J 90, 4452–4465 (2006). [DOI] [PMC free article] [PubMed] [Google Scholar]
- 42.Sengupta P, Holowka D & Baird B Fluorescence resonance energy transfer between lipid probes detects nanoscopic heterogeneity in the plasma membrane of live cells. Biophys. J 92, 3564–3574 (2007). [DOI] [PMC free article] [PubMed] [Google Scholar]
- 43.Cherukuri A, Cheng PC, Sohn HW & Pierce SK The CD19/CD21 Complex Functions to Prolong B Cell Antigen Receptor Signaling from Lipid Rafts. Immunity 14, 169–179 (2001). [DOI] [PubMed] [Google Scholar]
- 44.Sohn HW, Pierce SK & Tzeng S-J Live Cell Imaging Reveals that the Inhibitory FcγRNB Destabilizes B Cell Receptor Membrane-Lipid Interactions and Blocks Immune Synapse Formation. J. Immunol 180, 793–799 (2008). [DOI] [PubMed] [Google Scholar]
- 45.Karnell FG, Brezski RJ, King LB, Silverman MA & Monroe JG Membrane cholesterol content accounts for developmental differences in surface B cell receptor compartmentalization and signaling. J. Biol. Chem 280, 25621–25628 (2005). [DOI] [PubMed] [Google Scholar]
- 46.Sproul TW, Malapati S, Kim J & Pierce SK Cutting Edge: B Cell Antigen Receptor Signaling Occurs Outside Lipid Rafts in Immature B Cells. J. Immunol 165, 6020–6023 (2000). [DOI] [PubMed] [Google Scholar]
- 47.Elliott JI et al. Phosphatidylserine exposure in B lymphocytes: a role for lipid packing. Blood 108, 1611–1617 (2006). [DOI] [PubMed] [Google Scholar]
- 48.Marshall AJ, Niiro H, Yun TJ & Clark EA Regulation of B-cell activation and differentiation by the phosphatidylinositol 3-kinase and phospholipase Cgamma pathway. Immunol. Rev 176, 30–46 (2000). [DOI] [PubMed] [Google Scholar]
- 49.Rodgers W. Making membranes green: construction and characterization of GFP-fusion proteins targeted to discrete plasma membrane domains. BioTechniques 32, 1044–1046, 1048, 1050–1051 (2002). [DOI] [PubMed] [Google Scholar]
METHODS-ONLY REFERENCES
- 50.Pyenta PS, Holowka D & Baird B Cross-Correlation Analysis of Inner-Leaflet-Anchored Green Fluorescent Protein Co-Redistributed with IgE Receptors and Outer Leaflet Lipid Raft Components. Biophys. J 80, 2120–2132 (2001). [DOI] [PMC free article] [PubMed] [Google Scholar]
- 51.Ono A, Waheed AA & Freed EO Depletion of cellular cholesterol inhibits membrane binding and higher-order multimerization of human immunodeficiency virus type 1 Gag. Virology 360, 27–35 (2007). [DOI] [PMC free article] [PubMed] [Google Scholar]
- 52.Apolloni A, Prior IA, Lindsay M, Parton RG & Hancock JF H-ras but Not K-ras Traffics to the Plasma Membrane through the Exocytic Pathway. Mol. Cell. Biol 20, 2475–2487 (2000). [DOI] [PMC free article] [PubMed] [Google Scholar]
- 53.Keller P, Toomre D, Díaz E, White J & Simons K Multicolour imaging of post-Golgi sorting and trafficking in live cells. Nat. Cell Biol 3, 140–149 (2001). [DOI] [PubMed] [Google Scholar]
- 54.Liu L. et al. Inclusion of Strep-tag II in design of antigen receptors for T-cell immunotherapy. Nat. Biotechnol 34, 430–434 (2016). [DOI] [PMC free article] [PubMed] [Google Scholar]
- 55.Yam PY et al. Design of HIV Vectors for Efficient Gene Delivery into Human Hematopoietic Cells. Mol. Ther 5, 479–484 (2002). [DOI] [PubMed] [Google Scholar]
- 56.Haughton G, Arnold LW, Bishop GA & Mercolino TJ The CH Series of Murine B Cell Lymphomas: Neoplastic Analogues of Ly-1+ Normal B Cells. Immunol. Rev 93, 35–52 (1986). [DOI] [PubMed] [Google Scholar]
- 57.Ovesný M, Křížek P, Borkovec J, Svindrych Z & Hagen GM ThunderSTORM: a comprehensive ImageJ plug-in for PALM and STORM data analysis and super-resolution imaging. Bioinforma. Oxf. Engl 30, 2389–2390 (2014). [DOI] [PMC free article] [PubMed] [Google Scholar]
- 58.Churchman LS, Ökten Z, Rock RS, Dawson JF & Spudich JA Single molecule high-resolution colocalization of Cy3 and Cy5 attached to macromolecules measures intramolecular distances through time. Proc. Natl. Acad. Sci. U. S. A 102, 1419–1423 (2005). [DOI] [PMC free article] [PubMed] [Google Scholar]
- 59.Veatch SL et al. Correlation Functions Quantify Super-Resolution Images and Estimate Apparent Clustering Due to Over-Counting. PLoS ONE 7, e31457 (2012). [DOI] [PMC free article] [PubMed] [Google Scholar]
- 60.Berglund AJ Statistics of camera-based single-particle tracking. Phys. Rev E 82, 011917 (2010). [DOI] [PubMed] [Google Scholar]
Associated Data
This section collects any data citations, data availability statements, or supplementary materials included in this article.
Supplementary Materials
Supplementary Video 1: Single molecule motions of BCR and PM before BCR crosslinking. Time-lapse video showing reconstructed single molecule positions evolving in time for BCR (magenta) and PM (green) for the same PM expressing cell shown in Fig. 1 a. These localizations were acquired <1min prior to the addition of streptavidin. Localizations are drawn on a reconstructed image of all PM localizations for this cell. The movie is displayed with a frame rate that is 5x slower than real time. Images were acquired at nearly 50 frames per second under total internal reflection illumination. Scale bar is 5 μm.
Supplementary Video 2: Single molecule motions of BCR and PM after BCR crosslinking. Time-lapse video showing reconstructed single molecule positions evolving in time for BCR (magenta) and PM (green) for the same PM expressing cell shown in Fig. 1 a. These localizations were acquired ~2min after addition of streptavidin. Localizations are drawn on a reconstructed image of all PM localizations for this cell. The movie is displayed with a frame rate that is 5x slower than real time. Images were acquired at nearly 50 frames per second under total internal reflection illumination. Scale bar is 5 μm.
Supplementary Video 3:Single molecule motions of BCR and M before BCR crosslinking. Time-lapse video showing reconstructed single molecule positions evolving in time for BCR (magenta) and M (green) for the same M expressing cell shown in Fig. 1 a. These localizations were acquired <1min prior to the addition of streptavidin. Localizations are drawn on a reconstructed image of all M localizations for this cell. The movie is displayed with a frame rate that is 5x slower than real time. Images were acquired at nearly 50 frames per second under total internal reflection illumination. Scale bar is 5 μm.
Supplementary Video 4: Single molecule motions of BCR and M after BCR crosslinking. Time-lapse video showing reconstructed single molecule positions evolving in time for BCR (magenta) and M (green) for the same M expressing cell shown in Fig. 1 a. These localizations were acquired ~2min after addition of streptavidin. Localizations are drawn on a reconstructed image of all M localizations for this cell. The movie is displayed with a frame rate that is 5x slower than real time. Images were acquired at nearly 50 frames per second under total internal reflection illumination. Scale bar is 5 μm.
Supplementary Video 5: Time lapse of BCR and PM organization before and after BCR cross-linking. Time lapse movie composed of reconstructed images of BCR (magenta) and PM (green) from the same representative cell shown in Fig. 1 a, shown here at higher time resolution to demonstrate how BCR and PM organization evolve over time. Each sequential image is reconstructed from a window of 750 frames (~20sec) incremented by 250 (~6sec) frames for each image. The entire time lapse spans the length of the live cell experiment and the real time of data acquisition is shown in the bottom-left, where 0 min corresponds to streptavidin addition. Before streptavidin addition, both BCR and PM are relatively uniformly distributed across the plasma membrane. After streptavidin addition, BCR rapidly forms tight clusters. BCR clusters are relatively immobile compared to PM but do exhibit dynamics that are evident in the time lapse. Scale bar is 5 μm.
Supplementary Video 6: Time lapse of BCR and M organization before and after BCR cross-linking. Time lapse movie composed of reconstructed images of BCR (magenta) and M (green)from the same representative cell shown in Fig. 1 a. Parameters for reconstruction of individual frames of the time lapse are the same as in Supplementary Movie 3, and the time lapse shows similar organization of BCR and M before and after streptavidin addition. Time before and after streptavidin addition in shown in the bottom left and the scale bar is 5 μm.
Data Availability Statement
A subset of the data used in this study (localizations and regions of interests) are available along with data analysis scripts at https://github.com/VeatchLab/smlm-analysis. All raw localizations, regions of interest, and fcs data are available at https://zenodo.org/record/7508426 (DOI: 10.5281/zenodo.7508426).
Algorithms used by custom analysis code are described in detail in the Methods and the majority have been reported previously17,18,61. Analysis code, sample data, and example analysis scripts are available at https://zenodo.org/record/7478055 (DOI: 10.5281/zenodo.7478055). Updated versions may be available at https://github.com/VeatchLab/smlm-analysis.


