

Abstract
Objective
The aim of the study was to (1) characterize organizational differences in primary care physicians' electronic health record (EHR) behavior; (2) assess within‐organization consistency in EHR behaviors; and (3) identify whether organizational consistency is associated with physician‐level efficiency.
Data Sources
EHR metadata capturing averaged weekly measures of EHR time and documentation composition from 75,124 US primary care physicians across 299 organizations between September 2020 and May 2021 were taken. EHR time measures include active time in orders, chart review, notes, messaging, time spent outside of scheduled hours, and total EHR time. Documentation composition measures include note length and percentage use of templated text or copy/paste. Efficiency is measured as the percent of visits with same‐day note completion.
Study Design
All analyses are cross‐sectional. Across‐organization differences in EHR use and documentation composition are presented via 90th‐to‐10th percentile ratios of means and SDs. Multilevel modeling with post‐estimation variance partitioning assesses the extent of an organizational signature—the proportion of variation in our measures attributable to organizations (versus specialty and individual behaviors). We measured organizational internal consistency for each measure via organization‐level SD, which we grouped into quartiles for regression. Association between internally consistent (i.e., low SD) organizational EHR use and physician‐level efficiency was assessed with multi‐variable OLS models.
Data Collection
Extraction from Epic's Signal platform used for measuring provider EHR efficiency.
Principal Findings
EHR time per visit for physicians at a 90th percentile organization is 1.94 times the average EHR time at a 10th percentile organization. There is little evidence, on average, of an organizational signature. However, physicians in organizations with high internal consistency in EHR use demonstrate increased efficiency. Physicians in organizations with the highest internal consistency (top quartile) have a 3.77 percentage point higher same‐day visit closure rates compared with peers in bottom quartile organizations (95% confidence interval: 0.0142–0.0612).
Conclusions
Results suggest unrealized opportunities for organizations and policymakers to support consistency in how physicians engage in EHR‐supported work.
Keywords: documentation, electronic health records (EHRs), health care organizations, physician burnout
What is known on this topic
Patterns of electronic health record (EHR) use vary significantly across physicians; excessive EHR time and cumbersome documentation approaches may lead to physician dissatisfaction, burnout, and impacts on patient care.
Policy solutions to address EHR burden have been slow to diffuse. Individualized supports are difficult to scale and place the onus of work system optimization on the end user.
Organizations have substantial leeway in making choices around EHR design and use, but the extent and results of these activities are difficult to observe at scale.
What this study adds
This study is the first national analysis to characterize the extent to which organizations are shaping how primary care physicians engage in EHR‐supported work.
The average physician EHR user profile varies across organizations, but there is little detectable “organizational signature” with respect to how the EHR is used by primary care physicians.
We find a persistent association between higher internal consistency in organizations' EHR user behavior and higher physician same‐day visit closure rates, an important measure of operational efficiency.
1. INTRODUCTION
For most physicians, use of the electronic health record (EHR) to complete tasks and document encounters has become a significant feature of medical practice. Burden associated with EHR, misalignment with physician needs, usability challenges, and total time tethered to the EHR, is a pressing issue for health care organizations. These challenges impact efficiency, quality, and safety of patient care, as well as physician feelings of dissatisfaction and burnout. 1 , 2 , 3 , 4 This is especially true for primary care physicians, who face particularly high EHR burden. 5 , 6 , 7 There has been some attention to the broader systemic challenges contributing to burden, most notably a multi‐payer environment and litigious concerns that promote over‐documentation among US physicians. 8 , 9 These factors, coupled with productivity pressures, increase total work stress and work time—time that is inextricably tied to the EHR. 10 However, federal policy changes aimed at these contributors to burden have been slow to drive changes in documentation patterns and have so far not been reflected in reduced EHR time. 11 Further downstream, care delivery organizations actively pursue training and support programs targeted at individual end‐users to optimize EHR use. 12 , 13 While such programs have achieved some meaningful improvements among program participants in terms of efficiency and satisfaction, they are difficult to scale and continue to place the onus for work system optimization on the individual user.
Organizations are situated between the high‐level policy environment and the end‐user and have broad agency in shaping health IT systems and physician behavior. 4 , 14 Individual organizations can, for example, work with their vendor and internal informatics team to make design and implementation decisions (e.g., order set customizations or workflow redesigns) that shape usage. 15 Under federal EHR incentive programs, care delivery organizations were responsible for making these decisions in pursuit of meaningful use, but ease of use was never explicitly incentivized, nor supported via EHR vendor certification requirements. The resulting flexible ways in which organizations structured the local EHR environment led to the oft‐cited “if you've seen one EHR, you've seen one EHR” refrain. While organizations actively making differentiated design choices that could be associated with optimized and thus more consistent internal EHR usage practices among physicians, evidence of variation in individual EHR user patterns suggests a reality of personalized preferences dominating over organizational structuring. 16 , 17 This may be because organizational design choices are more about content (e.g., what items populate a pick list and what modules appear in an admission workflow) and less about how the work activities get done. Physicians are able, and often encouraged, to take it upon themselves to optimize what “better” EHR use looks like for them—especially when this individualization aligns with organizations' desires to avoid accusation of inappropriately protocolizing medical practice.
Guiding enhanced organizational efforts around optimizing the EHR use experience requires new definition and measurement. 4 Most literature on EHR burden defines “better” as lower with respect to time spent in the EHR. 18 It could also be operationalized as the use of vendor efficiency tools, for example, templates, macros, and copy/paste, designed to support documentation completion. However, less time is not necessarily always better—for example, more time in notes or in clinical review could be associated with less pressured, more thoughtful care. 19 Similarly, greater use of vendor efficiency tools can be helpful for note completion but are often far from ideal, leading to bloated notes that camouflage the clinically relevant details and can add to burden and inefficiency. 20 Therefore, at the organizational level, trying to infer the extent to which the work system is being actively configured to optimize use patterns likely needs to reflect more than just the average time spent on a task or extent of tool usage. Also important is within‐organization consistency—the distributional spread of physician performance on a measure within an organization. A certain amount of variation must be preserved to accommodate differences in patient clinical needs and operational sub‐units that operate differently from one another; completely monolithic approaches to EHR use are neither feasible nor desirable. However, addressing inappropriate variation, completing workflows differently due to varying preferences or inferred appropriateness in an environment of high optionality, 17 offers important improvement opportunities for care delivery organizations. Management support of work systems can facilitate or impede physician experience by reinforcing norms and allocating resources to support work practices but it depends on how well user needs can be anticipated through more predictable and routine user behaviors. 21 , 22
Use of the EHR is just one component of a physician's work but is often embedded in a way that makes burden deeply salient. Understanding organizational influence, capturing to what extent organizations are shaping consistent EHR use behavior, is a crucial step toward crafting responsive policy aimed at addressing this burden. Using a novel source of national data on ambulatory EHR use by primary care physicians across several hundred organizations, we pursue the following research aims. We first characterize the extent of differences across organizations in physicians' behavior across a range of EHR use measures. We then estimate the extent to which there is an observable organizational signature that helps describe physician EHR use behavior. Specifically, we assess the degree of organizational clustering of behaviors (i.e., within‐organization consistency) to estimate how closely physicians within the same organization resemble each other's EHR use behaviors more so than physicians observed in other organizations. Finally, we aim to identify whether organizational differences in internal consistency has any association with physician‐level estimations of efficiency. Specifically, is there some observable benefit to physicians from being in high‐ versus low‐consistency organizations? Ultimately, understanding and leveraging the organizational influence in shaping EHR use patterns is critical for policy and health system action that supports burden reduction.
2. METHODS
2.1. Data
We use data on a national sample of US primary care physicians across all organizations that use an Epic ambulatory EHR. Primary care specialties include internal medicine, family medicine, pediatrics, obstetrics and gynecology, geriatrics, and sports medicine. Data on EHR use behaviors for these physicians were extracted at the physician‐week level of observation from the Epic Signal data warehouse. 5 , 10 , 18 , 23 Our study period covered September 2020 through May 2021. Data were then aggregated to a cross‐sectional physician‐level dataset. Because our analyses look at within‐organization variation, we only included organizations with 50 or more primary care physicians who could be included for analysis. This study was deemed exempt from the institutional review board for human subjects research.
2.2. Measures
We use a total of 10 EHR use measures for analysis. Six measures represent measures of time spent in the EHR across the following domains: orders, chart review, notes, messaging, time spent outside of scheduled hours, and total time in the EHR. Epic calculates “active time” in the EHR for each physician‐week as the sum of time during which the physician was actively engaged with the EHR system. Based on prior examinations of this methodology, these estimates should be considered lower‐bound estimates of time spent in the EHR. 23 , 24 All time‐based measures were standardized at the encounter level (e.g., time in orders per visit) to account for variation in physicians' day‐to‐day schedules. 23 We also include three measures that represent documentation composition. This includes average encounter note length (characters per note) as well as use of vendor efficiency tools—both SmartTools (i.e., macros for templated text) and copy/paste, measured as the proportion of note text authored via each of these methods. Finally, we include a measure of note closure efficiency, the proportion of visits closed out on the same day as the visit occurred—as an outcome variable that may be sensitive to the level of organizational consistency in EHR use that organizations provide for their physician population. 20 While this is neither a perfect nor comprehensive measure for the broader concept of operational efficiency that we are interested in measuring, it is more sensitive to burdensome EHR design than a traditional but more blunt measure such as weekly visit volumes.
2.3. Analytic approach
To address our first research aim of characterizing the extent of differences across organizations in physicians' EHR behavior, we calculated measure‐specific organizational level means and SDs. We are interested, for each measure, in the organizational distribution of both of these indicators (Figure 1). We use total EHR time per visit as an example. The distribution of organizational means represents average physician EHR time across organizations, and variation across organizations in average physician EHR time. The distribution of organizational SDs represents average degree of internal consistency across organizations with respect to total EHR time, and variation across organizations in the degree of internal consistency observed with this measure. For each EHR use measure, we constructed ratios of the organizational observations at the 90th percentile compared with the 10th percentile. 17 , 25 We do this both for the distribution of means and for the distribution of SDs. This allowed us to compare which measures (across time allocation and note composition strategy) had the largest differences in organizational behavior at the high versus low ends of the distribution.
FIGURE 1.

Visual representation of constructing measures that represent across‐organization differences in physician electronic health record (EHR) use behaviors.
Next, to estimate the extent to which an organizational signature exists in explaining physician EHR use behaviors, we ran a variance partitioning model to assess the amount of observed variation in EHR use explained by grouping physicians according to their organization. We used simple mixed level models for each EHR use measure, predicting physicians' average estimated value for that measure as a function of random effects at the physician, specialty, and organizational levels. We then ran post‐estimation calculations of the intra‐class correlation (ICC) at each level of random effect. This ICC indexes how much each grouping structure helps to explain observed variation in each dependent variable (i.e., each EHR use measure), ranging from 0 to 1. The higher the ICC, the more we can expect that physician observations within a grouping structure (e.g., an organization) resemble each other compared with observations across grouped structures.
For our final research aim, we sought to analyze whether there is an observable benefit to physicians practicing in high‐ versus low‐consistency organizational environments (with respect to EHR use). To do this, we used organizations' SDs of physician performance on each measure to sort organizations into quartiles of observed internal consistency. Sorting is measure‐specific, so an organization could be in Quartile 2 for “time in clinical review,” but Quartile 4 for “use of copy/paste.” We then ran 10 physician‐level multivariable OLS models, one for each EHR use measure. Each model used our physician‐level measure of note closure efficiency as the dependent variable. Our independent variable of interest is the constructed indicator of the internal consistency quartile in to which that physician's organization was sorted for that EHR use measure (Quartile 1 represents the lowest deviation/highest internal consistency). These models controlled for physician mean performance on that measure, physician specialty, and organizational size (e.g., number of physicians, categorized by small [50–222], medium [223–425], and large [426–1447]). All models used robust standard errors clustered at the organization level.
3. RESULTS
Our sample includes 75,124 US primary care physicians across 299 organizations. We removed three organizations from analysis where total time in the EHR represented extreme outlier values. Physicians were primarily family medicine (39.8%, N = 29,897) and general internal medicine (25.6%, N = 19,252), followed by pediatrics (18.1%, N = 13,569) and OB/Gyn (14.4%, N = 10,806) specialties. Median organizational size, already restricted to practices above 50 providers, was 162 physicians (SD: 205).
3.1. Across‐organization differences
Summarized organizational means and organizational SDs for all measures of visit‐normalized time in the EHR and descriptors of EHR documentation composition are listed in Table 1. Histograms depicting the range of these values across organizations can be found in Figures A1 and A2. At the median organization, total time in the EHR per visit averaged 22.9 min per visit; time spent per visit in specific EHR domains at the median organization averaged between 3 and 4 min with the exception of 8.14 min per appointment spent on notes. At the median organization, the SD for total time in EHR, a measure of internal consistency observed within an organization across its physicians, was 20.7 min. Organizations above the median have achieved less internal organizational consistency and those below the median have achieved greater internal consistency of observed physician behavior.
TABLE 1.
Summary statistics of internal physician variation in electronic health record (EHR) use behaviors, across organizations (N = 299 organizations).
| Average organizational mean | Means: 90th/10th percentile ratio | Average organizational internal provider consistency (SD) | Internal provider consistency: 90th/10th percentile ratio | |
|---|---|---|---|---|
| Total time in EHR per visit (min) | 23.50 (5.9) | 1.94 | 20.72 (8.99) | 3.55 |
| Time in notes | 8.46 (2.40) | 2.08 | 7.91 (3.66) | 3.23 |
| Time in orders | 3.46 (0.81) | 1.77 | 2.43 (1.10) | 2.45 |
| Time in in‐basket | 3.35 (1.14) | 2.56 | 4.28 (2.08) | 5.31 |
| Time in clinical review | 3.95 (1.16) | 2.25 | 4.55 (2.40) | 4.02 |
| Time outside of encounters | 4.13 (1.48) | 2.34 | 4.84 (1.61) | 2.64 |
| Documentation length (characters) | 4033 (831) | 1.71 | 2033 (507) | 1.90 |
| Use of SmartTools (% of note text) | 59.4% (9.6) | 1.48 | 19.2 (3.1) | 1.56 |
| Use of copy/paste (% of note text) | 6.2% (2.7) | 3.06 | 11.0 (3.6) | 2.23 |
Ratios that compare observations at the 90th percentile with the 10th percentile of the distribution represent the magnitude of difference observed between high‐use versus low‐use organizations (when looking at organizational means) and low‐consistency versus high‐consistency organizations (when looking at organizational internal deviations). Ratios of means demonstrate greatest variation in average EHR use across organizations with respect to use of copy/paste (90/10 ratio: 3.06), time in in‐basket (2.56) and time outside of encounters (2.34). Organizational averages were the most tightly clustered at the mean for use of SmartTools (1.48), documentation length (1.71) and time in orders (1.77).
We also find wide variation across organizations with respect to internal provider consistency (measured with organization‐level SD). Organizations varied the most from one end of the distribution compared with the other with respect to time in in‐basket (90/10 ratio: 5.31) and time in clinical review (4.02). Indicators of organizational consistency were more tightly clustered for time in orders (2.45) and with respect to note composition strategies. For example, the SD of SmartTools use in low‐consistency organizations was only 1.56 times higher than that observed in high‐consistency organizations.
3.2. Estimating organizational signature
When we run simple mixed effect models, predicting physician behavior in each domain of EHR use as a function of a physician‐, specialty‐, and organization‐level random effects, we find that the organizational level of clustering accounts for relatively little observed variation in EHR use behaviors (Figure 2). Organizational identification helps to explain relatively more of physicians' time‐based behavior in orders (11.3%) than it does for notes (6%) or clinical review (6.6%). Among documentation composition measures, use of SmartTools is the most organizationally attributed behavior (20% of observed behavioral variation), followed by note length (13%). However, across all but one measure, the vast majority of behavioral variation is attributable to the individual physician. One notable exception is the significant role of specialty in explaining observed time in the EHR outside of encounters (48% of total variance).
FIGURE 2.

Extent of observed variation in electronic health record (EHR) use measures explained by physician, specialty, and organization‐level clustering. [Color figure can be viewed at wileyonlinelibrary.com]
3.3. Relationship between organizations' internal consistency and physician efficiency
When we sorted organizations in to quartiles of internal consistency, we observed a fair amount of stability in which quartile an organization has been sorted in to across our range of measures. The observed pairwise correlation of quartile placement across measures for these organizations ranged from 0.42 to 0.87 (Table A1), with two exceptions. Correlations were notably low between time in orders and use of SmartTools or copy/paste (0.26 and 0.23, respectively) and between documentation length and all other measures (observed correlation 0.12–0.27).
Results from our physician‐level models assessing the relationship between our physician efficiency measure, same‐day visit closure rate, and internal organizational consistency in physician performance are summarized in Figure 3. Full regression results that include controls for physician specialty and practice size can be found in Table A2. When interpreting this figure, Quartile 1 represents the highest internal consistency (e.g., the lowest internal variation). Quartile 4 represents the lowest internal consistency (e.g., the highest internal deviation).
FIGURE 3.

Regression results, percentage point differences in estimated physician same‐day visit closure rate associated with organizational internal variation in physician electronic health record (EHR) use behavior. *p < 0.05; **p < 0.01; ***p < 0.001. Our findings show that nearly all coefficients are negative. This means that, relative to organizations with the highest internal consistency, being in an organization with lower internal consistency is associated with a worse outcome (lower note completion efficiency). Each model controls for physician average performance level on that measure, physician specialty, and organizational size. [Color figure can be viewed at wileyonlinelibrary.com]
We found the largest magnitude relationships between internal organizational consistency and physician same‐day visit closure rate when examining consistency in time in notes, time in clinical review, in‐basket time, and use of SmartTools. For example, physicians in a Quartile 1 organization (e.g., organizations with the highest internal consistency) with respect to time in notes had estimated same‐day visit closure 2.67 percentage points (pp) higher than physicians in a Quartile 2 organization (p = 0.01); this relationship strengthens for physicians in Quartile 3 (β = −3.29 pp; p = 0.002) and in Quartile 4—the organizations with the lowest internal consistency (β = −4.15 pp; p < 0.001). Differences with respect to outside EHR time and note length were only significant between the lowest and highest quartile. Differences across quartiles with respect to time in orders was found to be largely insignificant.
4. DISCUSSION
Using a national dataset of descriptive measures that reflect primary care physicians' EHR use across 300 organizations, we find that organizations vary substantially on measures of EHR time allocation and note composition strategies. This variation exists across organizations in two dimensions. First, organizations vary in average physician behavior—for example, the amount of time the mean physician spends on notes per visit in one organization differs compared with the mean physician in another. This is perhaps expected, as organizations have different operational models and may configure their systems and workflows accordingly. However, our variance partitioning model results suggest little organizational signature with respect to how physicians in one organization use a given EHR feature compared with physicians in another. With the exception of content completion features that seem to have more intraorganizational consistency (i.e., use of SmartTools and time in orders which is often heavily shaped by use of predefined workflows and picklists), we find that organizational clustering accounted for just 5%–7% of total observed variance across EHR use measures. Organizational effects are largely overshadowed by specialty and individual physician differences, suggesting relatively weak organizational influence on how EHR‐supported work gets done. As the realities of EHR‐associated work burden continue to threaten job satisfaction and quality of life among physicians, policymakers may need to offer organizations more explicit guidance and incentives to optimize socio‐technical work environments.
We also examined differences across organizations with respect to the extent of internal consistency observed among their affiliated physicians. While the average organization might not be configuring their systems to optimally structure and support routine workflow, some organizations might be doing a better job of this than others. Indeed, measures of internal consistency do vary widely across organizations. For example, the SD of within‐organization physician averages was 5.3 times as large for EHR in‐basket time at the 90th percentile organization compared with the 10th percentile. This variation matters: physicians in organizations with higher internal consistency have higher same‐day visit closure rates (improved efficiency) compared with peers performing at the same level, in the same primary care subspecialty and in same‐sized practices but with lower organizational consistency. This analysis provides suggestive evidence that intentional efforts to shape work systems may pay operational dividends. To continue to build this evidence base, interventional and quasi‐experimental research evaluating the effects of changes in institutional facilitation of EHR‐supported work on not just operational efficiency, but also physician quality of life and patient care quality is necessary. 4 Future analyses must continue to parse out the interdependent nature of organizational levels of EHR use alongside consistency of use—consistently high EHR use organizations and consistently low EHR use organizations represent substantially different environments in terms of how EHR work is integrated in to the everyday practice of medicine. Similar to non‐linear relationships found between EHR use and efficiency at the individual level, 20 we anticipate a similar dynamic might hold true at the organizational level—neither particularly low and particularly high levels of EHR use represent an ideal level at which to build consistent practices.
Given these findings, we posit that organizations can be doing more to promote EHR optimization. End‐user customization, training, and support are important but lack scalability and place the onus on the individual physician to make the EHR work for them. Our results show that some organizations have been successful in promoting consistent internal use patterns, specifically with respect to time spent on orders. Order set construction has been a major focus of development and implementation optimization—not only for the clinical importance of this function, but also likely because it relates directly to billing and reimbursement. We also observed more consistency with use of note composition tools (SmartTools and copy/paste). These tools are a first approach to facilitating EHR use, but their utility is often compromised by a tendency to also promote note bloat and dilute note value. Organizational governance around customizations and maintenance are essential. 16 Pivoting to address other areas with high internal variation—specifically, time spent on in‐basket messaging and time in clinical review—represent key areas to improve the physician work experience. Despite significant individual variation in work patterns, physicians do tend to sort into a manageable (i.e., 4–6) number of user phenotypes. 26 Phenotyping may provide a useful middle ground for organizations to design and structurally support optimized tools and workflows that better meet physicians' needs.
Ultimately, reimagining informatics design and use—not just in what gets done for a patient, but how a care team does coordinated work—requires that organizations leverage intrinsic and extrinsic motivators for change. External motivation (i.e., rewarding or penalizing users to encourage specific behaviors) is perhaps easier to tangibly implement but may risk decoupling the goals of documentation consistency from workflow completion that is actually of high value. One approach may be organizational efforts to translate extrinsic policy updates into facilitated practice change. Recent evidence illustrates that documentation of primary care visits has been slow to change in response to federally payment policy updates; this suggests that organizations have substantial opportunity to make these system changes more salient to practicing doctors and build new systems shaped to support needed updated behaviors. 11 For example, this might be automatic identification of unnecessary text that physicians can be prompted to remove or proactive identification and system solutions to lack of routine practices. Leaders are also well‐positioned to address intrinsic motivation, specifically organizational climate, and expectations around the importance of consistent EHR practices. As aggregated data play an increasingly significant role in shaping the practice environment (i.e., payment and predictive tools), physicians need to buy in to why documentation consistency is important. This is both facilitated by and demonstrated via engagement in the system‐level changes needed to realize this goal. Physicians need the time and encouragement to be willing partners in these efforts, ceding some ground on individuality in user behaviors to help build consensus on what shared, efficient work systems should look like. Engagement with governance structures, and peer‐to‐peer change management support, may help physicians not only identify their own areas of inertia but also advocate for needed organization‐level changes.
4.1. Limitations
This analysis has a few key limitations. First, our dataset, though substantial in size, only includes users of a single vendor product and may not be fully representative of primary care physicians nationwide. However, Epic serves the largest number of ambulatory EHR users by market share and includes a wide range of organizations including academic centers and safety‐net organizations. We also, by design, have excluded organizations in this analysis with under 50 physicians. As both challenges and solutions related to EHR optimization may look different in smaller organizations, it is critical that subsequent work not focus exclusively on large organizations. Second, we have limited understanding of the types of patients being seen by any organization in our dataset. We have restricted this analysis to only primary care physicians, and control for subspecialty, but are unable to directly observe differences in patient population profile. Third, the measures we use to describe EHR behavior are defined by and limited to those used on the Epic Signal platform. These are weekly averaged measures, and blunt indicators of how physicians actually experience EHR use and associated known burdens (i.e., our measures do not capture excessive clicks or workflow patterns). However, use of these defined measures allow us to examine differences across organizations on a national scale impossible with custom created EHR measures or time and motion studies. Finally, all analyses presented are descriptive in nature. Our analysis of association between organizational internal variation and physician‐level visit closure efficiency is not able to imply causality.
4.2. Policy implications
Policymakers have a key role to play in guiding organizational efforts around improved EHR‐supported work systems. From an informatics perspective, continued efforts led by the Office of the National Coordinator (ONC) to improve vendor focus on usability will be critical. The EHR Reporting program already prioritizes functional usability, a key predecessor to consistent use practices, for features used in interoperable data sharing. ONC is well‐positioned to ramp up and extend usability requirements for developers to achieve ongoing certification and to oversee the spread and scale of optimized system solutions either through developer‐specific networks or the facilitation of community‐based entities that convene, promote, and support local organizations working on system optimization efforts. 27 In addition to this work, policy attention on EHR usability needs to extend and integrate with other federal administrative bodies (for example, the CMS Office of Burden Reduction and Health Informatics) and national efforts to promote clinician wellbeing. The importance of consistent data practices for secondary use of EHR data, alongside the deeply embedded ways that EHR use shapes the patient and provider experience, indicates that organizational performance with respect to EHR optimization be considered more holistically as a measure of progress toward system value in delivery reform initiatives. Major industry efforts, like the adoption of Lean Six Sigma, are predicated on the consistency‐quality relationship, where consistency in practice is an important intermediate process goal that enables important end goals of organizational efficiency, improved provider experience, and enhanced patient care. Though extreme caution should be followed in designing measures so that they do not promote “one size fits all” practice of medicine, results from this analysis suggest that targeting internal consistency of organizational EHR use practices could be a useful indicator of efforts to optimize the work system for physicians and for patients.
5. CONCLUSION
This analysis of more than 75,000 primary care physicians practicing at nearly 300 care delivery organizations demonstrates substantial organizational differences in both the level and consistency of physician EHR use. We provide evidence suggesting an association between higher internal consistency in organizations' EHR user behavior and higher physician same‐day visit closure rates, an important measure of operational efficiency. Our results suggest organizations can be doing more to optimize how EHR‐based work gets done at a system level, building on early content‐focused development successes (e.g., templated note completion, order sets) and extending toward high‐variation, high‐burden aspects of how work gets done, such as time managing email messages. We suggest policymakers continue to promote EHR usability and scaling of best practices through vendor certification and reporting programs and by considering organizational performance with respect to EHR optimization as a measure of progress toward system value in future delivery reform initiatives.
FUNDING INFORMATION
DAC is supported by the National Institutes of Health's National Center for Advancing Translational Sciences, grants KL2TR002492 and UL1TR002494 at the University of Minnesota.
ACKNOWLEDGMENTS
Authors would like to thank Chris Gates from Epic Systems for providing the data for this study, and members of the National Research Network for EHR Audit Log Data who provided feedback on an early draft of this work.
FIGURE A1.

Histograms, organizational means of electronic health record (EHR) use measures (N = 299). [Color figure can be viewed at wileyonlinelibrary.com]
FIGURE A2.
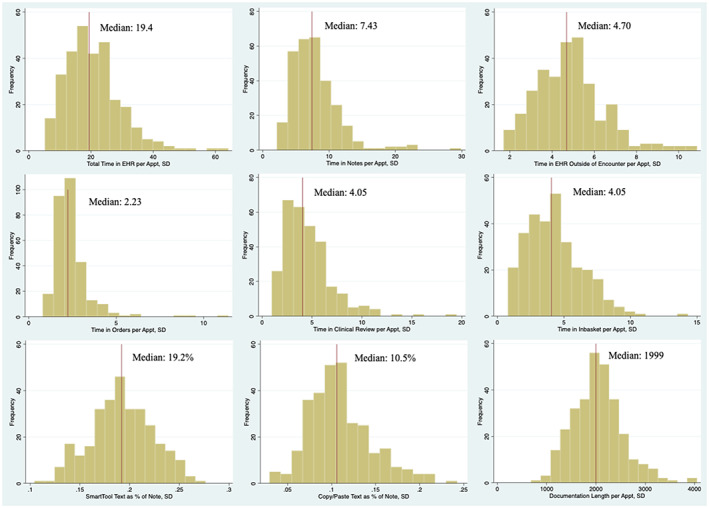
Histograms, organizational SDs of electronic health record (EHR) use measures (N = 299). [Color figure can be viewed at wileyonlinelibrary.com]
TABLE A1.
Correlation matrix, organizational quartiles of internal physician variation across each electronic health record (EHR) use measure.
| Total time in EHR | Outside time in EHR | Time in orders | Time in notes | Time in inbasket | Time in clinical review | Documentation length | Use of smart tools | Use of copy/paste | |
|---|---|---|---|---|---|---|---|---|---|
| Total time in EHR | 1 | ||||||||
| Outside time in EHR | 0.638 | 1 | |||||||
| Time in orders | 0.629 | 0.478 | 1 | ||||||
| Time in notes | 0.764 | 0.588 | 0.506 | 1 | |||||
| Time in Inbasket | 0.718 | 0.523 | 0.452 | 0.495 | 1 | ||||
| Time in clinical review | 0.869 | 0.531 | 0.572 | 0.667 | 0.651 | 1 | |||
| Documentation length | 0.200 | 0.152 | 0.140 | 0.201 | 0.117 | 0.203 | 1 | ||
| Use of SmartTools | 0.555 | 0.437 | 0.261 | 0.479 | 0.421 | 0.539 | 0.208 | 1 | |
| Use of copy/paste | 0.437 | 0.412 | 0.234 | 0.417 | 0.375 | 0.453 | 0.271 | 0.562 | 1 |
TABLE A2.
Full regression results, estimation of physician same‐day visit closure rates.
| Total time in EHR | Time in orders | Outside EHR time | Time in notes | Clinical review time | Inbasket time | SmartTools | Copy/paste | Note length | |
|---|---|---|---|---|---|---|---|---|---|
| Specialty (ref: family medicine) | |||||||||
| Internal Med | 0.00756* (0.00453) | 0.00462 (0.00503) | 0.0161*** (0.00416) | 0.00587 (0.0045) | 0.0067 (0.00474) | 0.0049 (0.0045) | −0.00266 (0.00477) | 0.00615 (0.00439) | −1.75E‐05 (0.00534) |
| Pediatrics | 0.00134 (0.00466) | −0.0153*** (0.00527) | 0.00413 (0.00444) | 0.00823* (0.00467) | 0.00137 (0.00487) | −0.00449 (0.00511) | 0.00376 (0.00508) | 0.00369 (0.00487) | 0.00526 (0.00522) |
| Other | −0.032*** (0.00981) | −0.054*** (0.00949) | −0.014 (0.0103) | −0.022** (0.0101) | −0.039*** (0.00936) | −0.048*** (0.00916) | −0.059*** (0.00921) | −0.041*** (0.00938) | −0.054*** (0.00954) |
| OB/Gyn | 0.0414*** (0.00469) | 0.0269*** (0.00541) | 0.0384*** (0.00434) | 0.0435*** (0.0046) | 0.0452*** (0.00458) | 0.0434*** (0.00471) | 0.0468*** (0.00458) | 0.0572*** (0.00465) | 0.0395*** (0.00505) |
| Practice size (ref: small) | |||||||||
| Medium | 0.0180*** (0.0065) | 0.0146** (0.0069) | 0.0156** (0.00622) | 0.0197*** (0.00661) | 0.0182*** (0.00677) | 0.0197*** (0.00685) | 0.0118* (0.00711) | 0.0135* (0.00672) | 0.0131 (0.00724) |
| Large | 0.0288** (0.0113) | 0.0284** (0.011) | 0.0231** (0.0102) | 0.0321*** (0.011) | 0.0296*** (0.0103) | 0.0298*** (0.011) | 0.0171* (0.00986) | 0.0241* (0.0105) | 0.0167 (0.0103) |
| Individual physician measure avg | −0.0013*** (0.0009) | −0.01*** (0.0012) | −0.010*** (0.00042) | −0.0035*** (0.00039) | −0.0046*** (0.00039) | −0.0055*** (0.00056) | −0.00254 (0.0089) | −0.195*** (0.0147) | −0.0007*** (8.36E‐05) |
| Organizational internal variation (ref: 1st quartile) | |||||||||
| Second quartile | −0.0157 (0.0114) | −0.0132 (0.0116) | −0.00337 (0.0131) | −0.0267* (0.0103) | −0.0210 (0.012) | −0.0251* (0.0127) | −0.0112 (0.0121) | −0.0192 (0.00936) | −0.00281 (0.0136) |
| Third quartile | −0.0314** (0.0113) | −0.0169 (0.0137) | −0.0199 (0.0119) | −0.0329** (0.0104) | −0.0394** (0.0128) | −0.0299* (0.0123) | −0.0304** (0.0109) | 0.00553 (0.00979) | −0.0122 (0.00989) |
| Fourth quartile | −0.0377** (0.012) | −0.0215 (0.0126) | −0.0303* (0.0124) | −0.0415*** (0.0107) | −0.0375*** (0.0112) | −0.0378** (0.0119) | −0.043*** (0.0112) | −0.038*** (0.00999) | −0.0269** (0.00965) |
| Constant | 0.828*** (0.00889) | 0.828*** (0.0105) | 0.829*** (0.00966) | 0.828*** (0.00827) | 0.818*** (0.00954) | 0.818*** (0.00895) | 0.802*** (0.00968) | 0.798*** (0.00678) | 0.817*** (0.00881) |
| Observations | 75,053 | 72,682 | 73,703 | 72,698 | 75,047 | 74,946 | 74,904 | 74,904 | 74,905 |
| R 2 | 0.032 | 0.024 | 0.059 | 0.034 | 0.026 | 0.024 | 0.012 | 0.022 | 0.014 |
Note: A negative coefficient represents that, relative to the reference group, that descriptor has a worse outcome (lower note completion efficiency).
Abbreviation: EHR, electronic health record.
p < 0.05;
p < 0.01;
p < 0.001.
Cross DA, Holmgren AJ, Apathy NC. The role of organizations in shaping physician use of electronic health records. Health Serv Res. 2024;59(1):e14203. doi: 10.1111/1475-6773.14203
REFERENCES
- 1. Gardner RL, Cooper E, Haskell J, et al. Physician stress and burnout: the impact of health information technology. J Am Med Inform Assoc. 2019;26:106‐114. doi: 10.1093/jamia/ocy145 [DOI] [PMC free article] [PubMed] [Google Scholar]
- 2. Rotenstein LS, Torre M, Ramos MA, et al. Prevalence of burnout among physicians: a systematic review. JAMA. 2018;320:1131‐1150. doi: 10.1001/jama.2018.12777 [DOI] [PMC free article] [PubMed] [Google Scholar]
- 3. Yan Q, Jiang Z, Harbin Z, Tolbert PH, Davies MG. Exploring the relationship between electronic health records and provider burnout: a systematic review. J Am Med Inform Assoc. 2021;28(5):1009‐1021. [DOI] [PMC free article] [PubMed] [Google Scholar]
- 4. Melnick ER, Sinsky CA, Shanafelt T. Funding research on health workforce well‐being to optimize the work environment. JAMA. 2023;329(14):1145‐1146. [DOI] [PubMed] [Google Scholar]
- 5. Rotenstein LS, Holmgren AJ, Downing NL, Bates DW. Differences in total and after‐hours electronic health record time across ambulatory specialties. JAMA Intern Med. 2021;181(6):863‐865. [DOI] [PMC free article] [PubMed] [Google Scholar]
- 6. Arndt BG, Beasley JW, Watkinson MD, et al. Tethered to the EHR: primary care physician workload assessment using EHR event log data and time–motion observations. Ann Fam Med. 2017;15(5):419‐426. [DOI] [PMC free article] [PubMed] [Google Scholar]
- 7. Overhage JM, McCallie D Jr. Physician time spent using the electronic health record during outpatient encounters: a descriptive study. Ann Intern Med. 2020;172(3):169‐174. [DOI] [PubMed] [Google Scholar]
- 8. Auerbach AD, Khanna R, Adler‐Milstein J. Letting a good crisis go to waste. J Gen Intern Med. 2020;35(4):1289‐1291. [DOI] [PMC free article] [PubMed] [Google Scholar]
- 9. Downing NL, Bates DW, Longhurst CA. Physician burnout in the electronic health record era: are we ignoring the real cause? Ann Intern Med. 2018;169(1):50‐51. [DOI] [PubMed] [Google Scholar]
- 10. Holmgren AJ, Downing NL, Bates DW, et al. Assessment of electronic health record use between US and non‐US health systems. JAMA Intern Med. 2021;181(2):251‐259. [DOI] [PMC free article] [PubMed] [Google Scholar]
- 11. Apathy NC, Hare AJ, Fendrich S, Cross DA. Early changes in billing and notes after evaluation and management guideline change. Ann Intern Med. 2022;175(4):499‐504. [DOI] [PubMed] [Google Scholar]
- 12. McCoy AB, Russo EM, Johnson KB, et al. Physician collaboration to improve clinical decision support: the Clickbusters initiative. J Am Med Inform Assoc. 2022;29:1050‐1059. doi: 10.1093/jamia/ocac027 [DOI] [PMC free article] [PubMed] [Google Scholar]
- 13. DiAngi YT, Stevens LA, Halpern‐Felsher B, Pageler NM, Lee TC. Electronic health record (EHR) training program identifies a new tool to quantify the EHR time burden and improves providers' perceived control over their workload in the EHR. JAMIA Open. 2019;2(2):222‐230. [DOI] [PMC free article] [PubMed] [Google Scholar]
- 14. National Academies of Sciences, Engineering, and Medicine; National Academy of Medicine; Committee on Systems Approaches to Improve Patient Care by Supporting Clinician Well‐Being. Taking Action Against Clinician Burnout: A Systems Approach to Professional Well‐Being. National Academies Press; 2019. [PubMed]
- 15. Sittig DF, Ash JS, Wright A, et al. How can we partner with electronic health record vendors on the complex journey to safer health care? J Healthc Risk Manag. 2020;40:34‐43. doi: 10.1002/jhrm.21434 [DOI] [PubMed] [Google Scholar]
- 16. Rule A, Hribar MR. Frequent but fragmented: use of note templates to document outpatient visits at an academic health center. J Am Med Inform Assoc. 2022;29:29‐141. doi: 10.1093/jamia/ocab230 [DOI] [PMC free article] [PubMed] [Google Scholar]
- 17. Cohen GR, Friedman CP, Ryan AM, Richardson CR, Adler‐Milstein J. Variation in physicians' electronic health record documentation and potential patient harm from that variation. J Gen Intern Med. 2019;34(11):2355‐2367. [DOI] [PMC free article] [PubMed] [Google Scholar]
- 18. Rule A, Melnick ER, Apathy NC. Using event logs to observe interactions with electronic health records: an updated scoping review shows increasing use of vendor‐derived measures. J Am Med Inform Assoc. 2022;30:144‐154. [DOI] [PMC free article] [PubMed] [Google Scholar]
- 19. Rotenstein LS, Holmgren AJ, Healey MJ, et al. Association between electronic health record time and quality of care metrics in primary care. JAMA Netw Open. 2022;5(10):e2237086. doi: 10.1001/jamanetworkopen.2022.37086 [DOI] [PMC free article] [PubMed] [Google Scholar]
- 20. Apathy NC, Rotenstein L, Bates DW, Holmgren AJ. Documentation dynamics: note composition, burden, and physician efficiency. Health Serv Res. 2022;58:674‐685. [DOI] [PMC free article] [PubMed] [Google Scholar]
- 21. Becker MC. Organizational routines: a review of the literature. Ind Corp Change. 2004;13(4):643‐678. [Google Scholar]
- 22. Jasperson J, Carter PE, Zmud RW. A comprehensive conceptualization of post‐adoptive behaviors associated with information technology enabled work systems. MIS Q. 2005;29(3):525‐557. [Google Scholar]
- 23. Baxter SL, Apathy NC, Cross DA, Sinsky C, Hribar MR. Measures of electronic health record use in outpatient settings across vendors. J Am Med Inform Assoc. 2020;28:955‐959. doi: 10.1093/jamia/ocaa266 [DOI] [PMC free article] [PubMed] [Google Scholar]
- 24. Melnick ER, Ong SY, Fong A, et al. Characterizing physician EHR use with vendor derived data: a feasibility study and cross‐sectional analysis. J Am Med Inform Assoc. 2021;5:1383‐1392. doi: 10.1093/jamia/ocab011 [DOI] [PMC free article] [PubMed] [Google Scholar]
- 25. Schwartz AL, Jena AB, Zaslavsky AM, McWilliams JM. Analysis of physician variation in provision of low‐value services. JAMA Intern Med. 2019;179(1):16‐25. [DOI] [PMC free article] [PubMed] [Google Scholar]
- 26. Fong A, Iscoe M, Sinsky CA, et al. Cluster analysis of primary care physician phenotypes for electronic health record use: retrospective cohort study. JMIR Med Inform. 2022;10(4):e34954. [DOI] [PMC free article] [PubMed] [Google Scholar]
- 27. Lynch K, Kendall M, Shanks K, et al. The Health IT Regional Extension Center Program: evolution and lessons for health care transformation. Health Serv Res. 2014;49(1pt2):421‐437. [DOI] [PMC free article] [PubMed] [Google Scholar]