

Abstract
We evaluated the validity and reproducibility of a semiquantitative food frequency questionnaire (FFQ) for measuring intakes of 149 foods and 25 food groups among 736 participants of the Women’s Lifestyle Validation Study (WLVS, 2010–2012) and 649 participants of the Men’s Lifestyle Validation Study (MLVS, 2011–2013). Validity of the FFQ compared with two 7-day dietary records measured 6 months apart and the reproducibility between 2 FFQs administered 1 year apart (FFQ1 and FFQ2) were assessed using Spearman correlations and intraclass correlation coefficients. The average 1-year reproducibility of FFQ-measured foods was 0.64 in both the WLVS and MLVS. Reproducibility of the food groups (mean = 0.71 among women and 0.72 among men) was generally higher than that for individual foods. Among women, the average validity correlation for individual foods was 0.59 when comparing FFQ2 with the 7-day dietary records. Among men, the corresponding average validity correlation was 0.61. Compared with individual foods, food groups had slightly higher validity correlations in both women (range, 0.45–0.92; mean = 0.61) and men (range, 0.46–0.88; mean = 0.65). This study reaffirms that the FFQ performs well in measuring most foods and food groups and provides data to adjust for measurement errors in epidemiologic studies of foods and food groups.
Keywords: diet record, food frequency questionnaire, food groups, foods, reproducibility, validity
Abbreviations
- 7DDR
7-day dietary record
- BMI
body mass index
- FFQ
semiquantitative food frequency questionnaire
- HPFS
Health Professionals Follow-up Study
- HPHC
Harvard Pilgrim Health Care
- MLVS
Men’s Lifestyle Validation Study
- NHS
Nurses’ Health Study
- SSB
sugar-sweetened beverages
- WLVS
Women’s Lifestyle Validation Study
Food frequency questionnaires (FFQs) are commonly used in large population-based studies to measure long-term usual diet at relatively low cost with only a modest burden on participants. The validity of nutrient intakes measured with FFQs has been supported by strong correlations with nutrients measured with repeated dietary records and by correlations with biomarkers of diet (1–4). However, evaluations of the validity of intakes of individual foods and food groups measured with FFQs have been less frequently conducted despite the importance to nutrition research. Compared with nutrient-based analyses, results of food-based studies are more readily translatable into dietary recommendations/guidelines, as any modifications of nutrient intakes are achieved through changes in food choices. Further, food groups can capture the complex interactions among foods, account for synergistic effects, and are therefore useful to assess the healthfulness of an overall diet. Moreover, novel hypotheses linking nutrients and diseases are often generated from studies of foods or food groups (5).
Validating FFQ-measured foods or food groups against those assessed with repeated dietary records is particularly challenging. Compared with nutrient intakes, food intakes have larger day-to-day variation, and therefore, require collection of more days of intake to capture usual long-term intakes (5). However, dietary validation studies that account for within-person variation in foods are rare, due to the cost and substantial burden of collecting additional dietary records. Data processing and statistical analysis bring additional challenges. Prior to data analysis, thousands of foods recorded in detail from dietary records must be matched manually to food items with broader descriptions on the FFQ. This process is time-consuming and labor-intensive. Distributions of food intakes are usually highly skewed, necessitating the use of transformations or nonparametric rank correlations and advanced methods for obtaining correct interval estimates of rank correlation coefficients under nonnormality.
The validity of food intakes measured with the FFQs used in the Nurses’ Health Study (NHS) and Health Professionals Follow-up Study (HPFS) was evaluated approximately 30 years ago and was found to be generally good (6, 7). However, a reevaluation is needed because eating behaviors have evolved over time, and some modifications have been made in these questionnaires. For example, the number of food items has been expanded from 61 in 1980 to 116 in 1984 and over 150 in the most recent FFQ in the NHS (8, 9). Also, the validity of food group intakes assessed by FFQ, which are often used in epidemiologic analyses, has been minimally studied. In this study, we evaluated the reproducibility and validity of a semiquantitative FFQ for measuring intakes of foods and food groups using data from the Women’s and Men’s Lifestyle Validation Studies (WLVS and MLVS), conducted among subpopulations of the NHS, NHS II, and HPFS cohorts.
METHODS
Study population
The WLVS and MLVS were designed to investigate the measurement-error structure associated with self-reported diet and physical activity (1). The WLVS was conducted among a subset of the NHS and NHS II participants aged 45–80 years in 2010 (1). Participants of the MLVS, who were 46–82 years of age between 2011 and 2013, were recruited at random from the HPFS cohort and members of Harvard Pilgrim Health Care (HPHC), a Boston-area health plan (2). Detailed designs of WLVS and MLVS and the reproducibility and validity of nutrient intakes have been published elsewhere (1, 2). NHS, NHS II, and HPFS participants were eligible if they completed the 2006/2007 FFQ in the main cohorts and had previously provided blood samples. HPHC participants were recruited at random from those who had been enrolled in the plan for at least 5 years. Participants were excluded if they did not have access to broadband internet, were planning to make substantial changes in their diet or physical activity, or had a history of coronary heart disease, stroke, cancer, or major neurological disease. The WLVS enrolled 796 women, and the MLVS enrolled 914 men. In our analyses, we further excluded participants who did not complete at least 1 of the baseline and the end-of-study FFQs and the two 7-day dietary records (7DDRs) (n = 41 in the WLVS, n = 252 in the MLVS), women with FFQ-measured total daily energy intakes <500 kcal or >3,500 kcal (n = 19), and men with FFQ-measured total daily energy intakes <800 kcal or >4,000 kcal (n = 13). The final analytical population included 736 WLVS participants and 649 MLVS participants. These studies were approved by the Institutional Review Boards of the Brigham and Women’s Hospital, the Harvard T. H. Chan School of Public Health, and the Harvard Pilgrim Health Care.
Data collection in the Lifestyle Validation Studies
In both the WLVS and MLVS, two 7DDRs were collected approximately 6 months apart to capture within-person variation and seasonal fluctuation in dietary intakes over a year (Web Figure 1, available at https://doi.org/10.1093/aje/kwad170). Two paper FFQs were administered, at the baseline before collection of the 7DDRs (FFQ1) and the end of the study after the completion of all dietary records (FFQ2). Weight, height, smoking status, and demographic characteristics, including date of birth, race, and resident state, were self-reported at baseline.
The semiquantitative food frequency questionnaires
The FFQs used in the WLVS/MLVS inquired about participants’ intake of 151 foods and beverages in the previous year, specifying a portion size for each item (10, 11); 2 items on consumption of liver were asked in a different format and not included in this analysis. For each food on the questionnaire, participants were asked about the average frequency of consumption; 9 multiple-choice options ranging from never or <1 time/month to ≥6 times/day. The FFQ also included open-ended questions on the usual brand and type of margarine, cooking oil, cold breakfast cereal, multivitamins, and fat used at the table and in food preparation (1). Moreover, participants were asked to report up to 3 foods consumed more than once per week but not listed on the FFQ. Total energy intakes were computed based on an extensive food composition database (1, 2, 12).
7-Day dietary records
Weighed dietary records likely have errors that are mostly independent of errors associated with the FFQ because they do not depend on memory or perception of serving sizes; hence, this served as the comparison method in this validation study. Each participant received detailed instructions (through an instructional video and by telephone), a Primo Multifunction Kitchen Scale (Model P115NB; Escali Corporation, Burnsville, Minnesota), and a ruler (printed on the 7DDR booklet) prior to completing the first record (1, 2). To compute actual intake, participants measured and reported gram weights for foods before eating as well as the weight of any leftovers. They were also asked to provide recipes of all home-prepared foods, including the number of servings in the recipe and the portions consumed, and labels of store-brand products. Total energy intakes were derived by the Nutrition Coordinating Center at the University of Minnesota based on the Nutrition Data System for Research (NDSR 2011) (13–15).
Data processing and analysis
We matched 10,128 foods with unique food codes collected from the 7DDRs to the 149 foods listed on the FFQ based on the similarity of food descriptions. Mixed dishes were decomposed into major weight-contributing ingredients before the matching. The weight of individual ingredients was estimated in proportion to the amount in the original mixed dish. After the matching, we converted gram intakes of the 7DDR-measured foods into servings using serving sizes for 7DDR database created by the Nutrition Coordinating Center at the University of Minnesota. For foods without available 7DDR-specific serving sizes, FFQ-specific serving sizes were used. Food group intakes were calculated as the sum of the individual component foods in servings. A total of 25 food groups were included in the analyses. The composition of each food group is presented in Web Table 1. Food grouping of 7DDR-measured foods further included foods that could not be matched to specific FFQ items. We replaced missing values in dietary intakes measured with FFQs by zero, considering that the patterns of missing values were essentially at random.
We calculated means and standard deviations for the daily food/food group intakes from FFQ1 and FFQ2, and the averaged 7DDRs. For each food/food group, we also estimated the within- and between-person variation from the two 7DDRs. We used Spearman rank correlation between the FFQs and averaged 7DDRs as the measure of validity because the distributions of most foods were highly skewed, even after log-transformation. Also due to the violation of the bivariate normality assumption, the confidence limits of the validity coefficients could not be directly estimated. Therefore, we used an alternative estimator that estimates Spearman correlation coefficients based on arcsin transformation of sample probit score correlations (16). This arcsin-based estimator is more efficient than the usual estimator and allows a direct estimation of the confidence limits when the normality assumption is violated (16). An intraclass grade correlation (ICC) was also derived from the arcsin-based estimator and was used to measure the reproducibility of FFQ-measured food/food group intakes. Given that all participants in our analysis had 2 FFQ measurements, an exact 95% confidence limit of ICC was estimated based on the F-distribution with mean squares estimated from an analysis of variance of probit-transformed scores of FFQ-measured intakes (17).
Random within-person variation is large in 7DDR-measured food intakes and attenuates the validity coefficients if not corrected. Administering 7DDRs biannually is not sufficient to fully capture the usual intake of specific foods during an entire year. Therefore, we first deattenuated the sample probit score correlations using the within- and between-person variation of the two 7DDR intakes estimated from a random-effects ANOVA model on the probit scale. The deattenuated sample probit score correlations were then arcsin-transformed to reveal the corrected correlations on the rank scale. The deattenuated confidence intervals were also calculated (Web Appendix 1) (16). For 3 infrequently consumed foods, the estimated random within-person variation of 7DDR-measured food intakes was particularly high. The deattenuated sample probit score correlation would fall outside the range of −1 to 1 and therefore could not be transformed with arcsin function to estimate the corrected validity correlations and their corresponding confidence intervals. We excluded these foods when calculating the means. We regressed food/food group intakes measured with the averaged 7DDRs on those measured with FFQ2 on the probit scale to estimate the calibration coefficients. Future studies may directly use these calibration coefficients to correct associations between food/food group intake and disease outcomes for measurement error in a univariate setting (18). Notably, the coefficients are already sex-specific and were unchanged with adjustment for age (data not shown). Finally, we assessed the correlation between reproducibility and validity among the 149 foods.
As a secondary analysis, we estimated validity coefficients for each food/food group within subgroups defined by age (<70, ≥70 years), body mass index (BMI, calculated as weight (kg)/height (m)2: <25, ≥25), total energy intake (<median, ≥median, median = 1,862 kcal/day among women and 2,091 kcal/day among men), and cohort (HPFS, HPHC). We calculated the percentage difference in intakes of foods and food groups when comparing those measured with FFQ2 to those estimated from averaged 7DDRs. We also examined the correlation between validity and intakes among the 149 foods. Moreover, considering that total energy intake may introduce extraneous variations in some food/food group intakes, we adjusted all the intakes for total energy intake with the energy density method in a sensitivity analysis.
RESULTS
At baseline, participants were on average aged 62.7 years in the WLVS and 57.7 years in the MLVS. About 90% of the WLVS participants and 98% of the MLVS participants were non-Hispanic white. Our analyses in the WLVS included 334 women from the NHS and 402 women from the NHS II. The average BMI of the WLVS participants was 26.5, and 2.5% were current smokers. Our analysis in the MLVS included 469 men from the HPFS and 180 men from the HPHC. The average BMI among men was 26.1, and 1.2% of them were current smokers (Web Table 2).
Among women, total energy intake assessed by averaged 7DDRs was 9.8% lower than that assessed by FFQ1 and 6.4% lower than that assessed by FFQ2. In contrast, among men, 7DDR-measured total energy intake was 8.4% higher than that measured with FFQ1 and 10.5% higher than that measured with FFQ2 (Web Tables 3–4). In both women and men, fruits, vegetables, nuts, and whole-grain foods measured with FFQ2 were overreported when compared with those measured with averaged 7DDRs. We observed that participants substantially underreported red/processed meats, sugar-sweetened beverages, and alcoholic beverages on both FFQs. The food group analysis showed a similar under-/overreporting pattern, in which most of the perceived healthy foods were overreported through FFQs while unhealthy foods were underreported, assuming that the 7DDR-measured intakes were the true intakes (Web Tables 3–4, Web Figures 2–3). Most foods have a ratio of within-person to between-person variation in intakes greater than 1.0, indicating higher within-person variation over between-person variation (Web Tables 3–4).
Reproducibility and validity of foods and beverages
The means of food intakes measured with FFQ2 did not differ substantially from those measured with FFQ1 in both women and men. We observed that the averaged correlations between intakes measured with the 2 FFQs were 0.64 in both the WLVS and MLVS, supporting a high reproducibility of FFQ in measuring foods (Figure 1, Web Tables 5–6). More specifically, the reproducibility correlation ranged from 0.39 for “other bran added to food” to 0.86 for “red wine” among women. Men had the lowest reproducibility correlation of 0.37 for “fat-free cookies/brownies” and the highest of 0.89 for “liquor.” On average, beverages (including sugar-sweetened beverages, alcoholic beverages, etc.) had the highest reproducibility, while eggs and meat had lower reproducibility.
Figure 1.
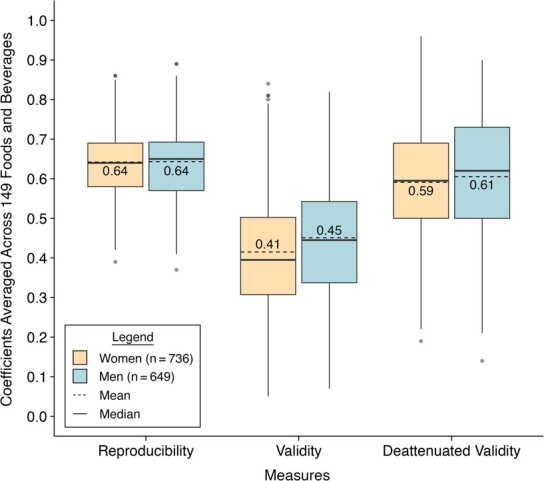
Distributions of reproducibility and validity of foods and beverages estimated with semiquantitative food frequency questionnaires in the Women’s Lifestyle Validation Study (2010–2012) and Men’s Lifestyle Validation Study (2011–2013), United States. The boxplots show the mean (dashed line in the boxes), the 25th percentile (lower edge of the boxes), the median (solid line in the boxes), the 75th percentile (upper edge of the boxes), the minimum (lower end of the whiskers), the maximum (upper end of the whiskers), and outliers (dots) of the reproducibility and validity coefficients of 149 foods and beverages. The means of the reproducibility and validity coefficients of 149 foods and beverages are also shown as values with 2 decimals in the boxes. Reproducibility coefficients were estimated as the intraclass correlation coefficients between the 2 repeated measurements of FFQ. Validity coefficients were estimated as the Spearman correlations between FFQ2 measurements and the average of repeated 7DDR measurements. Deattenuated validity coefficients were corrected for within-person variation in the 7DDRs. Women had the lowest reproducibility correlation of 0.39 for “other bran added to food” and the highest of 0.86 for “red wine”, the lowest validity correlation of 0.05 for “omega-3 fortified eggs” and the highest of 0.84 for “skim milk”, and the lowest deattenuated validity correlation of 0.19 for “fat-free cookies/brownies” and the highest of 0.96 for “chowder/cream soup.” Men had the lowest reproducibility correlation of 0.37 for “fat-free cookies/brownies” and the highest of 0.89 for “liquor”, the lowest validity correlation of 0.07 for “winter squash” and the highest of 0.82 for “liquor”, and the lowest deattenuated validity correlation of 0.14 for “kale/mustard greens/chard” and the highest of 0.90 for “liquor.”
Validity of food intakes measured with FFQ2 was high in both women and men (Figure 1, Web Tables 5–6). In the WLVS, after correcting for within-person variation in intakes measured with dietary records, the average validity correlation of the FFQ-measured foods was 0.59. Specifically, “fat-free cookies/brownies” had the lowest corrected correlation of 0.19, while “chowder or cream soup” had the highest corrected validity correlation of 0.96. In the MLVS, the average corrected validity correlation for food intakes measured with the FFQ was 0.61. “Kale/mustard greens/chard” had the lowest corrected validity of 0.14, while “liquor” had the highest corrected validity of 0.90. Similar to our observation on the reproducibility, beverages showed the highest corrected validity, and eggs and meat had relatively lower corrected validity. As expected, the corrected validity of foods measured with FFQ1 against averaged 7DDRs was slightly lower than that measured with FFQ2. The average corrected validity correlation of FFQ1 was 0.56 among women and 0.58 among men (Web Tables 5–6). We observed strong positive correlations between reproducibility and validity of foods in both women (ρ = 0.71, P < 0.001) and men (ρ = 0.75, P < 0.001) (Figure 2).
Figure 2.
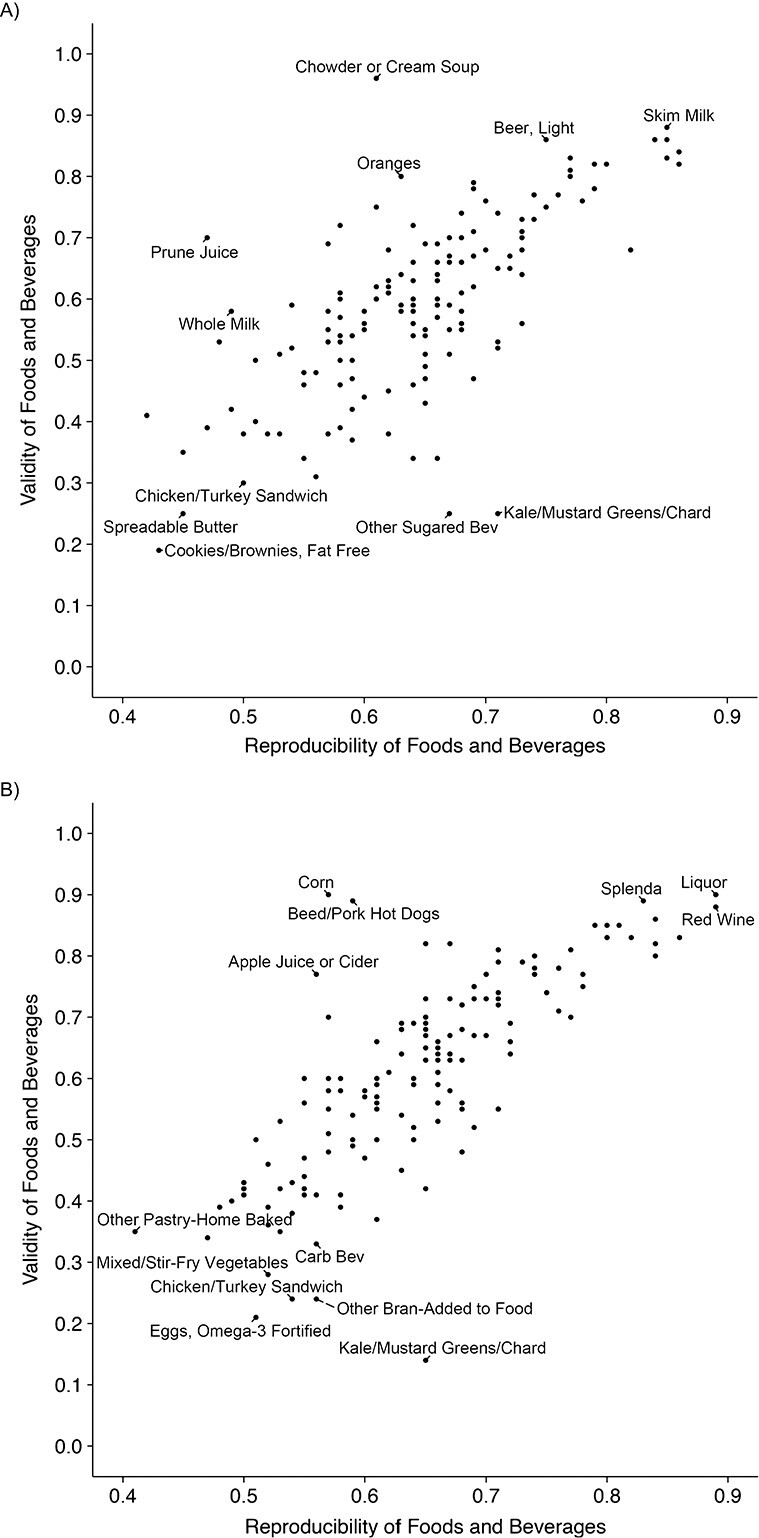
Scatter plot of the reproducibility and validity of individual foods in the Women’s Lifestyle Validation Study (A), United States, 2010–2012, and Men’s Lifestyle Validation Study (B), United States, 2011–2013). Reproducibility coefficients were estimated as the intraclass correlation coefficients between the 2 repeated measurements of FFQ. Validity coefficients were estimated as the Spearman correlations between FFQ2 measurements and the average of repeated 7DDR measurements. Validity coefficients were corrected for within-person variation in the 7DDRs. The correlations between reproducibility and validity of foods was 0.71 (P < 0.001) in women and 0.75 (P < 0.001) in men.
Reproducibility and validity of food groups
For food groups, the average reproducibility was 0.71 in women and 0.72 in men, higher than that for individual foods. Alcohol had the highest reproducibility in both women (0.92) and men (0.89) (Figure 3, Table 1). Although poultry ranked as the food group with the lowest reproducibility, it still showed a high correlation of 0.58 between the 2 FFQ measurements in both the WLVS and MLVS.
Figure 3.
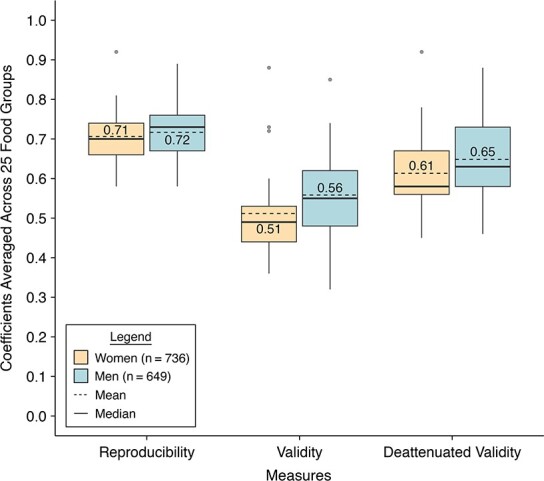
Distributions of reproducibility and validity of food groups estimated with semiquantitative food frequency questionnaires in the Women’s Lifestyle Validation Study (2010–2012) and Men’s Lifestyle Validation Study (2011–2013), United States. The boxplots show the mean (dashed line in the boxes), the 25th percentile (lower edge of the boxes), the median (solid line in the boxes), the 75th percentile (upper edge of the boxes), the minimum (lower end of the whiskers), the maximum (upper end of the whiskers), and outliers (dots) of the reproducibility and validity coefficients of 25 food groups. The means of the reproducibility and validity coefficients of 25 food groups are also shown as values with 2 decimals in the boxes. Reproducibility coefficients were estimated as the intraclass correlation coefficients between the 2 repeated measurements of FFQ. Validity coefficients were estimated as the Spearman correlations between FFQ2 measurements and the average of repeated 7DDR measurements. Deattenuated validity coefficients were corrected for within-person variation in the 7DDRs. Women had the lowest reproducibility correlation of 0.58 for “poultry” and the highest of 0.92 for “alcohol”, the lowest validity correlation of 0.36 for “sugar-sweetened beverages” and the highest of 0.88 for “alcohol”, and the lowest deattenuated validity correlation of 0.45 for “sugar-sweetened beverages” and the highest of 0.92 for “alcohol.” Men had the lowest reproducibility correlation of 0.58 for “poultry” and the highest of 0.89 for “alcohol”, the lowest validity correlation of 0.32 for “cruciferous vegetables” and the highest of 0.85 for “alcohol”, and the lowest deattenuated validity correlation of 0.46 for “cruciferous vegetables” and the highest of 0.88 for “alcohol.”
Table 1.
Reproducibility and Validity of 25 Food Groups in Women (n = 736) and Men (n = 649), Women’s Lifestyle Validation Study (2010–2012) and Men’s Lifestyle Validation Study (2011–2013), United States
| Reproducibility b | Deattenuated Validity c | |||||||
|---|---|---|---|---|---|---|---|---|
| Women | Men | Women | Men | |||||
| Food Group a | Coefficient Estimate | 95% CI | Coefficient Estimate | 95% CI | Coefficient Estimate | 95% CI | Coefficient Estimate | 95% CI |
| Alcohol | 0.92 | 0.91, 0.93 | 0.89 | 0.88, 0.91 | 0.92 | 0.90, 0.93 | 0.88 | 0.86, 0.90 |
| Low-fat dairy | 0.75 | 0.71, 0.78 | 0.76 | 0.72, 0.79 | 0.78 | 0.75, 0.82 | 0.80 | 0.76, 0.83 |
| Coffee/tea | 0.76 | 0.72, 0.79 | 0.80 | 0.77, 0.83 | 0.76 | 0.72, 0.79 | 0.76 | 0.73, 0.80 |
| Fruit | 0.73 | 0.69, 0.76 | 0.78 | 0.75, 0.81 | 0.68 | 0.62, 0.72 | 0.75 | 0.71, 0.79 |
| Red/processed meat | 0.78 | 0.75, 0.80 | 0.78 | 0.75, 0.81 | 0.68 | 0.62, 0.73 | 0.73 | 0.67, 0.77 |
| Nuts | 0.67 | 0.63, 0.71 | 0.73 | 0.69, 0.77 | 0.67 | 0.61, 0.72 | 0.74 | 0.69, 0.78 |
| Fruit juice | 0.79 | 0.76, 0.81 | 0.78 | 0.75, 0.81 | 0.64 | 0.57, 0.69 | 0.70 | 0.64, 0.75 |
| Fish | 0.72 | 0.68, 0.75 | 0.66 | 0.61, 0.70 | 0.72 | 0.66, 0.77 | 0.62 | 0.55, 0.68 |
| Egg | 0.67 | 0.63, 0.71 | 0.73 | 0.69, 0.76 | 0.58 | 0.51, 0.64 | 0.73 | 0.68, 0.78 |
| Nuts + legumes | 0.69 | 0.65, 0.72 | 0.71 | 0.68, 0.75 | 0.62 | 0.56, 0.68 | 0.69 | 0.63, 0.74 |
| SSB + juice | 0.81 | 0.78, 0.83 | 0.79 | 0.76, 0.82 | 0.60 | 0.54, 0.66 | 0.70 | 0.64, 0.75 |
| Potatoes | 0.71 | 0.67, 0.74 | 0.63 | 0.58, 0.67 | 0.61 | 0.54, 0.67 | 0.63 | 0.56, 0.69 |
| Meats | 0.71 | 0.67, 0.75 | 0.73 | 0.69, 0.76 | 0.56 | 0.49, 0.62 | 0.63 | 0.57, 0.68 |
| Sweets | 0.68 | 0.64, 0.72 | 0.71 | 0.67, 0.74 | 0.56 | 0.49, 0.62 | 0.63 | 0.57, 0.69 |
| Dairy | 0.66 | 0.62, 0.70 | 0.69 | 0.64, 0.73 | 0.55 | 0.49, 0.61 | 0.63 | 0.57, 0.68 |
| Whole grain | 0.66 | 0.61, 0.70 | 0.63 | 0.58, 0.67 | 0.58 | 0.51, 0.64 | 0.60 | 0.53, 0.66 |
| Refined grain | 0.66 | 0.62, 0.70 | 0.71 | 0.66, 0.74 | 0.59 | 0.53, 0.65 | 0.58 | 0.51, 0.63 |
| Legumes | 0.68 | 0.64, 0.72 | 0.66 | 0.62, 0.70 | 0.57 | 0.50, 0.64 | 0.56 | 0.49, 0.63 |
| High-fat dairy | 0.63 | 0.58, 0.67 | 0.73 | 0.69, 0.76 | 0.51 | 0.45, 0.58 | 0.61 | 0.55, 0.67 |
| Leafy green vegetables | 0.62 | 0.57, 0.66 | 0.59 | 0.54, 0.64 | 0.55 | 0.48, 0.62 | 0.55 | 0.47, 0.62 |
| Vegetables | 0.73 | 0.70, 0.76 | 0.73 | 0.69, 0.76 | 0.58 | 0.51, 0.63 | 0.51 | 0.44, 0.57 |
| Butter | 0.61 | 0.56, 0.65 | 0.67 | 0.63, 0.71 | 0.51 | 0.44, 0.57 | 0.58 | 0.51, 0.64 |
| Poultry | 0.58 | 0.53, 0.63 | 0.58 | 0.53, 0.63 | 0.49 | 0.41, 0.56 | 0.56 | 0.48, 0.64 |
| Cruciferous vegetables | 0.70 | 0.67, 0.74 | 0.71 | 0.67, 0.75 | 0.57 | 0.49, 0.64 | 0.46 | 0.36, 0.54 |
| SSB | 0.74 | 0.71, 0.77 | 0.74 | 0.71, 0.78 | 0.45 | 0.37, 0.52 | 0.58 | 0.51, 0.64 |
Abbreviations: 7DDR, 7-day dietary record; CI, confidence interval; FFQ, food frequency questionnaire; SSB, sugar-sweetened beverages.
a Food groups are ranked in descending order of the validity coefficients averaged across men and women.
b Reproducibility coefficients were estimated as the intraclass correlation coefficients between the 2 repeated measurements of FFQ.
c Validity coefficients were estimated as the Spearman correlations between FFQ2 measurements and the average of repeated 7DDR measurements. Validity coefficients were corrected for within-person variation in the 7DDRs.
The average validity of food groups (0.61 in women and 0.65 in men) was also higher than that of individual foods (Figure 3, Table 1). In women, sugar-sweetened beverages, as a food group, had the lowest validity of 0.45 and alcohol had the highest validity of 0.92 after correcting for within-person variation in intakes measured with dietary records. In men, alcohol also showed the highest corrected validity, of 0.88, while cruciferous vegetables with a corrected validity of 0.46 ranked the lowest. We observed some sex differences in corrected validity for egg, whole grains, high-fat dairy, and sugar-sweetened beverages measured with FFQ2 (Table 1). Validity of these food groups was substantially lower among women than men. In addition, validity of food groups measured with FFQ1 was slightly lower than that measured with FFQ2 in women (average corrected validity correlation = 0.60) but not in men (average corrected validity correlation = 0.65) (Web Tables 5–6).
In a secondary analysis, we found that the average corrected validity of FFQ-measured food or food group intakes did not differ substantially among subpopulations defined by age (>70 vs. <70), total energy intake (>median vs. <median) in both women and men, or cohort membership (HPFS vs. HPHC) in men (Web Tables 7–8). However, the average corrected validity of food or food group intakes tended to be lower among overweight participants (BMI ≥25). Another secondary analysis found a positive correlation between the corrected validity and intake level of beverages in men (ρ = 0.73, P = 0.003), but not in women (Web Figures 4–5). In both women and men, reproducibility and validity for energy-adjusted food and food group intakes were similar to those for crude intakes (Web Tables 9–10).
DISCUSSION
In this study, we evaluated the reproducibility and validity of food and food group intakes measured by an updated FFQ used in the NHS, NHS II, and HPFS. Across the 149 foods listed on the FFQ, the average reproducibility was 0.64 in both women and men, respectively. The average reproducibility of the 25 food groups was higher than that of individual foods (women: 0.71; men: 0.72). We observed a mean validity of 0.59 across individual foods measured with FFQ2 in women, and a corresponding validity of 0.61 in men, after adjusting for within-person variation in the diet records. In general, FFQ-measured food groups had slightly higher validity compared with individual foods.
In both the WLVS and MLVS, we administered the 2 FFQs 1 year apart to minimize overestimation of reproducibility as participants may tend to remember and repeat responses in questionnaires (5). Reproducibility correlations reported in the current study were likely to be underestimated, given that true dietary changes might exist over the study years. Validity of FFQ2 is of the most interest as FFQ2 assessed dietary intakes over a time frame during which the two 7DDRs were collected. However, FFQ2 is susceptible to error correlated with that in 7DDRs as consciousness of diet might increase after dietary recordings (5), which could overestimate the validity of the FFQ. In contrast, FFQ1 administered at baseline should have minimal error correlated with the error in dietary recordings but would tend to underestimate validity because it referred to a year preceding the collection of the 7DDRs. We therefore presented the validity of FFQ1 as a conservative estimate. As expected, the correlations between FFQ1 and averaged 7DDRs were lower than those between FFQ2 and averaged 7DDRs among both women and men, but this difference was very small (0.03 for foods and 0.01 for food groups in women; 0.03 for foods and 0.00 for food groups in men), indicating that any overestimation of validity using FFQ2 would be minor.
The performance of FFQ used in the NHS and HPFS in measuring food intakes was last evaluated three decades ago in two validation studies with designs similar to this study (6, 7). In our first validation study, which included 173 women from the NHS, Salvini et al. (7) showed an average Pearson correlation of 0.57 between the two 61-item FFQs administered 1 year apart. The second FFQ validated against 7DDRs showed validity correlations for foods ranging from 0.17 for spinach to 0.94 for yogurt and beer, with a mean of 0.66. Similar to our observation, the average validity of the first FFQ was slightly lower than that of the second FFQ in that study. Another validation study conducted among 127 male HPFS participants assessed an expanded FFQ with 122 food items (6). The authors found an average Pearson correlation of 0.59 between the 2 FFQs. Validity correlations of the second FFQ corrected for within-person variations in 7DDR-measured intakes ranged from 0.17 for other nuts to 0.95 for bananas with a mean of 0.63.
Our current analysis showed that both reproducibility and validity of the FFQ used in the NHS, NHS II, and HPFS to measure specific foods remained high after an expansion of the food list and despite changes in eating patterns over the past 30 years, including increases in portion sizes, consumption of meals prepared outside of the home, snacking, and food manufacturing (19). Compared with our previous validation studies for foods, this study incorporated the following methodological advances. First, we presented validity coefficients as Spearman correlations instead of Pearson correlations because the intakes of most foods, either measured by FFQ or 7DDRs, were highly skewed, violating the normality assumption for Pearson correlation. The rank-based Spearman correlation can still provide valid estimates since it does not rely on any distributional assumption. Second, the recently developed arcsin-based estimator allowed us to correctly estimate the confidence intervals without making normality assumptions (16). Third, the large sample sizes of the WLVS and MLVS provided sufficient statistical power for a precise nonparametric estimation of correlations. Building upon the improved statistical methods and larger sample size, the current validation study provided more robust evidence supporting the performance of FFQ in measuring food and food group intakes.
To our knowledge, this is the largest validation of FFQ-measured foods/food groups among women and men in the United States. It is also the first comprehensive validation of all individual foods, as well as the derived food groups, on an FFQ widely used in the US population since 1993. Due to the limited availability of dietary validation studies and the challenges in matching 7DDR-measured foods to FFQ questions, most studies were able to assess the performance of FFQ only in measuring food groups but not individual foods (20–24). For example, among 745 participants from a prospective US study, median energy-adjusted validity correlations comparing the FFQ to the 24-hour recall for 63 food groups were 0.50 and 0.52 among men and women (25). When validated against multiple 3-day dietary records, an FFQ designed for a Japanese population showed an average validity coefficient of 0.51 for men and 0.47 for women when measuring 20 food groups (20). An 81-item FFQ used in a prospective cohort study of Chinese men showed validity coefficients of eight food groups ranging from 0.35 to 0.72 when using 24-hour dietary recalls as the reference assessment (26).
Our study has limitations. The findings may lack generalizability as participants were primarily White and highly educated health professionals from the NHS, NHS II, and HPFS. Despite that, the highly consistent average validity and reproducibility coefficients among women and men and among HPFS and the more demographically diverse HPHC participants increased the plausibility of our findings. In another racially/ethnically diverse prospective cohort, a slightly modified version of the FFQ used in our study showed similarly high reproducibility and validity when assessing nutrient intakes (27). Average reproducibility and validity coefficients were only slightly lower among Blacks and Hispanic participants (27). We cannot rule out the possibility that errors in different dietary assessment methods are correlated, resulting in exaggerated correlation coefficients. However, previous studies assessing validity of nutrients against recovery biomarkers in the WLVS and MLVS supported that the magnitude of exaggeration in correlation coefficients due to correlated errors was minimal (1, 2, 28). For example, the correlation between protein intake estimated with FFQ and that estimated with recovery biomarkers was 0.44 in men, only 0.07 lower than the correlation between FFQ-measured protein and 7DDR-measured protein (r = 0.51) (2). Moreover, among women, the correlation of FFQ-measured long chain omega-3 fatty acids (docosahexaenoic acid and eicosapentaenoic acid), which are predominantly sourced from fish intakes, with corresponding plasma fatty acids biomarkers was 0.61, while the correlation of FFQ-measured long chain omega-3 fatty acids with 7DDR-measured intakes was only 0.06 higher (Spearman correlation = 0.67) (1, 28). On the other hand, the 7DDRs are likely to have errors that are not correlated with those of the FFQ, which would lead to underestimation of the FFQ validity (5). For example, foods being recorded might not be representative of what a participant would normally have eaten as they tend to simplify diet due to burdens associated with recording mixed dishes. When recording diet, participants also have a tendency to select foods that are more socially desirable but not represent their usual diet (29). In addition, biomarkers have multiple sources of error not correlated with those of the FFQ. Distributions of a few foods, particularly those consumed infrequently or episodically, were observed to be zero-inflated and might violate the normality assumption even after the probit transformation. The impact of zero-inflated dietary data on validity measures, as well as the performance of existing measurement error correction methods, is subject to future simulation-based research.
In conclusion, our study showed that the FFQ used in NHS, NHS II, and HPFS has reasonably high reproducibility and validity in measuring food and food groups intakes among both women and men. For long-term observational studies with repeated dietary assessments through FFQs, updating the food list frequently is important to accommodate dietary changes over time. This validation study, along with the others conducted previously in the NHS and HPFS, provides evidence that FFQs with updated food lists capture food intakes well. It also provides data to adjust for measurement error in epidemiologic studies of foods and food groups in relation to health outcomes. Moreover, the low cost and modest burden of the FFQ relative to other dietary assessment tools makes it eminently applicable in nutritional epidemiolocal studies aiming to measure long-term dietary intakes of foods, food groups, nutrients, and dietary patterns for chronic disease risk assessments.
Supplementary Material
ACKNOWLEDGMENTS
Author affiliations: Department of Nutrition, Harvard T. H. Chan School of Public Health, Boston, Massachusetts, United States (Xiao Gu, Dong D. Wang, Laura Sampson, Junaidah B. Barnett, Eric B. Rimm, Meir J. Stampfer, Luc Djousse, Walter C. Willett); and Channing Division of Network Medicine, Department of Medicine, Brigham and Women’s Hospital and Harvard Medical School, Boston, Massachusetts, United States (Dong D. Wang, Eric B. Rimm, Meir J. Stampfer, Luc Djousse, Bernard Rosner).
The Women’s Lifestyle Validation Study and Men’s Lifestyle Validation Study are supported by the National Institutes of Health (grants UM1 CA186107, U01 CA176726, P01 CA055075-18S1, U01 CA167552, and U01 CA152904).
Data described in the manuscript, code book, and analytical code will be made available upon request pending a letter of intent and a research proposal.
Presented at the American Society for Nutrition’s Nutrition 2022 (online), June 14–16, 2022.
The content is solely the responsibility of the authors and does not necessarily represent the official views of the National Institutes of Health.
Conflict of interest: none declared.
REFERENCES
- 1. Yuan C, Spiegelman D, Rimm EB, et al. Validity of a dietary questionnaire assessed by comparison with multiple weighed dietary records or 24-hour recalls. Am J Epidemiol. 2017;185(7):570–584. [DOI] [PMC free article] [PubMed] [Google Scholar]
- 2. Al-Shaar L, Yuan C, Rosner B, et al. Reproducibility and validity of a Semiquantitative food frequency questionnaire in men assessed by multiple methods. Am J Epidemiol. 2021;190(6):1122–1132. [DOI] [PMC free article] [PubMed] [Google Scholar]
- 3. Willett WC, Sampson L, Stampfer MJ, et al. Reproducibility and validity of a semiquantitative food frequency questionnaire. Am J Epidemiol. 1985;122(1):51–65. [DOI] [PubMed] [Google Scholar]
- 4. Rimm EB, Giovannucci EL, Stampfer MJ, et al. Reproducibility and validity of an expanded self-administered semiquantitative food frequency questionnaire among male health professionals. Am J Epidemiol. 1992;135(10):1114–1126. [DOI] [PubMed] [Google Scholar]
- 5. Willett WC. Nutritional Epidemiology. 3rd ed. New York, NY: Oxford University Press; 2013. [Google Scholar]
- 6. Feskanich D, Rimm EB, Giovannucci EL, et al. Reproducibility and validity of food intake measurements from a semiquantitative food frequency questionnaire. J Am Diet Assoc. 1993;93(7):790–796. [DOI] [PubMed] [Google Scholar]
- 7. Salvini S, Hunter DJ, Sampson L, et al. Food-based validation of a dietary questionnaire: the effects of week-to-week variation in food consumption. Int J Epidemiol. 1989;18(4):858–867. [DOI] [PubMed] [Google Scholar]
- 8. Sotos-Prieto M, Bhupathiraju SN, Mattei J, et al. Association of changes in diet quality with total and cause-specific mortality. N Engl J Med. 2017;377(2):143–153. [DOI] [PMC free article] [PubMed] [Google Scholar]
- 9. Wang DD, Li Y, Chiuve SE, et al. Association of specific dietary fats with total and cause-specific mortality. JAMA Intern Med. 2016;176(8):1134–1145. [DOI] [PMC free article] [PubMed] [Google Scholar]
- 10. Health Professionals Follow-up Study . Semi-quantitative food frequency questionnaire. https://sites.sph.harvard.edu/hpfs/hpfs-questionnaires/. Accessed January 2, 2022.
- 11. Nurses’ Health Study . Semi-quantitative food frequency questionnaire. https://nurseshealthstudy.org/participants/questionnaires. Accessed January 2, 2022.
- 12. Harvard T. H. Chan School of Public Health . Nutrition Department's Food Composition Table. https://regepi.bwh.harvard.edu/health/nutrition/. Accessed October 1, 2021.
- 13. Schakel SF, Sievert YA, Buzzard IM. Sources of data for developing and maintaining a nutrient database. J Am Diet Assoc. 1988;88(10):1268–1271. [PubMed] [Google Scholar]
- 14. Schakel SF, Buzzard IM, Gebhardt SE. Procedures for estimating nutrient values for food composition databases. J Food Compos Anal. 1997;10(2):102–114. [Google Scholar]
- 15. Feskanich D, Sielaff BH, Chong K, et al. Computerized collection and analysis of dietary intake information. Comput Methods Programs Biomed. 1989;30(1):47–57. [DOI] [PubMed] [Google Scholar]
- 16. Rosner B, Glynn RJ. Interval estimation for rank correlation coefficients based on the probit transformation with extension to measurement error correction of correlated ranked data. Stat Med. 2007;26(3):633–646. [DOI] [PubMed] [Google Scholar]
- 17. Searle SR, Gruber MH. Linear Models. 2nd ed. Hoboken, NJ: John Wiley & Sons; 2016. [Google Scholar]
- 18. Rosner B, Willett WC, Spiegelman D. Correction of logistic regression relative risk estimates and confidence intervals for systematic within-person measurement error. Stat Med. 1989;8(9):1051–1069. [DOI] [PubMed] [Google Scholar]
- 19. Popkin BM. Global nutrition dynamics: the world is shifting rapidly toward a diet linked with noncommunicable diseases. Am J Clin Nutr. 2006;84(2):289–298. [DOI] [PubMed] [Google Scholar]
- 20. Imaeda N, Goto C, Sasakabe T, et al. Reproducibility and validity of food group intake in a short food frequency questionnaire for the middle-aged Japanese population. Environ Health Prev Med. 2021;26(1):28. [DOI] [PMC free article] [PubMed] [Google Scholar]
- 21. Allehdan SS, Tayyem RF, Agraib LM, et al. Relative validity and reproducibility of a food frequency questionnaire to assess food group intake in pregnant Jordanian women. J Acad Nutr Diet. 2019;119(8):1349–1361. [DOI] [PubMed] [Google Scholar]
- 22. Shrestha A, Koju RP, Beresford SAA, et al. Reproducibility and relative validity of food group intake in a food frequency questionnaire developed for Nepalese diet. Int J Food Sci Nutr. 2017;68(5):605–612. [DOI] [PubMed] [Google Scholar]
- 23. Barbieri P, Crivellenti LC, Nishimura RY, et al. Validation of a food frequency questionnaire to assess food group intake by pregnant women. J Hum Nutr Diet. 2015;28(suppl 1):38–44. [DOI] [PubMed] [Google Scholar]
- 24. Segovia-Siapco G, Singh P, Haddad E, et al. Relative validity of a food frequency questionnaire used to assess food intake during a dietary intervention study. Nutr Cancer. 2008;60(5):603–611. [DOI] [PubMed] [Google Scholar]
- 25. Troeschel AN, Hartman TJ, Flanders WD, et al. The American Cancer Society Cancer Prevention Study-3 FFQ has reasonable validity and reproducibility for food groups and a diet quality score. J Nutr. 2020;150(6):1566–1578. [DOI] [PubMed] [Google Scholar]
- 26. Villegas R, Yang G, Liu D, et al. Validity and reproducibility of the food-frequency questionnaire used in the Shanghai men's health study. Br J Nutr. 2007;97(5):993–1000. [DOI] [PubMed] [Google Scholar]
- 27. McCullough ML, Wang Y, Hartman TJ, et al. The cancer prevention Study-3 FFQ is a reliable and valid measure of nutrient intakes among racial/ethnic subgroups, compared with 24-hour recalls and biomarkers. J Nutr. 2021;151(3):636–648. [DOI] [PubMed] [Google Scholar]
- 28. Yuan C, Spiegelman D, Rimm EB, et al. Relative validity of nutrient intakes assessed by questionnaire, 24-hour recalls, and diet records as compared with urinary recovery and plasma concentration biomarkers: findings for women. Am J Epidemiol. 2018;187(5):1051–1063. [DOI] [PMC free article] [PubMed] [Google Scholar]
- 29. Baranowski T, Willet W. 24-hour recall and diet record methods. Nutritional Epidemiology. 3rd ed.Monographs in epidemiology and biostatistics, vol. 40. New York, NY: Oxford University Press; 2012:49–69. [Google Scholar]
Associated Data
This section collects any data citations, data availability statements, or supplementary materials included in this article.