Abstract
Background
Due to spatial resolution limitations, conventional NaI-SPECT typically overestimates the left ventricular (LV) ejection fraction (EF) in patients with small LV volumes. The purpose of this study was to explore the clinical application value of the small heart (SH) reconstruction protocol embedded in the postprocessing procedure of D-SPECT.
Methods
We retrospectively analyzed patients who undergo both D-SPECT and echocardiography (Echo) within one week. Patients with small LV volume were defined as those with a rest end-systolic volume (rESV) ≤ 25 mL and underwent reconstruction using the standard (SD) reconstruction protocol. The SH protocol was deemed successful in correcting the LVEF value if it decreased by 5% or more compared to the SD protocol. The ROC curve was used to calculate the optimal cutoff value of the SH protocol. LVEF, ESV and EDV were computed with SD and SH, respectively. Echo was performed as a reference, and Echo-LVEF, ESV, and EDV were calculated using the Teichholz formula. One-way ANOVA was used to compare these parameters among the three groups.
Results
The final study included 209 patients (73.21% female, age 67.34 ± 7.85 years). Compared with the SD protocol, the SH protocol significantly decreased LVEF (67.43 ± 7.38% vs. 71.30 ± 7.61%, p < 0.001). The optimal cutoff value for using the SH protocol was rESV > 17 mL (AUC = 0.651, sensitivity = 78.43%, specificity = 45.57%, p = 0.001). In the subgroup of rESV > 17 mL, there was no significant difference in LVEF (61.84 ± 4.67% vs. 62.83 ± 2.85%, p = 0.481) between the SH protocol and Echo, and no significant difference was observed in rESV (26.92 ± 3.25 mL vs. 27.94 ± 7.96 mL, p = 0.60) between the SH protocol and Echo.
Conclusion
This pilot study demonstrated that the SH reconstruction protocol was able to effectively correct the overestimation of LVEF in patients with small LV volumes. Particularly, in the rESV > 17 mL subgroup, the time and computing power waste could be reduced while still ensuring the accuracy of the LVEF value and image quality.
Keywords: Gate myocardial perfusion single-photon computed tomography, Small left ventricle volume, Reconstruction algorithm, Left ventricle ejection fraction
Background
Validation studies have been conducted to demonstrate the effectiveness of gated myocardial perfusion single-photon computed tomography (GSPECT) myocardial perfusion imaging (MPI) in assessing and classifying the risk of patients with suspected or known coronary artery disease (CAD) [1–4]. It has been established that functional parameters, such as left ventricle (LV) ejection fraction (EF) and LV volumes, are in agreement with those from echocardiography (Echo), cardiac magnetic resonance imaging (CMR) and left ventriculography [5–7]. However, an issue with GSPECT is that it tends to underestimate LV end-systolic volume (ESV) and end-diastolic volume (EDV) and overestimate LVEF in patients with small LV volumes when using the standard (SD) reconstruction protocol, thus leading to a misdiagnosis and affecting the prognostic evaluation of these patients, referred to as the “small heart effect” [8–10].
Numerous researchers have endeavored to tackle this issue from the perspectives of refining scanning and reconstruction techniques [11–13]. The small heart (SH) reconstruction protocol, developed by Spectrum Dynamics Medical Company, has improved the spatial resolution of reconstructed images when compared to the SD reconstruction protocol, making it possible to accurately delineate the endocardium in patients with small LV volumes. To date, no studies have been conducted to investigate the SH reconstruction protocol’s usage in clinical application for patients with small LV volumes.
To help fill this gap, the aim of this study was to validate the feasibility of the SH reconstruction protocol to enhance the quantitative accuracy of the LVEF and LV volumes in patients with small LV volumes. Additionally, we further explored the application value of the SH reconstruction protocol in certain patients.
Materials and methods
Patient population
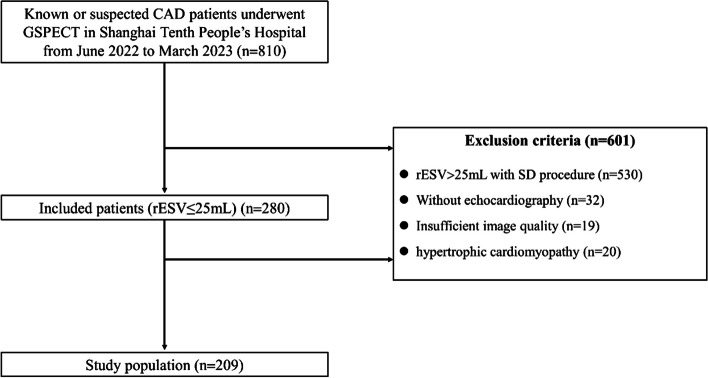
We performed a retrospective study of 810 consecutive patients with suspected or known CAD who were referred for rest/stress 99mTc-sestamibi (MIBI) GSPECT from June 2022 to March 2023 at the Department of Nuclear Medicine, Shanghai Tenth People’s Hospital. Patients were excluded if rest end-systolic volume (rESV) > 25 mL was reconstructed using the SD protocol (n = 530), if echocardiography was not performed (n = 32), if imaging quality was insufficient (inferior wall and ventricular septal artifacts were too heavy to accurately delineate the endocardium; GSPECT quantification failed due to severe arrhythmia) (n = 19), or if hypertrophic cardiomyopathy was present (n = 20). LVs with an rESV ≤ 25 mL as calculated using the SD reconstruction protocol were defined as small. After applying the exclusion criteria, a total of 209 small heart patients were eligible for inclusion in our study (Fig. 1). The ethics committee of Shanghai Tenth People’s Hospital approved the protocol under the approval number SHSY-IEC-4.1/21-126/01.
Fig. 1.
Patient flowchart
Imaging acquisition
Equipment: The D-SPECT Cardiac System Model 003 (Spectrum Dynamics Medical Ltd., Israel, Caesarea, Serial Number: 5217) was equipped with 9 mobile blocks of pixelated CZT detectors (pixel size, 2.46 mm × 2.46 mm). Each collimated detector column rotates and translates independently (up to 110°), allowing for the observation of objects of interest from hundreds of different angles [14].
Radiotracer drug: 99mTc-sestamibi (MIBI) (Shanghai Xinke Pharmaceutical Co., Ltd., Shanghai, China).
Stress test drug: Adenosine injection (Penglai Nuokang Pharmaceutical Co., Ltd., Penglai, Shandong Province, China).
Scanning Protocol: All patients that were included were following a one-day rest/stress GSPECT MPI protocol, and the rest images were used in this study. Before examination, patients refrained from theophylline and caffeine-containing beverages for at least 12 h and fasted for at least 3 h [15]. An experienced nuclear medicine technologist conducted the rest GSPECT MPI acquisition, which began 60–90 min after an intravenous injection of 370 MBq of 99mTc-MIBI. The stress protocol was started approximately 60 min after the injection of adenosine and radiopharmaceutical. To minimize the impact of the liver and intestine on the heart readings, the patient was instructed to consume a fatty diet 30 min before the examination. The technologist was blinded to all other imaging data and the clinical status of the patient [16]. The energy window was set to 140 keV ± 10%, the size of the acquisition matrix was 64 × 64, and the cardiac cycle was divided into 8 frames for ECG gating. The scan time was set to the time until a total of 1.5 M counts were reached for the LV. No attenuation or scatter corrections were applied [17].
Reconstruction parameters
After the images were acquired, the data was transmitted to the Spectrum Dynamics Medical Processing Station and reconstructed with SD and SH reconstruction protocols. The SD is performed using 32 subsets and 4 iterations. The SH is performed using 32 subsets and iterated 9 times. Inter-iteration filtering is applied by convolution with a smoothing kernel with a central value of (1 − ω), where ω is 0.125 [17, 18]. The only distinction between the two reconstruction protocols is the number of iterations. Both of them are based on the maximum-likelihood expectation maximization (MLEM) algorithm [19]. Both the SD and SH reconstruction protocols have a fixed number of subsets and iterations, with the reconstructed voxel size being 4.92 × 4.92 × 4.92 mm. Automatic processing was initially used for the software, but when the wall tracing was visually judged to be inappropriate, the operator modified the ventricular border surrounding the ventricle and reprocessed the edge. Then ventricular systolic function parameters, LVEF; ventricular volume parameters, rest EDV, and rESV were acquired automatically by subsequent processing in DICOM format using the quantitative perfusion SPECT software (QGS, Cedars-Sinai Medical Center). If rESV ≤ 25 mL was calculated by SD, the SH reconstruction protocol was chosen.
Echocardiography
M-mode and two-dimensional echocardiograms were used to measure LV function parameters. The M-shaped sampling line was perpendicular to the left ventricular long axis, placed at the level of the chordae tendineae. Dd (end-diastolic diameter) and Ds (end-systolic diameter). EDV and ESV were measured using the Teichholz formula: EDV = 7.0 × Dd3/(2.4 + Dd), ESV = 7.0 × Ds3/(2.4 + Ds). LVEF = (EDV-ESV)/EDV*100% [20].
Statistical analysis
After verifying the normal distribution with the Kolmogorov − Smirnov test, continuous variables were presented as the mean ± standard deviation and were compared using the independent samples t test for two groups. Cardiac function parameters of Echo were used as the reference standard, and one-way ANOVA was used for the analysis of the three groups, while the Bonferroni correction was used for post hoc comparison. A ΔLVEF change > 5% between the SD and SH reconstruction protocols was considered to be corrected successfully. Receiver operator characteristic (ROC) analysis [21] was used to derive the optimal cutoff point of rESV based on the two-category data (1 represented ΔLVEF > 5%; 0 represented ΔLVEF ≤ 5%). A p value of < 0.05 was considered statistically significant. All statistical analyzes were performed using SPSS 24.0 for Windows (SPSS Inc., Chicago, IL, United States) and GraphPad Prism 8.0.1.
Results
Patient characteristics
This study included 209 patients with small LV volumes (mean age 67.34 ± 7.85 years, 73.21% female), 130 (62.20%) of whom had hypertension, 42 (20.10%) of whom had diabetes mellitus and 5 (2.39%) of whom had dyslipidemia. The patients’ baseline characteristics are summarized in Table 1.
Table 1.
Clinical characteristics of the study population
| Patient characteristics | n = 209 |
|---|---|
| Age (mean ± SD) | 67.34 ± 7.85 |
| Female (%) | 153(73.21) |
| Height (m) | 1.62 ± 0.07 |
| Weight (kg) | 62.97 ± 10.45 |
| BMI (kg/m2) | 23.91 ± 3.33 |
| BSA (m2) | 1.64 ± 0.16 |
| Hypertension (%) | 130(62.20) |
| Diabetes mellitus (%) | 42(20.10) |
| Dyslipidemia (%) | 5 (2.39) |
| Family history of CAD | 12(5.74) |
| Previous PCI | 46(22.01) |
Body surface area (BSA) = 0.0061 × Height (m) + 0.0128 × Weight (kg) − 0.1529. CAD: coronary artery disease
Determination of parameters using SD, SH and echo in the overall population
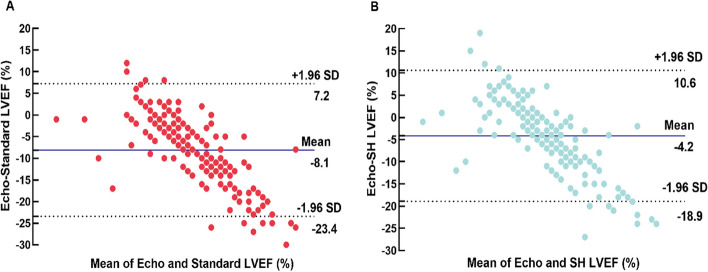
The LVEF was overestimated (71.30 ± 7.61% vs. 63.15 ± 2.65%, p < 0.001), and the ESV and EDV (15.45 ± 5.83 mL vs. 26.51 ± 6.04 mL, p < 0.001, 52.35 ± 12.25 mL vs. 84.98 ± 13.61 mL, p < 0.001) were underestimated by the SD reconstruction protocol when compared with Echo. The SH protocol partially mitigated the overestimation of LVEF caused by the “small heart effect”, and 24% of patients were successfully corrected. The mean SH-LVEF was 67.43 ± 7.38% in all patients with more minimal bias (-4.2%) and narrow BA-LA (-18.9% to 10.6%) compared with SD (Table 2, Figs. 2 and 3). Furthermore, the majority of LVEFs that were reconstructed using the SD protocol were within the 70–75% range, accounting for 26.32%. The majority of LVEFs that were reconstructed using the SH protocol were within the 60–65% range, accounting for 28.23%. The majority of LVEF measured by Echo was also within the 60–65% range, accounting for 77.07% (Fig. 4).
Table 2.
Paired comparisons of the parameters obtained from SD, SH and Echo
| Parameter | SD | SH | SD vs.SH | Echo | SH vs. Echo |
|---|---|---|---|---|---|
| LVEF (%) | 71.30 ± 7.61 | 67.43 ± 7.38 | p < 0.001 | 63.15 ± 2.65 | p < 0.001 |
| ESV (mL) | 15.45 ± 5.83 | 20.32 ± 6.97 | p < 0.001 | 26.51 ± 6.04 | p < 0.001 |
| EDV (mL) | 52.35 ± 12.25 | 61.21 ± 13.27 | p < 0.001 | 84.98 ± 13.61 | p < 0.001 |
Fig. 2.
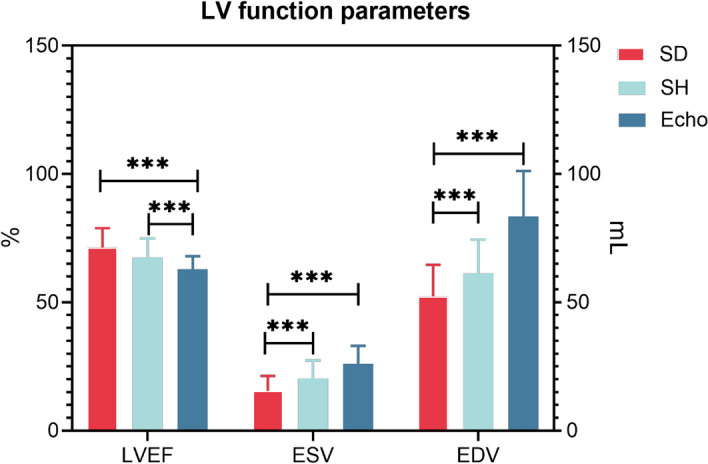
LV function parameters measured by SD, SH protocol and Echo in the overall population. *** represents p < 0.001
Fig. 3.
A Agreement for LVEF measurement: Bland-Atman plots for Echo and SD reconstruction protocol. B Bland-Atman plots for Echo and SH reconstruction protocol
Fig. 4.
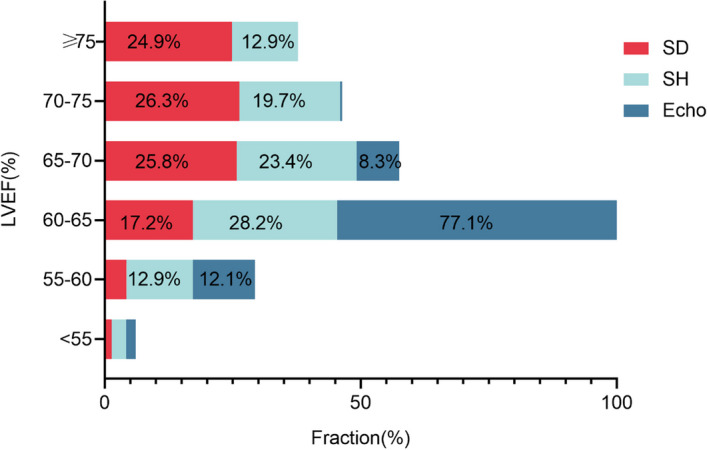
The LVEF was divided into 6 ranges, and the proportion of each range was used among the SD, SH protocol and Echo. The x-axis shows the percentage of patients, and the y-axis shows LVEF%
The cutoff value of rESV following the SH reconstruction protocol
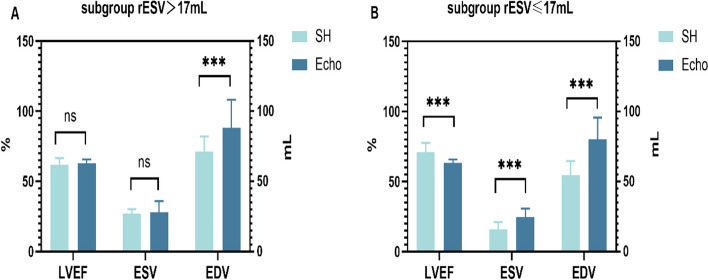
The optimal cutoff value for rESV was 17 mL, with a sensitivity and specificity of 78.43% and 45.57%, respectively (Fig. 5). The rESV > 17 mL subgroup had 83 patients (39.71%), while the rESV ≤ 17 mL subgroup had 126 (60.29%). When comparing the SH protocol and Echo, no significant difference in LVEF and ESV was observed in the rESV > 17 mL subgroup (61.84 ± 4.67% vs. 62.83 ± 2.85%, p = 0.481; 26.92 ± 3.25 mL vs. 27.94 ± 7.96 mL, p = 0.596). The SH-EDV was slightly lower than the Echo-EDV (71.43 ± 10.66 mL vs. 88.24 ± 19.94 mL, p < 0.001). Nevertheless, the SD-LVEF was significantly higher than the Echo-LVEF (65.10 ± 4.67% vs. 62.83 ± 2.85%, p = 0.001), and the SD-ESV and SD-EDV were significantly lower than the Echo-ESV and Echo-EDV (21.27 ± 2.15 mL vs. 27.94 ± 7.96 mL, p < 0.001; 62.05 ± 9.81 vs. 88.24 ± 19.94, p < 0.001). In the rESV ≤ 17 mL subgroup, the SH-LVEF and SD-LVEF were higher than the Echo-LVEF (71.18 ± 6.52%, 75.37 ± 6.46% vs. 63.36 ± 2.50%, p < 0.001). Both the ESV (15.98 ± 5.09 mL, 11.62 ± 4.05 mL vs. 24.72 ± 5.99 mL, p < 0.001) and EDV (54.48 ± 10.16 mL, 45.96 ± 9.10 mL vs. 80.13 ± 15.54 mL, p < 0.001) were underestimated. These results are shown in Table 3 and Fig. 6.
Fig. 5.
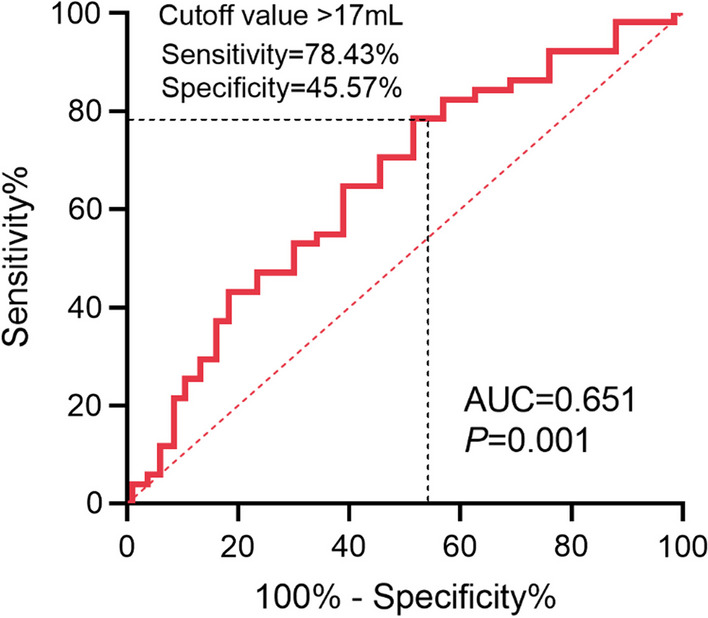
The optimized cutoff value of rESV reconstructed following the SH protocol
Table 3.
Parameters calculated by SD, SH and Echo respectively in both subgroups. The bold showed that for the subgroup with rESV >17mL, the LVEF and ESV values were not significantly different between the SH reconstruction protocol and Echo, whereas the SD reconstruction protocol and Echo had a statistically significant difference
| Parameter | Group | SD | SH | SD vs.SH | Echo | SH vs. Echo |
|---|---|---|---|---|---|---|
| All | 71.30 ± 7.61 | 67.43 ± 7.38 | p < 0.001 | 63.15 ± 2.65 | p < 0.001 | |
| LVEF (%) | rESV > 17 | 65.10 ± 4.67 | 61.84 ± 4.67 | p = 0.001 | 62.83 ± 2.85 | p = 0.48 |
| rESV ≤ 17 | 75.37 ± 6.46 | 71.18 ± 6.52 | p < 0.001 | 63.36 ± 2.50 | p < 0.001 | |
| All | 15.45 ± 5.83 | 20.32 ± 6.97 | p < 0.001 | 26.00 ± 7.00 | p < 0.001 | |
| ESV (mL) | rESV > 17 | 21.27 ± 2.15 | 26.92 ± 3.25 | p < 0.001 | 27.94 ± 7.96 | p = 0.60 |
| rESV ≤ 17 | 11.62 ± 4.05 | 15.98 ± 5.09 | p < 0.001 | 24.72 ± 5.99 | p < 0.001 | |
| All | 52.35 ± 12.25 | 61.21 ± 13.27 | p < 0.001 | 83.35 ± 17.83 | p < 0.001 | |
| EDV (mL) | rESV > 17 | 62.05 ± 9.81 | 71.43 ± 10.66 | p < 0.001 | 88.24 ± 19.94 | p < 0.001 |
| rESV ≤ 17 | 45.96 ± 9.10 | 54.48 ± 10.16 | p < 0.001 | 80.13 ± 15.54 | p < 0.001 |
Fig. 6.
A In the rESV > 17 mL subgroup, the LV function parameters obtained with the SH protocol and Echo. B In the rESV ≤ 17 mL subgroup, the LV function parameters obtained using the two methods. *** represents P ≤ 0.001
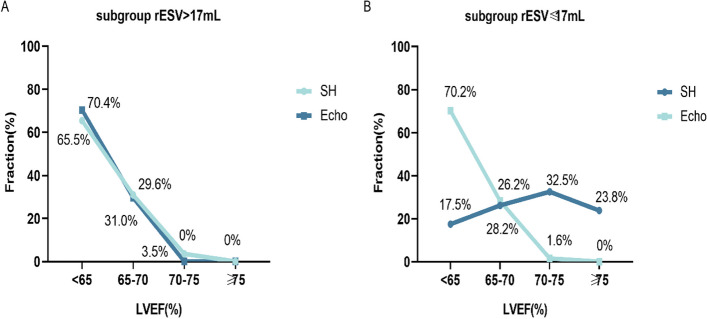
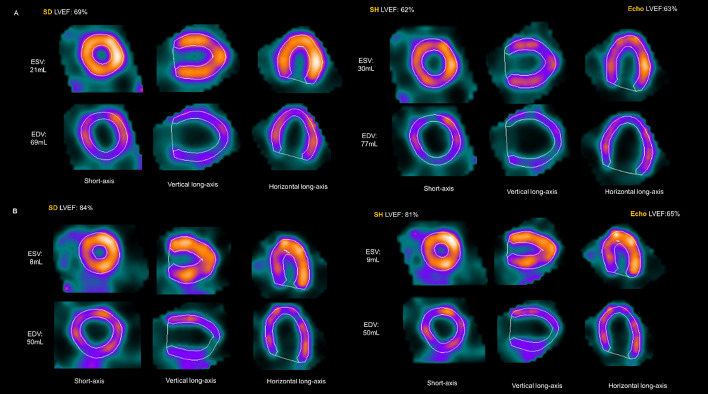
The SH-LVEF distributions and Echo-LVEF distributions were further compared and analyzed in four ranges (< 65%, 65–70%, 70–75%, ≥ 75%), and there was no significant difference in the distribution of the rESV > 17 mL subgroup (p = 0.619). Nevertheless, a significant difference was observed in the rESV ≤ 17 mL subgroup (p < 0.001) (Fig. 7). Two case examples were used as supplementary explanations (Fig. 8). Figure A featured a 61-year-old male patient with LVEF, ESV and EDV results of 69%, of 21 mL and of 69 mL for the SD protocol, 62%, 30 mL, and 77 mL for the SH protocol and 63%, 35 mL, and 97 mL for the Echo, respectively. Figure B shows a 63-year-old female patient with LVEF, ESV and EDV results of LVEF 84%, ESV 8 mL, EDV 50 mL for the SD protocol, 81%, 9 mL and 50 mL for the SH protocol, and 65%, 22 mL and 70 mL for the echo, respectively.
Fig. 7.
The distribution of LVEF values over four intervals calculated using the SH protocol and Echo. A In the rESV > 17 mL subgroup, the SH protocol and Echo were used to measure a consistent distribution of LVEF across three ranges. B In the rESV ≤ 17 mL subgroup, the SH protocol and Echo were used to measure an inconsistent distribution of LVEF across three ranges. The “Fraction” on the y-axis was defined as the proportion of the number of patients in the total study population
Fig. 8.
A A 61-year-old male patient. ESV = 21 mL calculated by the SD protocol, and the LVEFs calculated using the SD and SH protocols were 69% and 62%, respectively. Echo showed an EDV of 97 mL, an ESV of 35 mL, and a LVEF of 63% by using Teichholz’s formula. B A 63-year-old female patient. ESV = 8 mL calculated using the SD protocol, and the LVEFs calculated using the SD and SH protocols were 84% and 81%, respectively. Echo showed an EDV of 70 mL, an ESV of 22 mL, and a LVEF of 65%
Discussion
Our study revealed three main points; first, the SH reconstruction protocol could reduce the overestimation of LVEF in patients with small LV volumes; second, the best threshold for using the SH reconstruction protocol is when rESV > 17 mL; third, after reconstruction following the SH protocol in the rESV > 17 mL subgroup, the LVEF and ESV were not significantly different from the gold-standards by Echo, although it underestimated the EDV.
Small heart effect
LVEF typically plays a pivotal role in the diagnosis and prediction of cardiovascular disease, and incorrectly assessing LVEF may lead to faulty clinical decisions [22]. Although conventional NaI quantitative GSPECT has been shown to contain adequate diagnostic and prognostic information [23], limitations due to a number of physical factors, including photon scattering, insufficient spatial resolution, and partial volume effects [24, 25], can underestimate ESV in patients with a small LV volume, which consequently leads to frequent overestimation of LVEF. This condition is particularly common in Asian populations due to their generally smaller body size. Similar to the distribution of our study population (73% women), Nakajima et al. observed small LV volumes in 74% of Japanese women and 13% of men [25]. Kakhki et al. also found that in the Iranian population, where the likelihood of CAD was low, 85.4% had an ESV ≤ 25 mL (91% of women and 9% of men). Meanwhile, due to systematic and reconstruction spatial resolution limitations, the LV endocardial rim is blended together, thus making the ventricular cavity almost virtual, especially at end-systole [8].
In this regard, our study confirms that D-SPECT equipped with a new semiconductor CZT detector can solve the above problems to a certain extent. Not only designed to compensate for the lack of spatial resolution, the built-into SH reconstruction protocol has higher endocardial edge detection accuracy at end-systole, which allows for better correction of LVEF and mitigating the "small heart effect" and has enhanced clinical application in Asian populations.
Comparison of LVEF detected by CZT-SPECT with that by other imaging methods
Many studies have compared the efficacy between CZT-SPECT using the SD reconstruction protocol and other imaging methods to evaluate LV volumes. Coupez et al. compared the D-SPECT-derived resting LVEF with Echo in patients with myocardial infarction (MI), and the results showed that D-SPECT with the SD reconstruction protocol tended to overestimate LVEF compared with Echo (55.6% vs. 51.3%), but there was no statistically significant difference (p = 0.34) [6]. Cochet et al. reported that Discovery NM 530C can accurately quantify LVEF in patients with known or suspected CAD but still underestimate LV volumes compared with CMR [26]. Claudin et al. also reported that there were significant underestimations of EDV (p < 0.001, mean difference with CMR: -46 ± 25 mL) and ESV (p < 0.001, mean difference with CMR: -20 ± 19 mL) using D-SPECT with the SD reconstruction protocol; the underestimations were markedly increased for smaller LV volumes, and the volume dependence was primarily for ESV (p = 0.04) rather than EDV (p = 0.1) in patients with known or suspected CAD [27]. Similar to previous studies, we found that the LV volumes measured by D-SPECT with the SD reconstruction protocol were underestimated compared with Echo (EDV 52.35 ± 12.25 mL vs. 83.35 ± 17.83 mL, p < 0.001; ESV 15.45 ± 5.83 mL vs. 26.00 ± 7.00 mL, p < 0.01), and the SH reconstruction protocol mainly corrected ESV (26.92 ± 3.25 mL vs. 27.94 ± 7.96 mL, p = 0.596). Consequently, in clinical practice, it is essential to select the right reconstruction protocol, and the SH reconstruction protocol has been found to be effective in patients with small LV volumes.
Reconstructed spatial resolution
Reconstruction parameters are the central techniques for accurate assessment of LV functional parameters. The reconstructed spatial resolution was improved with more iterations. Compared to the SD protocol, the SH reconstruction protocol more than doubles the number of iterations (from 4 to 9). This incremental gain in the number of iterations results in sharper images, expands the measurement of the endocardial edge, and improves the accuracy of ESV and LVEF, bringing them closer to the true values. Wang et al. also reported that the full width at half-maximum (FWHM) decreased with an increasing number of iterations, and a better reconstructed spatial resolution could be obtained when the number of iterations was greater than 4 [28]. However, there is currently no unified standard for the optimal iteration number. Duarte et al. reported the use of 2 iterations with 10 or 12 subsets as the best match of the iterative algorithm when measuring the LVEF and LV volumes during GSPECT using a dynamic heart phantom [29]. A study from Bitarafan et al. reported similar results (2 iterations and 12 subsets) when compared with Echo [30]. Ceriani et al. reported that the combination of 10 iterations and 8 subsets produced the most accurate LVEF results using a dynamic heart phantom as the gold reference [31].
Nevertheless, our study also demonstrated that not all patients with small LV volumes benefit from the SH protocol, and the increase in the number of iterations does not seem to have a significant effect on the rESV ≤ 17 mL subgroups. The reason for this result is partly because the spatial resolution of D-SPECT is 5 mm, which is not very satisfactory for the outlining of particularly small cardiac chambers [32]. At the same time, the number of iterations and subsets of the SH protocol that have been developed thus far are not necessarily optimal solutions and need to be further explored in future clinical practice.
Study limitations
This study has several limitations. First, due to its retrospective design, only Echo rather than CMR could be used as a criterion for the successful correction of LVEF, which may have a small impact on the findings. Second, due to the single center nature of this study, we opted for a single postprocessing software package (QGS). Previous research has revealed that D-SPECT with different programs has a degree of variability. Consequently, a large population and multicenter external validation is needed to validate the thresholds of rESV when using the SH reconstruction protocol. Third, the photon scattering problem has not yet been resolved in this paper, and deep learning techniques could be incorporated into the reconstruction program to improve it in the future.
Conclusions
The performance of the SH reconstruction protocol was compared in this study with that of the SD reconstruction protocol in patients with small LV volumes. The findings indicate that the SH reconstruction protocol that was embedded in the D-SPECT postprocessing procedure can significantly improve the problem of insufficient myocardial delineation, especially for those with an rESV > 17 mL, allowing clinicians to make more accurate clinical decisions when evaluating patients with small LV volumes.
Abbreviations
- CAD
Coronary artery disease
- GSPECT
Gated myocardial perfusion single-photon computed tomography
- FWHM
Full width at half-maximum
- LVEF
Left ventricle ejection fraction
- ESV
End-systolic volume
- EDV
End-diastolic volume
- Echocardiography
Echo
Author contributions
FY, KS, HZ contributed to the study conception and design. YH, HZ, XH contributed to data collection and analysis. YH, SQ contributed to data reconstruction and validation. YH, HZ and XH were the major contributors in writing the manuscript and all authors commented on previous versions of the manuscript. All authors read and approved the final manuscript.
Funding
The study was supported by the National Natural Science Foundation of China (No. 82071956), the Explorer Program of the Science and Technology Commission of Shanghai Municipality (No. 22TS1400500), and the Construction Project of Shanghai Key Laboratory of Molecular Imaging (No. 18DZ2260400).
Availability of data and materials
The datasets generated during and/or analyzed during the current study are available from the corresponding author on reasonable request.
Declarations
Ethics approval and consent to participate
The ethics committee of Shanghai Tenth People’s Hospital approved the protocol under the approval number: SHSY-IEC-4.1/21-126/01.
Consent for publication
Not applicable.
Competing interests
The authors declare that they have no competing interests.
Footnotes
Publisher's Note
Springer Nature remains neutral with regard to jurisdictional claims in published maps and institutional affiliations.
Yan Huang, Han Zhang and Xueping Hu have equal contribution to this study as first co-author.
References
- 1.Hachamovitch R, Berman DS, Shaw LJ, Kiat H, Cohen I, Cabico JA, et al. Incremental prognostic value of myocardial perfusion single photon emission computed tomography for the prediction of cardiac death: differential stratification for risk of cardiac death and myocardial infarction. Circulation. 1998;97:535–543. doi: 10.1161/01.CIR.97.6.535. [DOI] [PubMed] [Google Scholar]
- 2.Virani SS, Newby LK, Arnold SV, Bittner V, Brewer LC, Demeter SH, et al. AHA/ACC/ACCP/ASPC/NLA/PCNA guideline for the management of patients with chronic coronary disease. J Am Coll Cardiol. 2023;2023:S0735109723052816. [Google Scholar]
- 3.Maaniitty T, Knuuti J, Saraste A. Improvement in quantitative myocardial perfusion metrics after revascularization in chronic coronary artery disease. Eur Heart J Cardiovasc Imaging. 2022;23:753–754. doi: 10.1093/ehjci/jeac014. [DOI] [PubMed] [Google Scholar]
- 4.Go V, Bhatt MR, Hendel RC. The diagnostic and prognostic value of ECG-gated SPECT myocardial perfusion imaging. J Nucl Med. 2004;45(5):912–921. [PubMed] [Google Scholar]
- 5.Tissot H, Roch V, Morel O, Veran N, Perrin M, Claudin M, et al. Left ventricular ejection fraction determined with the simulation of a very low-dose CZT-SPECT protocol and an additional count-calibration on planar radionuclide angiographic data. J Nucl Cardiol. 2019;26:1539–1549. doi: 10.1007/s12350-019-01619-w. [DOI] [PubMed] [Google Scholar]
- 6.Coupez E, Merlin C, Tuyisenge V, Sarry L, Pereira B, Lusson JR, et al. Validation of cadmium–zinc–telluride camera for measurement of left ventricular systolic performance. J Nucl Cardiol. 2018;25:1029–1036. doi: 10.1007/s12350-017-0816-0. [DOI] [PubMed] [Google Scholar]
- 7.Ioannidis JPA, Trikalinos TA, Danias PG. Electrocardiogram-gated single-photonemission computed tomography versus cardiacmagnetic resonance imaging for the assessmentof left ventricular volumes and ejection fraction. J Am Coll Cardiol. 2002;39:2059–2068. doi: 10.1016/S0735-1097(02)01882-X. [DOI] [PubMed] [Google Scholar]
- 8.Kakhki VRD, Sadeghi R. Gated myocardial perfusion SPECT in patients with a small heart: effect of zooming and filtering. Clin Nucl Med. 2007;32:404–406. doi: 10.1097/01.rlu.0000259629.30918.88. [DOI] [PubMed] [Google Scholar]
- 9.Nakajima K, Okuda K, Nyström K, Richter J, Minarik D, Wakabayashi H, et al. Improved quantification of small hearts for gated myocardial perfusion imaging. Eur J Nucl Med Mol Imaging. 2013;40:1163–1170. doi: 10.1007/s00259-013-2431-x. [DOI] [PMC free article] [PubMed] [Google Scholar]
- 10.Tsuboi K, Nagaki A, Shibutani T, Onoguchi M. Optimal choice of OSEM and SD reconstruction algorithms in CZT SPECT for hypertrophic cardiomyopathy patients. J Nucl Cardiol. 2021;28:236–244. doi: 10.1007/s12350-019-01677-0. [DOI] [PubMed] [Google Scholar]
- 11.Yoneyama H, Nakajima K, Okuda K, Matsuo S, Onoguchi M, Kinuya S, et al. Reducing the small-heart effect in pediatric gated myocardial perfusion single-photon emission computed tomography. J Nucl Cardiol. 2017;24:1378–1388. doi: 10.1007/s12350-016-0518-z. [DOI] [PubMed] [Google Scholar]
- 12.Kondo C, Watanabe E, Momose M, Fukushima K, Abe K, Hagiwara N, et al. In vivo validation of gated myocardial SPECT imaging for quantification of small hearts: comparison with cardiac MRI. EJNMMI Res. 2016;6:9. doi: 10.1186/s13550-015-0156-5. [DOI] [PMC free article] [PubMed] [Google Scholar]
- 13.Feng B, Sitek A, Gullberg GT. Calculation of the left ventricular ejection fraction without edge detection: application to small hearts. J Nucl Med. 2002;43(6):786–794. [PubMed] [Google Scholar]
- 14.Alenazy AB, Wells RG, Ruddy TD. New solid state cadmium-zinc-telluride technology for cardiac single photon emission computed tomographic myocardial perfusion imaging. Expert Rev Med Devices. 2017;14:213–222. doi: 10.1080/17434440.2017.1296763. [DOI] [PubMed] [Google Scholar]
- 15.Zhang H, Caobelli F, Che W, Huang Y, Zhang Y, Fan X, et al. The prognostic value of CZT SPECT myocardial blood flow (MBF) quantification in patients with ischemia and no obstructive coronary artery disease (INOCA): a pilot study. Eur J Nucl Med Mol Imaging. 2023;50:1940–1953. doi: 10.1007/s00259-023-06125-3. [DOI] [PMC free article] [PubMed] [Google Scholar]
- 16.Henzlova MJ, Duvall WL, Einstein AJ, Travin MI, Verberne HJ. ASNC imaging guidelines for SPECT nuclear cardiology procedures: stress, protocols, and tracers. J Nucl Cardiol. 2016;23:606–639. doi: 10.1007/s12350-015-0387-x. [DOI] [PubMed] [Google Scholar]
- 17.Erlandsson K, Kacperski K, Van Gramberg D, Hutton BF. Performance evaluation of D-SPECT: a novel SPECT system for nuclear cardiology. Phys Med Biol. 2009;54:2635–2649. doi: 10.1088/0031-9155/54/9/003. [DOI] [PubMed] [Google Scholar]
- 18.Salvadori J, Petegnief Y, Sabbah R, Morel O, Boulahdour H, Karcher G, et al. Compared vulnerabilities to small cardiac motions between different cameras used for myocardial perfusion imaging. J Nucl Cardiol. 2019;26(4):1313–1322. doi: 10.1007/s12350-017-1175-6. [DOI] [PubMed] [Google Scholar]
- 19.Gambhir SS, Berman DS, Ziffer J, Nagler M, Sandler M, Patton J, et al. A novel high-sensitivity rapid-acquisition single-photon cardiac imaging camera. J Nucl Med. 2009;50:635–643. doi: 10.2967/jnumed.108.060020. [DOI] [PubMed] [Google Scholar]
- 20.Lang RM, Badano LP, Mor-Avi V, Afilalo J, Armstrong A, Ernande L, et al. Recommendations for cardiac chamber quantification by echocardiography in adults: an update from the American Society of Echocardiography and The European Association of Cardiovascular Imaging. Eur Heart J Cardiovasc Imaging. 2015;16:233–271. doi: 10.1093/ehjci/jev014. [DOI] [PubMed] [Google Scholar]
- 21.Youden WJ. Index for rating diagnostic tests. Cancer. 1950;3:32–35. doi: 10.1002/1097-0142(1950)3:1<32::AID-CNCR2820030106>3.0.CO;2-3. [DOI] [PubMed] [Google Scholar]
- 22.He B, Kwan AC, Cho JH, Yuan N, Pollick C, Shiota T, et al. Blinded, randomized trial of sonographer versus AI cardiac function assessment. Nature. 2023;616:520–524. doi: 10.1038/s41586-023-05947-3. [DOI] [PMC free article] [PubMed] [Google Scholar]
- 23.Wei H, Wu J, Han K, Hu G, Wang H, Guo X, et al. CMR validation of left ventricular volumes and ejection fraction measured by the IQ-SPECT system in patients with small heart size. EJNMMI Res. 2023;13:33. doi: 10.1186/s13550-023-00987-2. [DOI] [PMC free article] [PubMed] [Google Scholar]
- 24.Khalil MM, Elgazzar A, Khalil W, Omar A, Ziada G. Assessment of left ventricular ejection fraction by four different methods using 99mTc tetrofosmin gated SPECT in patients with small hearts: correlation with gated blood pool. Nucl Med Commun. 2005;26:885–893. doi: 10.1097/00006231-200510000-00007. [DOI] [PubMed] [Google Scholar]
- 25.Nakajima K, Taki J, Higuchi T, Kawano M, Taniguchi M, Maruhashi K, et al. Gated SPET quantification of small hearts: mathematical simulation and clinical application. Eur J Nucl Med. 2000;27:1372–1379. doi: 10.1007/s002590000299. [DOI] [PubMed] [Google Scholar]
- 26.Cochet H, Bullier E, Gerbaud E, Durieux M, Godbert Y, Lederlin M, et al. Absolute quantification of left ventricular global and regional function at nuclear MPI using ultrafast CZT SPECT: initial validation versus cardiac MR. J Nucl Med. 2013;54:556–563. doi: 10.2967/jnumed.112.110577. [DOI] [PubMed] [Google Scholar]
- 27.Claudin M, Imbert L, Djaballah W, Veran N, Poussier S, Roch V, et al. Routine evaluation of left ventricular function using CZT-SPECT, with low injected activities and limited recording times. J Nucl Cardiol. 2018;25:249–256. doi: 10.1007/s12350-016-0615-z. [DOI] [PubMed] [Google Scholar]
- 28.Wang M, Dong S, Zhang R, Sun D, Wang S, Shen Y, et al. Impact of reconstruction parameters on spatial resolution and its comparison between cadmium-zinc-telluride SPECT/CT and conventional SPECT/CT. Nucl Med Commun. 2022;43:8–16. doi: 10.1097/MNM.0000000000001484. [DOI] [PubMed] [Google Scholar]
- 29.Duarte DD, Monteiro MS, Hakmaoui FE, Prior JO, Vieira L, Pires-Jorge JA. Influence of reconstruction parameters during filtered backprojection and ordered-subset expectation maximization in the measurement of the left-ventricular volumes and function during gated SPECT. J Nucl Med Technol. 2012;40:29–36. doi: 10.2967/jnmt.111.094599. [DOI] [PubMed] [Google Scholar]
- 30.Bitarafan A, Rajabi H. The effect of filtrating and reconstruction method on the left ventricular ejection fraction derived from GSPET: a statistical comparison of angiography and echocardiography. Ann Nucl Med. 2008;22:707–713. doi: 10.1007/s12149-008-0161-0. [DOI] [PubMed] [Google Scholar]
- 31.Ceriani L, Ruberto T, Delaloye AB, Prior JO, Giovanella L. Three-dimensional ordered-subset expectation maximization iterative protocol for evaluation of left ventricular volumes and function by quantitative gated SPECT: a dynamic phantom study. J Nucl Med Technol. 2010;38:18–23. doi: 10.2967/jnmt.109.070243. [DOI] [PubMed] [Google Scholar]
- 32.Slomka PJ, Miller RJH, Hu L-H, Germano G, Berman DS. Solid-state detector SPECT myocardial perfusion imaging. J Nucl Med. 2019;60:1194–1204. doi: 10.2967/jnumed.118.220657. [DOI] [PubMed] [Google Scholar]
Associated Data
This section collects any data citations, data availability statements, or supplementary materials included in this article.
Data Availability Statement
The datasets generated during and/or analyzed during the current study are available from the corresponding author on reasonable request.


