Correction to: Scientific Reports 10.1038/s41598-023-46539-5, published online 06 November 2023
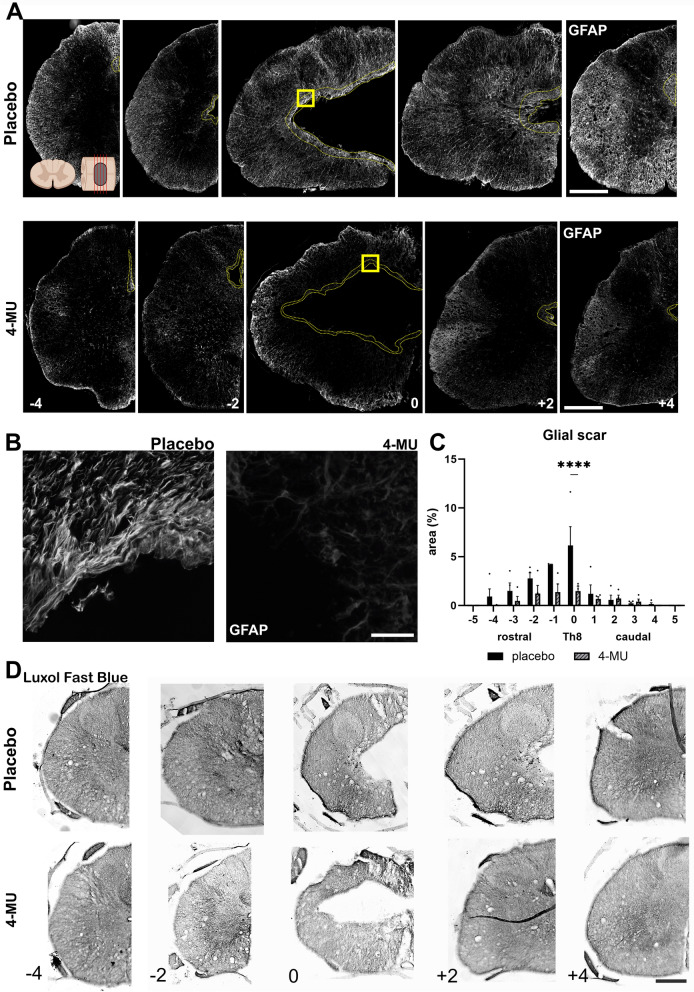
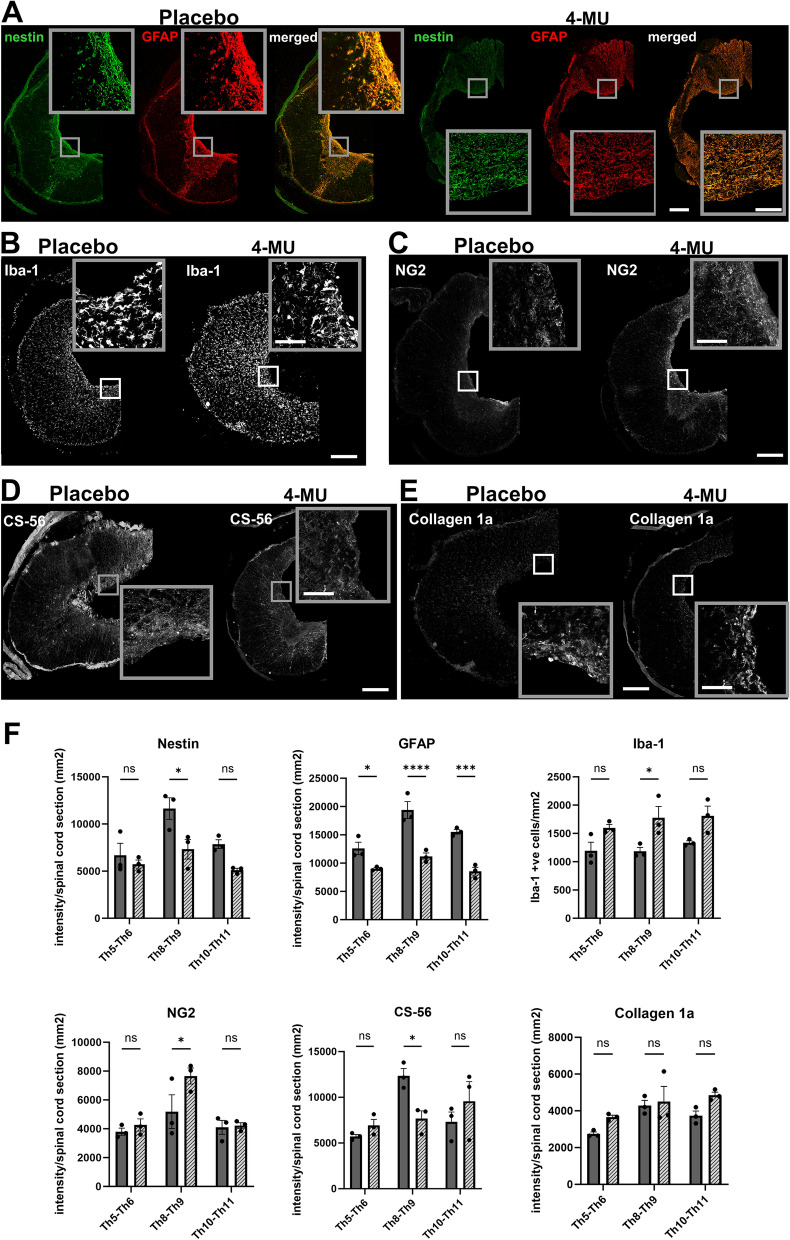
The original version of this Article contained errors. As a result of incorrect figure assembly, in Figure 6D the image of Luxol Fast Blue staining for the +2 mm level was a duplication of the 0 mm level. Additionally, in Figure 7E the images were inadvertently switched for ‘Placebo’ and ‘4-MU’.
The original Figures 6 and 7 and their accompanying legends appear below.
Figure 6.
4-MU treatment reduced glial scar area surrounding the lesion site. (A) Representative fluorescent images showing lesion epicentre (0 mm), above (− 4, − 2 mm) and below (+ 2, + 4 mm) the lesion, stained for glial fibrillary acidic protein (GFAP) in placebo and 4-MU treated group with chronic spinal cord injury. Dotted lines show the border area of the lesion cavity in 4-MU treated group and GFAP positive area in placebo group. Scale bar: 200 µm. Diagram of uninjured spinal cord at top left showing the direction of the cross section in (A), created with BioRender.com; (B) magnified images (yellow square in A) showing structural change of the glial scar tissue after 4-MU treatment compared to placebo treated animals. Scale bar 30 µm; (C) bar graph showing area of the glial scar around the central cavity performed in the GFAP stained histochemical images using ImageJ software. Values are plotted as mean ± SEM; ****p < 0.0001 by two-way ANOVA, Sidak post-hoc test. (n = 4 animals per group). (D) Representative images of Luxol Fast Blue staining showing the lesion extension in a rostro-caudal direction. Scale bar 200 µm.
Figure 7.
4-MU treatment leads to changes of cell and ECM composition around the lesion scar (Th8-9), above (Th5-6) and below (Th10-11) lesion. (A–E) Representative confocal images showing the 4-MU-mediated effect on scar-forming cells and components using different markers—(A) nestin and GFAP were used to visualise scar-forming astrocytes. (B) Iba-1 to visualise microglia/macrophages. (C) NG2 to visualise oligodendrocyte progenitor cells (OPCs). (D) CS-56 to examine the changes in CS sulfations. (E) Collagen 1a to visualise meninges and fibroblasts. All insets show magnified views of the staining. Scale bar 200 µm for the overview image and 50 µm for the insets. (F) Quantification of (A–E). Bar graphs show intensities per section throughout the spinal cord, except for Iba-1 staining where the number of Iba-1 positive cells per mm was counted. Individual data are shown with their mean ± SEM (n = 3 animals per group). p < 0.05, **p < 0.01, ***p < 0.001, ****p < 0.0001, by two-way ANOVA, Sidak's multiple comparison test.
The original Article has been corrected.
Contributor Information
Kateřina Štepánková, Email: katerina.stepankova@iem.cas.cz.
Lucia Machová Urdzíková, Email: lucia.machova@iem.cas.cz.
Pavla Jendelová, Email: pavla.jendelova@iem.cas.cz.
Jessica C. F. Kwok, Email: j.kwok@leeds.ac.uk


