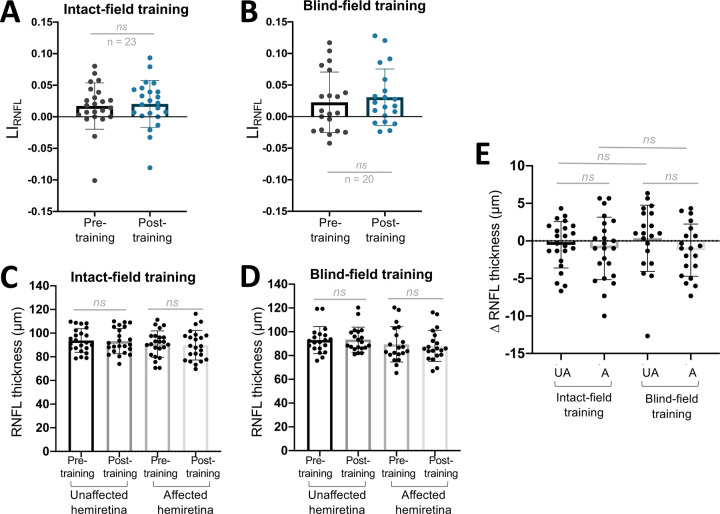
Figure 6.
A: Plot of LIRNFL pre- to post-training of participants who trained in their IF (paired t-test, CI95 =−0.003 to 0.0123, t22 = 0.7322, p = 0.4718). B: Plot of LIRNFL pre- to post-training of participants who trained in their BF (paired t-test, CI95 = −0.0036 to 0.0197, t19 = 1.446, p = 0.1645). C: Comparison of unaffected and affected RNFL thicknesses, before and after IF training (unaffected pre- vs post-training: paired t-test, CI95 = −1.860 to 0.8163, p = 0.4274; affected pre- vs post-training: paired t-test, CI95 = −2.796 to 0.7962, p = 0.2606). D: Comparison of unaffected and affected RNFL thicknesses, before and after BF training (unaffected pre- vs post-training: paired t-test, CI95 = −1.714 to 2.414, p = 0.7266; affected pre- vs post-training: paired t-test, CI95 = −2.862 to 0.3951, p = 0.1294). E: Comparison of change in RNFL thickness from pre- to post-training in IF or BF-trained participants (unaffected vs affected in IF-trained subjects: paired t-test, CI95=−2.096 to 1.139, p=0.546; unaffected vs affected in BF-trained subjects: paired t-test, CI95=−3.627 to 0.4601, p=0.1213; unaffected vs unaffected of both training groups: unpaired t-test, CI95=−1.451 to 3.195, p=0.4529; affected vs affected of both training groups: unpaired t-test, CI95=−2.614 to 2.148, p=0.8441). A: Affected, UA: Unaffected, ns: not statistically significant.

