Abstract
Background
Metastasis is the primary cause of recurrence and death in patients with papillary thyroid carcinoma (PTC). LncRNA ACTA2-AS1, a long non-coding RNA, acts as a tumor suppressor in multiple types of human malignancies, while the role of ACTA2-AS1 in PTC metastasis remains unclear.
Methods
The ACTA2-AS1 expression in PTC tissues was analyzed. The sponged roles of ACTA2-AS1 via miR-4428/KLF9 axis were identified using starBase tool. The function of ACTA2-AS1 in PTC was performed with in vitro and in vivo experiments. The correlation between DNA methylation and mRNA expressions of these gene in the TCGA dataset was explored.
Results
ACTA2-AS1 expression was downregulated in PTC tissues without metastasis and further decreased in PTC tissues with lymph node metastasis compared with that in normal tissues. Functionally, the overexpression of ACTA2-AS1 inhibited the growth, proliferation, and invasion of PTC cells, whereas its depletion exerted opposite effect. In vivo, ACTA2-AS1 expression inhibited PTC metastasis. Furthermore, ACTA2-AS1 acted as a competing endogenous RNA for miR-4428, thereby positively regulating the expression of miR-4428 target gene, KLF9. Finally, miR-4428 overexpression enhanced invasive potential of PTC cells and significantly weakened the effects of ACTA2-AS1 on promotion and inhibition of KLF9 expression as well as invasive ability of PTC cells, respectively. In the TCGA dataset, the methylation level of ACTA2-AS1 was significantly correlated with its mRNA expression (r = 0.21, p = 2.1 × e−6).
Conclusions
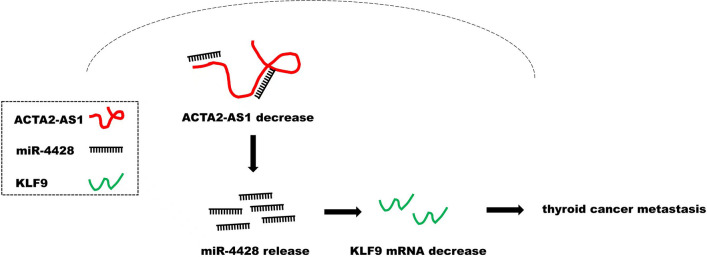
Our findings demonstrate that ACTA2-AS1 functions as a tumor suppressor in PTC progression at least partly by regulating the miR-4428-dependent expression of KLF9.
Graphical abstract
Supplementary Information
The online version contains supplementary material available at 10.1186/s13148-023-01622-6.
Keywords: lncRNA, ACTA2-AS1, miR-4428, KLF9, Papillary thyroid carcinoma
Background
Thyroid carcinoma (TC) is the most frequently diagnosed malignancy of the endocrine system, with an estimated 586,000 new cases and 43,600 deaths worldwide in 2020 [1]. The incidence of TC has increased continuously over the past few decades [2, 3] while TC-associated mortality is approximately 3 and 5 per million among men and women, respectively [1]. TC originates from follicular cells (approximately 90% of cases) or parafollicular cells (approximately 10% of cases) [3]. TCs of follicular origin comprise four types, among which papillary TC (PTC) is the most frequent histologic subtype, accounting for 80–90% of the total [4]. Several risk factors for PTC have been identified to date, including ionizing radiation, abnormal iodine intake, and genetic factors [5, 6]. However, the molecular mechanisms underlying PTC development remain unclear.
Long non-coding RNAs (lncRNAs) are initially thought to be merely by-products of transcription; however, they are now known to be functional RNA transcripts > 200 nucleotides in length which play critical roles in the etiology of a variety of human diseases [7, 8]. LncRNAs, such as HOTAIR, PCGEM1, H19, and UCA1, are dysregulated in many types of tumor tissues and can function either as oncogenes or tumor suppressors through regulating cancer cell growth, apoptosis, and invasion [9–11]. For instance, HOTAIR levels are increased in PTC tissues, which accelerates PTC progression through the upregulation of cyclin D2 expression [12, 13]. When upregulated, H19 facilitates epithelial–mesenchymal transition and PTC cell invasion via repressing the expression of E-cadherin, thus increasing expression of vimentin [14, 15]. The levels of ACTA2-AS1 are significantly decreased in human colon lung tissues. Meanwhile, its overexpression represses the proliferative and colony-forming abilities of cancer cells by decreasing BIM expression [16]. ACTA2-AS1 is also associated with tumor progression in lung and liver cancer [17–19]. However, the role of ACTA2-AS1 in PTC metastasis remains unclear.
MicroRNAs (miRNAs) comprise another class of functional ncRNAs with lengths ranging from 19 to 25 nucleotides. MiRNAs exert crucial regulatory effects in different types of human diseases. For instance, miR-4428 and miR-155 are dysregulated in many types of tumor tissues, while abnormal miRNA expression is correlated with tumorigenesis and poor prognosis [20, 21]. Additionally, miR-200a overexpression accelerates bladder cancer cell proliferation and invasion by targeting Dicer [22].
Interestingly, lncRNAs frequently exert their promotive effects on cancer progression by functioning as competing endogenous RNAs (ceRNAs), sponging miRNAs through miRNA-response elements (MREs) [23]. In this study, we found that ACTA2-AS1 levels were downregulated in metastatic PTC tissues, and that ACTA2-AS1 overexpression inhibited PTC metastasis through sponging miR-4428 and, consequently, upregulating KLF9 expression.
Results
Downregulation of ACTA2-AS1 expression in PTC
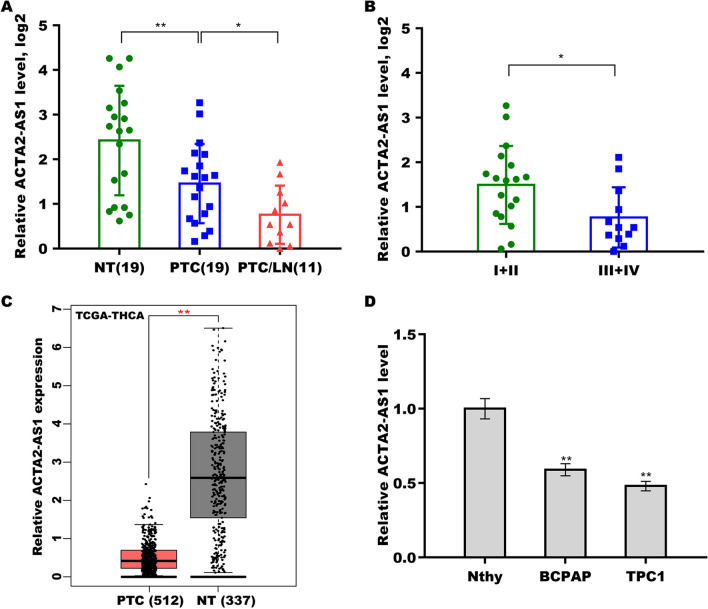
Recent studies have demonstrated that ACTA2-AS1 inhibits tumor progression and mitigates resistance to chemotherapy in various cancers [16–19]. To address whether ACTA2-AS1 influences PTC metastasis, we assessed the levels of ACTA2-AS1 in 19 PTC tissues and matched normal tissues. As shown in Fig. 1A, compared with control tissues, ACTA2-AS1 level was significantly downregulated in PTC tissues. Moreover, the ACTA2-AS1 level was continuously downregulated in PTC tissues with lymph node metastasis (Fig. 1A). The ACTA2-AS1 level was lower in PTC tissues at clinical stages III/IV than in those at clinical stages I/II (Fig. 1B), indicating that ACTA2-AS1 expression is negatively correlated with PTC progression.
Fig. 1.
ACTA2-AS1 levels were downregulated in papillary thyroid carcinoma (PTC). A qRT-PCR analysis of the levels of ACTA2-AS1 in normal thyroid tissues (n = 19), PTC tissues without metastasis (n = 19), and PTC tissues with lymph node metastasis (n = 11). The data were log2-transformed (2–ΔΔCt). B qRT-PCR analysis of the levels of ACTA2-AS1 in stage I/II (n = 18) and stage III/IV (n = 12) PTC tissues. The data were log2-transformed (2–ΔΔCt). C The levels of ACTA2-AS1 were analyzed in 512 thyroid carcinoma tissues and 337 normal tissues in The Cancer Genome Atlas (TCGA)/Genotype-Tissue Expression (GTEx) datasets from GEPIA. D qRT-PCR analysis of ACTA2-AS1 levels in BCPAP, TPC1, and Nthy-ori 3–1 cells. *p < 0.05, **p < 0.01
The ACTA2-AS1 expression was then analyzed based on data for 512 thyroid carcinoma tissues and 337 normal tissues in The Cancer Genome Atlas (TCGA)/Genotype-Tissue Expression (GTEx) datasets from the GEPIA webserver (http://gepia.cancer-pku.cn/index.html). As shown in Fig. 1C, ACTA2-AS1 expression was significantly decreased in PTC compared with that in normal tissues. ACTA2-AS1 expression was also lower in the PTC cell lines than in Nthy cells (Fig. 1D).
Inhibition of ACTA2-AS1in the growth and proliferation of PTC cells
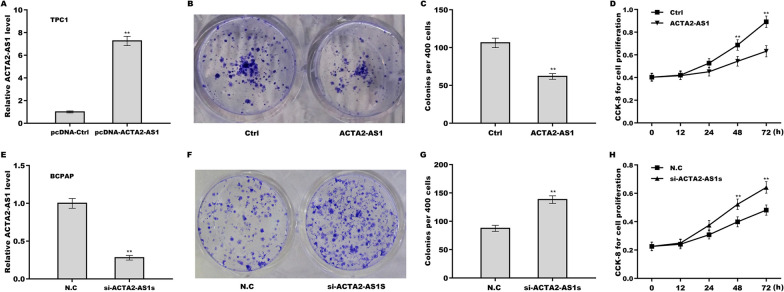
To assess the effect of ACTA2-AS1 on the growth and proliferation of PTC cells, ACTA2-AS1 was overexpressed in TPC1 cells (Fig. 2A) and silenced in BCPAP cells (Fig. 2E). The results of the colony formation assay revealed that upregulation of ACTA2-AS1 significantly repressed the growth of TPC1 cells (Fig. 2B, C), whereas its silencing elicited the opposite effect in BCPAP cells (Fig. 2F, G). Meanwhile, the results of the CCK-8 assay showed that ACTA2-AS1 overexpression suppressed TPC1 cell proliferation (Fig. 2D), whereas ACTA2-AS1 silencing enhanced the proliferative potential of BCPAP cells (Fig. 2H).
Fig. 2.
ACTA2-AS1 inhibited the growth and proliferation of papillary thyroid carcinoma (PTC) cells. A qRT-PCR analysis of ACTA2-AS1 levels in TPC1 cells overexpressing ACTA2-AS1. B, C The growth of ACTA2-AS1-overexpressing TPC1 cells was assessed using a colony formation assay. D The proliferative ability of ACTA2-AS1-overexpressing TPC1 cells was assessed by Cell Counting Kit-8 (CCK-8) assay. E qRT-PCR analysis of ACTA2-AS1 levels in ACTA2-AS1-knockdown BCPAP cells. F, G The growth of ACTA2-AS1-silenced BCPAP cells was assessed using a colony formation assay. H The proliferative ability of ACTA2-AS1-silenced BCPAP cells was assessed by CCK-8 assay. *p < 0.05, **p < 0.01
Inhibition of ACTA2-AS1in PTC metastasis
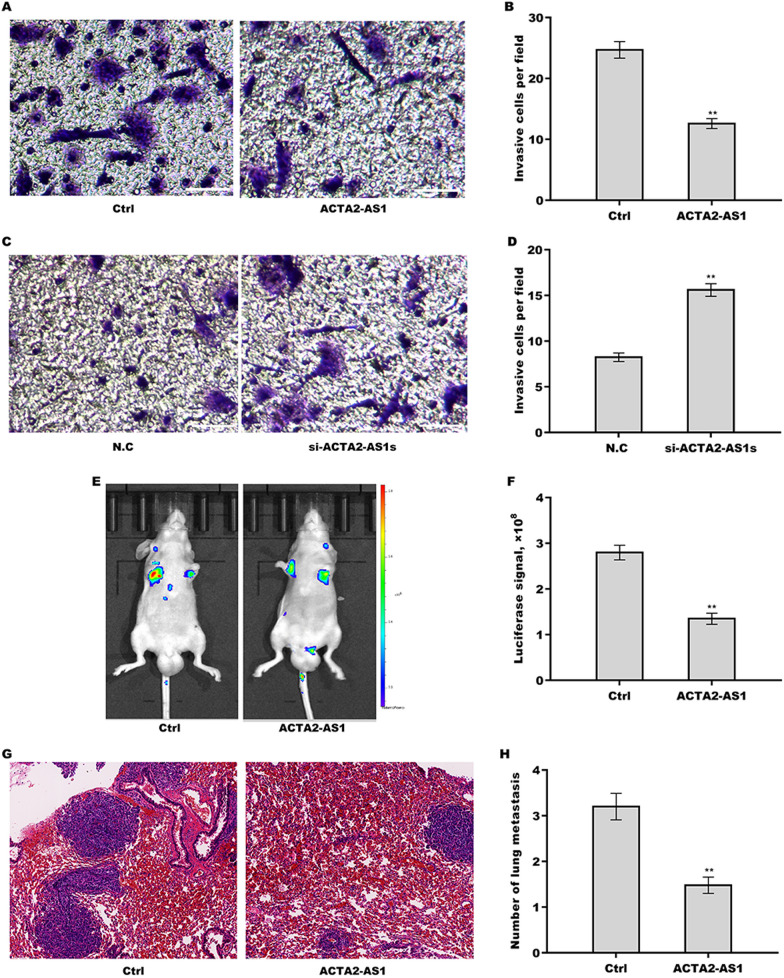
We explored the effect of ACTA2-AS1 on the invasive and metastatic potential of PTC cells. Transwell invasion assay revealed that ACTA2-AS1 overexpression significantly inhibited the invasive potential of TPC1 cells (Fig. 3A and B), whereas the silencing of ACTA2-AS1 greatly enhanced the invasive ability of BCPAP cells (Fig. 3C and D). To investigate the effect of ACTA2-AS1 on PTC metastasis, a lung metastasis model was established in mice through the injection of ACTA2-AS1-overexpressing TPC1 cells. As shown in Fig. 3E and F, ACTA2-AS1 overexpression significantly suppressed the lung metastasis of TPC1 cells. Moreover, the H&E staining indicated that ACTA2-AS1-overexpressing TPC1 cells formed fewer and smaller metastatic lung nodules when compared with untransfected TPC1 cells (Fig. 3G, H).
Fig. 3.
ACTA2-AS1 inhibited papillary thyroid carcinoma (PTC) metastasis. A, B Transwell invasion assay for the invasive ability of ACTA2-AS1-overexpressing TPC1 cells (A) and the respective quantitative analysis (B). Scale bar, 50 µm and magnification, 200× . C, D Transwell invasion assay for the invasive ability of ACTA2-AS1-silenced BCPAP cells (C) and the respective quantitative analysis (D). Scale bar, 50 µm and magnification, 200× . E, F ACTA2-AS1-overexpressing TPC1 cells were injected into nude mice via the tail vein (n = 3) and the extent of tumor metastasis was determined after 9 weeks using in vivo bioluminescent imaging. G Hematoxylin and eosin (H&E) staining was carried out to assess cancer metastasis to lung tissues. Scale bar, 100 µm and magnification, 100× . H Quantification of lung metastatic nodules. *p < 0.05, **p < 0.01
ACTA2-AS1 function as a sponge of miR-4428
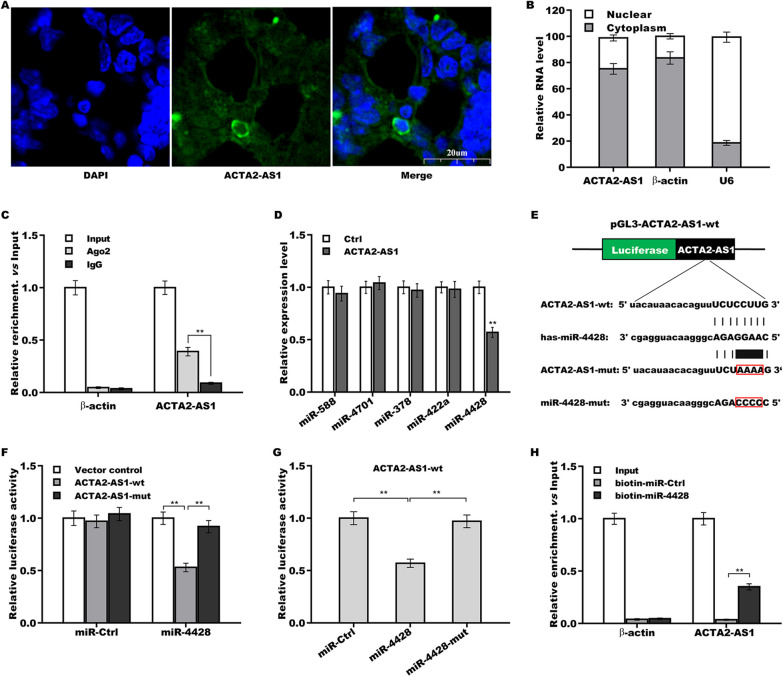
LncRNAs located in the cytoplasm frequently act as ceRNAs, sponging miRNAs through miRNA response elements (MREs), thereby regulating mRNA expression [24, 25]. We next assessed cellular localization of ACTA2-AS1 using a FISH assay. As demonstrated in Fig. 4A, ACTA2-AS1 was found to predominantly localize to the cytoplasm in TPC1 cells, which was further confirmed via qRT-PCR (Fig. 4B). Furthermore, a RIP assay using an anti-AGO2 antibody showed that ACTA2-AS1 was highly enriched in AGO2-immunoprecipitated complexes (Fig. 4C), suggesting that ACTA2-AS1 might act as a ceRNA and, consequently, a miRNA sponge. To investigate this possibility, the starBase platform (http://starbase.sysu.edu.cn/) was employed to predict miRNAs which may be sponged by ACTA2-AS1, leading to the identification of five putative miRNAs—miR-588, miR-4701, miR-378, miR-422a, and miR-4428 (Additional file 2: Table S2). Subsequently, in TPC1 cells, ACTA2-AS1 overexpression was found to significantly decrease the expression of miR-4428, but not that of the other four miRNAs (Fig. 4D).
Fig. 4.
ACTA2-AS1 functioned as a ceRNA in sponging miR-4428. A FISH analysis of ACTA2-AS1 subcellular localization in TPC1 cells. ACTA2-AS1 probes are stained in green and nuclei are stained in blue. Scale bar, 20 µm and magnification, 400 × . B Total RNA was extracted from the nucleus and cytoplasm following which the ACTA2-AS1 level was assessed using qRT-PCR. C A RNA immunoprecipitation (RIP) assay was performed with an anti-AGO2 antibody to assess the enrichment of ACTA2-AS1 in AGO2-immunoprecipitated complexes in TPC1 cells. IgG served as a negative control; 10% of the total RNA was used as input. D MiRNA expression in ACTA2-AS1-overexpressing TPC1 cells was assessed by qRT-PCR. E Sequence analysis revealed that ACTA2-AS1 harbors a complementary miR-4428 target site. F pGL3-ACTA2-AS1-wt or pGL3-ACTA2-AS1-mut and miR-4428 were co-transfected into TPC1 cells and then luciferase activity was measured. G pGL3-ACTA2-AS1-wt and miR-4428 or miR-4428-mut were co-transfected into TPC1 cells and then luciferase activity was measured. H RNA pull-down was carried out with biotin-labeled miR-4428 to assess the enrichment of ACTA2-AS1 in miR-4428-immunoprecipitated complexes in TPC1 cells. **p < 0.01
Given that ACTA2-AS1 harbors a complementary miR-4428 target site (Fig. 4E), we then assessed whether ACTA2-AS1 functions as a sponge of miR-4428 via the binding of miR-4428 seed region. For this, recombinant plasmids containing the complementary miR-4428 target site in ACTA2-AS1 (pGL3-ACTA2-AS1-wt and its mutant form pGL3-ACTA2-AS1-mut) were constructed. Each plasmid was separately co-transfected with miR-4428 into TPC1 cells, and then the effect on luciferase activity was assessed. The results showed that luciferase activity was markedly suppressed when miR-4428 was co-transfected with pGL3-ACTA2-AS1-wt; in contrast, luciferase activity was lost when miR-4428 was co-transfected with pGL3-ACTA2-AS1-mut, which harbors a four-nucleotide mutation in the complementary miR-4428 target site (Fig. 4F). Moreover, the mutation of four nucleotides in miR-4428 seed region also led to the complete suppression of pGL3-ACTA2-AS1-wt-related luciferase activity (Fig. 4G). Finally, the results of RNA pull-down with biotin-labeled miR-4428 showed that ACTA2-AS1 was highly enriched in miR-4428-immunoprecipitated complexes (Fig. 4H).
Enhancement of MiR-4428 in the invasive capacity of PTC cells via regulating KLF9 expression
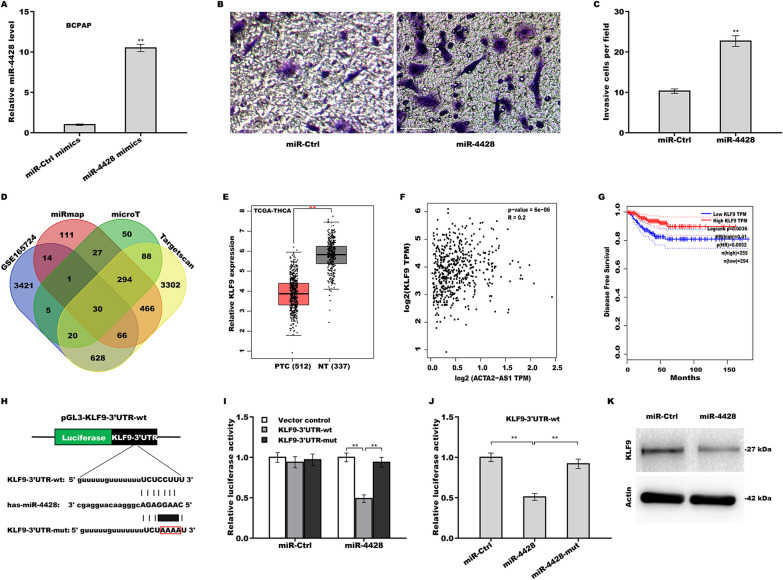
As shown in Fig. 5A–C, we found that miR-4428 overexpression led to a significant increase in invasive potential of BCPAP cells. We then sought to identify miR-4428 target gene using both bioinformatic analysis and functional experiments. Three bioinformatics tools (TargetScan, microT, and miRmap) and the GSE165724 dataset were used to predict the miR-4428 target genes. Venn diagram analysis identified 30 genes as being miR-4428 targets in all four sets of data (Fig. 5D, Additional file 3: Table S3). Among the 30 genes, KLF9 was selected for further study based on the following four reasons: (i) KLF9 expression was lower in PTC tissues than in matched normal tissues in GSE165724 dataset [26] and KLF9 is a known tumor suppressor; [27–29] (ii) KLF9 expression was markedly lower in thyroid carcinoma tissues than in normal tissues in TCGA/GTEx datasets from GEPIA (Fig. 5E); (iii) the level of KLF9 was positively correlated with that of ACTA2-AS1 in TCGA/GTEx datasets (Fig. 5F); and (iv), low KLF9 expression was significantly correlated with worse disease-free survival in thyroid cancer patients (Fig. 5G).
Fig. 5.
MiR-4428 enhanced the invasive capacity of PTC cells by regulating KLF9 expression. A The levels of miR-4428 in BCPAP cells treated with miR-4428 mimics were assessed by qRT-PCR. B Transwell invasion assay for the invasive ability of miR-4428-overexpressing BCPAP cells and C the respective quantitative analysis. Scale bar, 50 µm and magnification, 200× . D Three bioinformatics tools (TargetScan, miRmap, and microT, respectively) and the GSE165724 dataset were employed for the prediction of miR-4428 target genes. E The KLF9 level was analyzed in 512 PTC tissues and 337 normal tissues in The Cancer Genome Atlas (TCGA) and Genotype-Tissue Expression (GTEx) datasets from GEPIA. F The correlation between ACTA2-AS1 and KLF9 levels based on information from the TCGA and GTEx datasets from GEPIA. G Analysis of the correlation between KLF9 expression and disease-free survival using the GEPIA tool. H Sequence analysis revealed that KLF9 harbors a complementary miR-4428 target site. I pGL3-KLF9-3’UTR-wt or pGL3-KLF9-3’UTR-mut was co-transfected with miR-4428 into TPC1 cells following which luciferase activity was measured. G pGL3-KLF9-3’UTR-wt and miR-4428 or miR-4428-mut were co-transfected into TPC1 cells and then luciferase activity was measured. K The KLF9 protein level was measured by western bot in miR-4428-overexpressing BCPAP cells. **p < 0.01
KLF9 harbors a complementary miR-4428 target site (Fig. 5H). To assess whether KLF9 is a direct target of miR-4428, recombinant plasmids containing the complementary miR-4428 target site in the KLF9-3’UTR (pGL3-KLF9-3’UTR-wt and its mutant form pGL3-KLF9-3’UTR-mut) were then constructed. Each plasmid was separately co-transfected with miR-4428 into TPC1 cells and then the effect on luciferase activity was determined. As shown in Fig. 5I, the luciferase activity was greatly suppressed when miR-4428 was co-transfected with pGL3-KLF9-3’UTR-wt, whereas the opposite of luciferase activity was observed when miR-4428 was co-transfected with pGL3-KLF9-3’UTR-mut, which contains four mutated nucleotides in the complementary miR-4428 target site. Moreover, the mutation of four nucleotides in miR-4428 seed region also completely abrogated its suppressive effect (Fig. 5J). Importantly, miR-4428 overexpression markedly inhibited KLF9 protein expression in BCPAP cells (Fig. 5K).
Role of ACTA2-AS1 in KLF9 overexpression and suppression of the invasive ability of PTC cells in a miR-4428-dependent manner
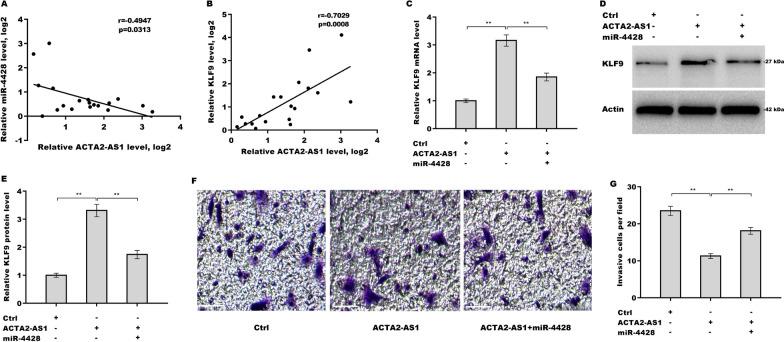
Finally, we explored whether ACTA2-AS1 regulated KLF9 expression, thereby influencing the invasive capacity of PTCs, by sponging miR-4428. We found that ACTA2-AS1 overexpression increased KLF9 mRNA level, on which an effect was reversed by miR-4428 application (Fig. 6A). MiR-4428 also inhibited promotive effect of ACTA2-AS1 on KLF9 protein expression (Fig. 6B, C). Functionally, we found that ACTA2-AS1 overexpression reduced invasive ability of TPC1 cells, whereas miR-4428 significantly reversed this effect (Fig. 6D, E, F, G). Taken together, these results showed that ACTA2-AS1 inhibits PTC metastasis by regulating the miR-4428/KLF9 axis.
Fig. 6.
ACTA2-AS1 increased KLF9 expression and inhibited the invasive ability of PTC cells in a miR-4428-dependent manner. A qRT-PCR was employed to determine the KLF9 mRNA level in TPC1 cells overexpressing ACTA2-AS1 and miR-4428. B, C, D, E Western blot and quantitative analysis, respectively, of the KLF9 protein level in TPC1 cells overexpressing ACTA2-AS1 and miR-4428. F, G Transwell invasion assay and quantitative analysis, respectively, for the invasive ability of TPC1 cells overexpressing ACTA2-AS1 and miR-4428. Scale bar, 50 µm and magnification, 200× . **p < 0.01
Methylation-expression correlation
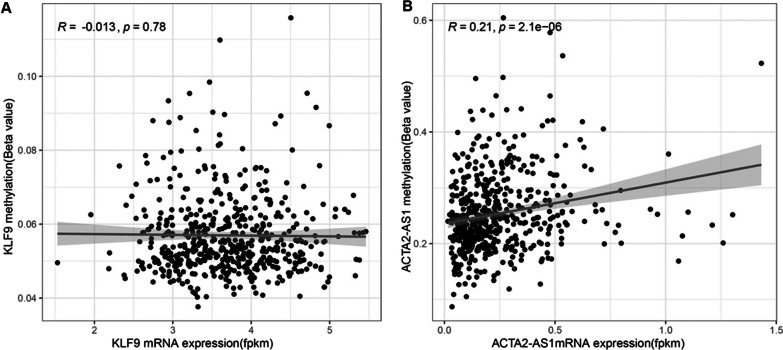
In the current study, we also further investigated the methylation data and mRNA expression data of 570 patients with PTC from the TCGA dataset. Our results indicated that no significant correlation between promoter methylation and mRNA expression of KLF9 gene was observed (r = -0.013, p = 0.78) (Fig. 7A), while the methylation level of ACTA2-AS1 was significantly correlated with its mRNA expression (r = 0.21, p = 2.1˟e−6) (Fig. 7B). Unfortunately, we could not show the similar correlation results for miR-4428 as the methylation data on this gene are not available in the TCGA dataset.
Fig. 7.
A Correlation between KLF9 expression and methylation in the TCGA dataset. B Correlation between ACTA2-AS1 Expression and methylation in the TCGA dataset
Discussion
Increasing evidence has indicated that lncRNAs are frequently dysregulated in most types of cancers and play important roles in tumor progression [30]. Bian et al. demonstrated that 496 lncRNAs were differentially expressed between colorectal cancer tissues and normal tissues. They further reported that the elevated lncRNA-FEZF1-AS1 expression accelerated colorectal cancer growth and metastasis through overexpression of pyruvate kinase 2 [31]. Similarly, Feng et al. found that 568 lncRNAs were aberrantly expressed in PTC tissues and that the increased levels of lncRNA-n384546 facilitated PTC growth and metastasis via regulation of the miR-145/AKT3 axis [32]. Recent studies have shown that ACTA2-AS1 exerts a tumor suppressive effect in a variety of cancers [16–19]. However, whether ACTA2-AS1 plays a role in PTC metastasis remains unknown.
In the current study, we demonstrated that ACTA2-AS1 expression is decreased in PTC and that ACTA2-AS1 inhibits proliferative and invasive abilities of PTC cells. We further demonstrated that ACTA2-AS1 acts as a ceRNA by sponging miR-4428. Meanwhile, ACTA2-AS1 expression was found to increase KLF9 expression and inhibit the invasive ability of PTC cells in a miR-4428-dependent manner. These results reveal the role of the ACTA2-AS1/miR-4428/KLF9 axis in PTC metastasis and represent a promising opportunity for the development of PTC-targeting therapy.
CeRNAs comprise a class of cytoplasmic decoys that compete with a common pool of miRNAs. Through MREs, ceRNAs can regulate the expression of genes via a complex network that includes non-coding RNAs (lncRNAs and miRNAs) and mRNAs [23]. It was thought that all MRE-containing lncRNAs can sequester miRNAs and seclude them from mRNAs containing the same MREs, thereby increasing mRNA transcript levels [23, 33]. Studies have revealed that lncRNAs exert their tumorigenic effects on human tumors by acting as ceRNAs. For instance, LINC01133 inhibits epithelial–mesenchymal transition in gastric cancer cells and cancer metastasis via functioning as a sponge of miR-106a, thereby increasing the levels of adenomatous polyposis coli (APC) [34]. Similarly, ACTA2-AS1 can inhibit the growth of colon cancer cells via sponging miR-4428 and thus promote BIM expression [16]. Besides miR-4428, ACTA2-AS1 can also function as a sponge of other miRNAs, such as miR-532 and miR-143 [35, 36]. Additionally, ACTA2-AS1 can regulate gene expression through other epigenetic mechanisms. Navarro-Corcuera et al. demonstrated that ACTA2-AS1 can increase platelet-derived growth factor B (PDGFB) expression by recruiting p300/ELK1 to the PDGFB promoter, thereby triggering the acetylation of lysine 27 on histone H3 (H3K27ac) [37].
In this study, we investigated the roles of ACTA2-AS1 in PTC metastasis and sought to identify the underlying mechanisms. We found that ACTA2-AS1 expression was continuously downregulated in normal tissues, PTC tissues without metastasis, and PTC tissues with lymph node metastasis, respectively. Functionally, we found that overexpression of ACTA2-AS1 decreased the growth of TPC1 cells and their proliferative as well as invasive capacities. To identify the mechanism by which ACTA2-AS1 inhibits PTC metastasis, we further assessed subcellular localization of ACTA2-AS1 in PTC cells, showing that ACTA2-AS1 majorly localized in the cytoplasm. We further found that ACTA2-AS1 was highly enriched in AGO2-immunoprecipitated complexes, indicating that ACTA2-AS1 might function as a ceRNA. The bioinformatic analysis and functional experiments demonstrated that ACTA2-AS1 suppressed PTC metastasis by sponging miR-4428, consequently, increasing KLF9 expression. Finally, Although BCPAP is derived from poorly differentiated thyroid carcinoma, many studies have used this cell line to investigate the migration and invasion of thyroid carcinoma in vitro [38–41]. For example, Cazarin, et al. showed that 5'-AMP-activated protein kinase regulates TPC-1 and BCPAP cell survival, migration, invasion, and epithelial-to-mesenchymal transition [38]. Awwad, et al. demonstrated that the AMPK-activator (AICAR) reduced the basal migration of TPC-1 and BCPAP but the similar finding did not observed in the normal human thyroid cell line (Nthy-ori 3–1) [39]. Chong et al. showed that knockdown of IL13RA2 in BCPAP cells significantly reduced cell viability, cell migration, and epithelial-to-mesenchymal transition [40]. Furthermore, Xu, et al. demonstrated that the activation of TRPV1 by capsaicin significantly suppressed the migration and invasion of BCPAP cells as well as their adhesion [41]. Taken together, such evidence may demonstrate that BCPAP cells could be used as a cell model in thyroid carcinoma metastasis.
Previous studies have suggested that epigenetic modification (e.g., DNA methylation) of activating proto-oncogenes and inhibiting tumor suppressor genes is one of the most important events in malignancies, including PTC [42, 43]. Abnormal DNA methylation and expression levels of ACTA2-AS1 were demonstrated in several tumors [44]. Using the TCGA dataset, we observed that the ACTA2-AS1 promoter methylation level was positively correlated with its mRNA expression. Thus, this finding suggests that DNA methylation of ACTA2-AS1 could be one of mechanisms in the regulation of ACTA2-AS1 expression in PTC.
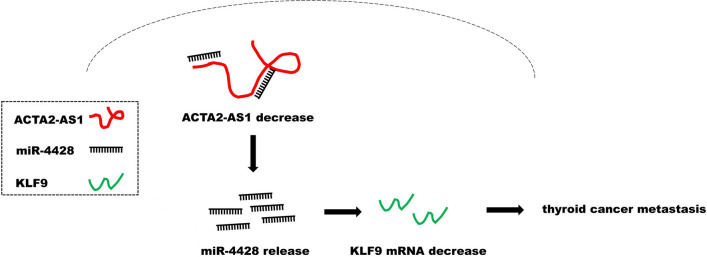
In conclusion, our findings indicate that ACTA2-AS1 may function as a tumor suppressor in PTC, at least partly by regulating miR-4428-dependent KLF9 expression as demonstrated in the graphical abstract (Fig. 8).
Fig. 8.
Graphical abstract
Materials and methods
Clinical specimens
Nineteen fresh PTC specimens without metastasis and matched normal thyroid tissues, as well as 11 PTC specimens with lymph node metastasis, were collected with the approval of the Shanghai Baoshan Hospital of Integrated Traditional Chinese and Western Medicine Ethics Committee (No. 201917). The written informed consent was obtained from all the donors. The clinical characteristics of the patients are shown in Table 1. None of the donors had received therapy before surgery.
Table 1.
Correlation of ACTA2-AS1 level with clinicopathologic features in PTC
| Variable (n = 30) | ACTA2-AS1 level | p value | ||
|---|---|---|---|---|
| High | Low | |||
| Age (years) | ≤ 55 | 8 | 10 | 0.765 |
| > 55 | 6 | 6 | ||
| Gender | Female | 8 | 9 | 0.961 |
| Male | 6 | 7 | ||
| Tumor size (cm) | ≤ 2 | 7 | 7 | 0.732 |
| > 2 | 7 | 9 | ||
| PTC subtype | Classic | 9 | 9 | 0.654 |
| Encapsulated classic | 5 | 7 | ||
| TNM stage | I + II | 12 | 6 | 0.007* |
| III + IV | 2 | 10 | ||
| LN metastasis | No | 12 | 7 | 0.017* |
| Yes | 2 | 9 | ||
PTC papillary thyroid carcinoma; LN, lymph node
*Statistically significant (χ2 test)
Cell culture
The human PTC cell lines BCPAP and TPC1 and the normal human thyroid cell line Nthy-ori 3–1 (hereafter abbreviated as Nthy) (Procell Life Science & Technology Co, Ltd, Wuhan, China) were maintained in RPMI 1640 medium (Solarbio, Beijing, China) supplemented with 10% fetal bovine serum (Cellmax, Beijing, China), 100 U/mL penicillin, and 0.1 mg/mL streptomycin (Solarbio) at 37 °C with 5% CO2.
Cell transfection
Recombinant constructs containing ACTA2-AS1 cDNA (pcDNA-ACTA2-AS1) were established by cloning the ACTA2-AS1 gene into the pcDNA3.1 vector. Small interfering RNAs (siRNAs) targeting ACTA2-AS1 (si-ACTA2-AS1s, a mixture of three siRNAs) and the negative control were designed and synthesized by Biosynthech (Jiangsu, China). MiR-4428 mimics and control miRNA (miR-Ctrl) mimics were purchased from Sangon (Shanghai, China). TPC1 and BCPAP cells in the logarithmic growth phase were grown in a culture dish until 60–80% confluency, following which the indicated plasmids, siRNAs, and miRNA mimics were transfected into the cells using Lipofectamine 3000 (Invitrogen, CA, USA) according to the manufacturer's instructions. The sequences of the miRNAs and siRNAs used in this study are shown in Additional file 1: Table S1.
qRT-PCR
Total RNA was extracted from PTC cells or fresh PTC tissues with TRIzol reagent (Sigma-Aldrich, MO, USA) and quantified in a Varioskan LUX microplate reader (Thermo Fisher Scientific, MA, USA). Cytoplasmic and nuclear RNA was extracted from thyroid carcinoma cells using the Cytoplasmic & Nuclear RNA Purification Kit from AmyJet Scientific (Wuhan, China). Reverse transcription was performed using the TIANScript II RT Kit (Tiangen, Beijing, China) at 42 °C. The qPCR was performed using StarLighter SYBR Green qPCR Mix (Qihengxing, Beijing, China) in the QuantStudio 5 Food Safety Real-Time PCR System (Thermo Fisher Scientific). The thermocycling conditions were set at 95 °C for 5 min followed by 37 cycles of 95 °C for 20 s and 58.5 °C for 20 s. The sequences of all the primers (Genewiz, Jiangsu, China) used in this study are shown in Additional file 1: Table S1. The relative levels of ACTA2-AS1 were calculated using β-actin as the internal reference gene. The U6 served as the internal reference gene for the determination of miRNA levels.
Colony formation assay
After treatment with the indicated reagents, a total of 400 cells were seeded into six-well plates. After 14 days, the colonies were rinsed with PBS, fixed in 4% paraformaldehyde (PFA), and stained with 0.1% crystal violet for 18 min. Colonies > 50 μm in diameter were counted using ImageJ (NIH, ND, USA).
Cell proliferation assay
A cell counting Kit-8 (CCK-8) assay was applied to assess the proliferative potential of cells after ACTA2-AS1 overexpression or knockdown. Approximately 5,000 TPC1 or BCPAP cells were seeded in 96-well plates and allowed to attach at 37 °C overnight. The cells were then transfected with the indicated plasmids or siRNAs and cultured for the indicated times, after which CCK-8 reagent (10 µL) was applied to the cells for 60 min. Finally, the optical density (OD) was measured at a wavelength of 450 nm using a microplate reader.
Transwell invasion assay
BCPAP and TPC1 cells were treated with pcDNA-ACTA2-AS1, si-ACTA2-AS1s, or miR-4428 mimics and the invasive potential of the cells was assessed using 8-μm-pore Transwell inserts (X-bio Technology, Nanjing, China). The upper chambers of the inserts were coated with Matrigel (Corning, NY, USA) for 12 h at 37 °C. Cells were placed in the upper chamber in serum-free medium while RPMI 1640 medium containing 10% FBS was added to the lower chamber. After 24 h of incubation, the cells on upper surface of the membrane (unmigrated cells) were wiped off, and the upper chamber was washed twice with PBS. The cells that crossed the membrane (migrated cells) were fixed in 4% PFA, stained with 0.1% crystal violet, and counted under a microscope.
Fluorescence in situ hybridization (FISH)
The subcellular localization of ACTA2-AS1 in TPC1 cells was assessed using the FISH Tag RNA Multicolor Kit (Thermo Fisher Scientific). TPC1 cells were plated onto 14-mm-diameter glass coverslips, washed with PBS, fixed in 4% PFA, and incubated with proteinase K (2 μg/mL), glycine, and acetic anhydride at 37 °C. After pre-hybridization for 60 min, the cells were hybridized with probe targeting ACTA2-AS1 at 37 °C, counterstained with DAPI for 5 min, and finally imaged with a XSP-63B fluorescence microscope (Shanghai Optical Factory No. 1, Shanghai, China).
In vivo metastasis assay
All the procedures with animals were performed with the approval of the Experimental Animal Committee of Shanghai University of Traditional Chinese Medicine (PZSHUTCM210820017). Male athymic Balb/c mice (6–8 weeks old) were obtained from Cyagen Biosciences (Jiangsu, China) and housed in a specific pathogen free room (12-h-light/12-h-dark cycle, 22 ± 2 °C) with ad libitum access to standard chow. To establish the metastasis model, TPC1 cells stably expressing ACTA2-AS1 (3 × 10⁶/200 μL PBS) were injected into the mice via the tail vein. Mice showing signs of unbearable pain or disease were euthanatized before the end of the experiment. In vivo bioluminescent imaging of lung metastasis was performed at the 9th week after injection. All the mice were subsequently euthanized via inhalation anesthesia (2% isoflurane) followed by cervical dislocation. Lung tissues were dissected, fixed in 4% PFA, and stained with hematoxylin and eosin (H&E). Finally, the numbers of metastatic nodules were counted.
RNA immunoprecipitation (RIP) assay
The RIP assay was carried out using a commercial RIP kit (BersinBio, Guangzhou, China) and antibodies against IgG (SPA201; Solarbio) and AGO2 (FNab10000; FineTest, Hubei, China). TPC1 cells were lysed with NP-40 Lysis Buffer (Solarbio) and centrifuged at 13,000 × g for 5 min. The collected supernatant was incubated with 300 μL of RIP buffer containing beads coated with the indicated antibodies for 12 h at 4 °C. After centrifugation at 3,000 × g for 60 s, the supernatant was discarded and the beads were washed five times with PBS, followed by digestion with proteinase K. RNA was extracted using TRIzol reagent and subjected to qRT-PCR.
RNA pull-down
Biotin-labeled miR-4428 (GenePharma, Shanghai, China) was incubated with streptavidin agarose beads at room temperature (RT) for 60 min. A TPC1 cell lysate was mixed with probe-coated beads at 4 °C for 12 h. RNA that was bound by miR-4428 was purified using TRIzol and quantified via qRT-PCR.
Dual-luciferase reporter assay
The pGL3-ACTA2-AS1-wt and pGL3-KLF9-3’-UTR-wt recombinant plasmids or their mutant forms (pGL3-ACTA2-AS1-mut and pGL3-KLF9-3’-UTR-mut, respectively) were generated by inserting predicted or mutated binding sites of KLF9-3’UTR or ACTA2-AS1 into the pGL3 vector (VectorBuilder, Guangzhou, China). A total of 1 × 10⁵ TPC1 cells were seeded into a 24-well plate and co-transfected with 50 nM of miR-4428 or miR-Ctrl; 20 ng of pGL3-ACTA2-AS1-wt, pGL3-KLF9-3’-UTR-wt, or either of their mutant forms; and 2 ng of pRL-TK (VectorBuilder) using Hieff Trans Liposomal Transfection Reagent (Yeasen, Shanghai, China). For two days after transfection, the cells were lysed and monitored for luciferase activity using the Dual-Luciferase Reporter Gene Assay Kit (Yeasen).
Western blot
The cells were homogenized in NP-40 Lysis Buffer (Solarbio) containing a protease inhibitor cocktail. After determination of the protein concentration using a BCA protein assay kit (Thermo Fisher Scientific), approximately 30 μg of protein from each sample was separated on a Future PAGE 10% gel (ACE Biotechnology, Jiangsu, China) and transferred onto PVDF membranes. The membranes were then blocked with 2% BSA and incubated with anti-KLF9 antibody (1:1,000; ab227920; Abcam, CA, USA) and anti-β-actin antibody (1:3,000; SAB5600204; Sigma-Aldrich) at 4 °C for 18 h. After rinsing three times with TBST, the membranes were incubated with horseradish peroxidase (HRP)-conjugated anti-rabbit IgG antibody (1:5,000; #7074S; Cell Signaling, MA, USA) at RT for 90 min. The immunoblots were visualized using Super ECL Detection Reagent (Yeasen).
Data validation using the TCGA dataset
We analyzed DNA methylation and mRNA expression in the Cancer Genome Atlas (TCGA) database by the R version 4.21 software [Package: ggplot2]. The obtained data were retrieved and analyzed in UCSC Xena Functional Genomics Explorer (https://xenabrowser.net/).
Statistical analysis
All data were obtained in experiments revealed from > 3 individual repeats and are presented as means ± standard error of mean (SEM). We quantified and classified the ACTA2-AS1 into low or high expression using a 50% cut-off level. Paired Student’s t-tests and ANOVA were used for statistical analysis. The Pearson correlation was used to explore the correlation between DNA methylation and mRNA expressions of these genes. The p value < 0.05 was considered to be significant.
Supplementary Information
Additional file 1: Table S1. Primer, siRNA, and miRNA sequence used in the study.
Additional file 2: Table S2. Targeted miRNAs of ACTA2-AS1 predicted by the Starbase platform.
Additional file 3: Table S3. Target genes of miR-428 predicted by GSE165724, microT, miRmap, and Targetscan tool, respectively.
Acknowledgements
The authors acknowledge the financial support from the Shanghai Municipal Health Commission and the Shanghai Baoshan Science and Technology Commission.
Abbreviations
- TC
Thyroid carcinoma
- lncRNAs
Long non-coding RNAs
- PTC
Papillary thyroid cancer
- miRNAs
MicroRNAs
- ceRNAs
Competing endogenous RNAs
- siRNAs
Small interfering RNAs
- miR-Ctrl
Control miRNA
- CCK-8
Cell Counting Kit-8
- OD
Optical density
- PFA
Paraformaldehyde
- H&E
Hematoxylin and eosin
- RIP
RNA immunoprecipitation
- SEM
Standard error of mean
- TCGA
The Cancer Genome Atlas
- GTEx
Genotype-Tissue Expression
- MREs
MiRNA response elements
- FISH
Fluorescence in situ hybridization
- APC
Adenomatous polyposis coli
Author contributions
TC and QZ were involved in the conceptualization; XC contributed to writing, original draft preparation; SHW, JJZ, JYZ, and XC acquired the data; SHW, JJZ, JYZ, TC, QZ, TTJ, GBZ, GL, and XC analyzed and interpreted the data. All authors read and agreed to the final version of the manuscript.
Funding
This study was supported by the Shanghai Municipal Health Commission Clinical Application Project of the Health Industry (NO.201940363) and the Shanghai Baoshan Science and Technology Commission (NO.21-E-53).
Availability of data and materials
The datasets and materials used and/or analyzed during the current study are available from the corresponding author on reasonable request.
Declarations
Ethics approval and consent to participate
The study of patients was approved by the Ethics Committee of the Shanghai Baoshan Hospital of Integrated Traditional Chinese and Western Medicine (No. 201917). Animal experiments were reviewed and approved by the Experimental Animal Committee of Shanghai University of Traditional Chinese Medicine (PZSHUTCM210820017).
Consent for publication
Not applicable.
Competing interests
On behalf of all authors, the corresponding author states that there is no conflict of interest.
Footnotes
Publisher's Note
Springer Nature remains neutral with regard to jurisdictional claims in published maps and institutional affiliations.
Shuhui Wu, Jingjing Zhu and Tingting Jiang contributed equally to this work.
Contributor Information
Jieyu Zhou, Email: entzhoujieyu@126.com.
Xiang Chen, Email: chenxiang0128212@163.com.
References
- 1.Sung H, Ferlay J, Siegel RL, Laversanne M, Soerjomataram I, Jemal A, Bray F. Global cancer statistics 2020: GLOBOCAN estimates of incidence and mortality worldwide for 36 cancers in 185 countries. CA Cancer J Clin. 2021;71:209–249. doi: 10.3322/caac.21660. [DOI] [PubMed] [Google Scholar]
- 2.Zaballos MA, Santisteban P. Key signaling pathways in thyroid cancer. J Endocrinol. 2017;235:R43–R61. doi: 10.1530/JOE-17-0266. [DOI] [PubMed] [Google Scholar]
- 3.Liu H, Deng H, Zhao Y, Li C, Liang Y. LncRNA XIST/miR-34a axis modulates the cell proliferation and tumor growth of thyroid cancer through MET-PI3K-AKT signaling. J Exp Clin Cancer Res. 2018;37:279. doi: 10.1186/s13046-018-0950-9. [DOI] [PMC free article] [PubMed] [Google Scholar]
- 4.Gou Q, Gao L, Nie X, Pu W, Zhu J, Wang Y, Liu X, Tan S, Zhou JK, Gong Y, et al. Long noncoding RNA AB074169 inhibits cell proliferation via modulation of KHSRP-Mediated CDKN1a expression in papillary thyroid carcinoma. Cancer Res. 2018;78:4163–4174. doi: 10.1158/0008-5472.CAN-17-3766. [DOI] [PubMed] [Google Scholar]
- 5.Pellegriti G, Frasca F, Regalbuto C, Squatrito S, Vigneri R. Worldwide increasing incidence of thyroid cancer: update on epidemiology and risk factors. J Cancer Epidemiol. 2013;2013:965212. doi: 10.1155/2013/965212. [DOI] [PMC free article] [PubMed] [Google Scholar]
- 6.Barrea L, Gallo M, Ruggeri RM, Giacinto PD, Sesti F, Prinzi N, Adinolfi V, Barucca V, Renzelli V, Muscogiuri G, et al. An update. Crit Rev Food Sci Nutr. 2021;61:25–59. doi: 10.1080/10408398.2020.1714542. [DOI] [PubMed] [Google Scholar]
- 7.Uchida S, Dimmeler S. Long noncoding RNAs in cardiovascular diseases. Circ Res. 2015;116:737–750. doi: 10.1161/CIRCRESAHA.116.302521. [DOI] [PubMed] [Google Scholar]
- 8.Ning S, Zhang J, Wang P, Zhi H, Wang J, Liu Y, Gao Y, Guo M, Yue M, Wang L, et al. Lnc2Cancer: a manually curated database of experimentally supported lncRNAs associated with various human cancers. Nucl Acids Res. 2016;44(D1):D980–985. doi: 10.1093/nar/gkv1094. [DOI] [PMC free article] [PubMed] [Google Scholar]
- 9.Bhan A, Soleimani M, Mandal SS. Long noncoding RNA and cancer: a new paradigm. Cancer Res. 2017;77:3965–3981. doi: 10.1158/0008-5472.CAN-16-2634. [DOI] [PMC free article] [PubMed] [Google Scholar]
- 10.Isin M, Dalay N. LncRNAs and neoplasia. Clin Chim Acta. 2015;444:280–288. doi: 10.1016/j.cca.2015.02.046. [DOI] [PubMed] [Google Scholar]
- 11.Peng WX, Koirala P, Mo YY. LncRNA-mediated regulation of cell signaling in cancer. Oncogene. 2017;36:5661–5667. doi: 10.1038/onc.2017.184. [DOI] [PMC free article] [PubMed] [Google Scholar]
- 12.Di W, Li Q, Shen W, Guo H, Zhao S. The long non-coding RNA HOTAIR promotes thyroid cancer cell growth, invasion and migration through the miR-1-CCND2 axis. Am J Cancer Res. 2017;7:1298–1309. [PMC free article] [PubMed] [Google Scholar]
- 13.Liu X, Liu G, Lu Y, Shi Y. Long non-coding RNA HOTAIR promotes cell viability, migration and invasion in thyroid cancer cells by sponging miR-17-5p. Neoplasma. 2020;67:229–237. doi: 10.4149/neo_2019_190310N208. [DOI] [PubMed] [Google Scholar]
- 14.Liang WQ. Zeng, Chen CF, Sun SM, Lu XF, Peng CY, Lin HY: Long noncoding RNA H19 is a critical oncogenic driver and contributes to epithelial-mesenchymal transition in papillary thyroid carcinoma. Cancer Manag Res. 2019;11:2059–2072. doi: 10.2147/CMAR.S195906. [DOI] [PMC free article] [PubMed] [Google Scholar]
- 15.Liu L, Yang J, Zhu X, Li D, Lv Z, Zhang X. Long noncoding RNA H19 competitively binds miR-17-5p to regulate YES1 expression in thyroid cancer. FEBS J. 2016;283:2326–2339. doi: 10.1111/febs.13741. [DOI] [PubMed] [Google Scholar]
- 16.Pan Q, Huang Y, Wang Y, Li D, Lei C. LncRNA ACTA2-AS1 suppress colon adenocarcinoma progression by sponging miR-4428 upregulation BCL2L11. Cancer Cell Int. 2021;21:203. doi: 10.1186/s12935-021-01769-3. [DOI] [PMC free article] [PubMed] [Google Scholar]
- 17.Ying K, Wang L, Long G, Lian C, Chen Z, Lin W. ACTA2-AS1 suppresses lung adenocarcinoma progression via sequestering miR-378a-3p and miR-4428 to elevate SOX7 expression. Cell Biol Int. 2020;44:2438–2449. doi: 10.1002/cbin.11451. [DOI] [PubMed] [Google Scholar]
- 18.Liu X, Zhang X, Du S. Long non-coding RNA ACTA2-AS1 inhibits the cisplatin resistance of non-small cell lung cancer cells through inhibiting autophagy by suppressing TSC2. Cell Cycle. 2022;21:368–378. doi: 10.1080/15384101.2021.2020433. [DOI] [PMC free article] [PubMed] [Google Scholar]
- 19.Zhou RJ, Lv HZ. Knockdown of ACTA2AS1 promotes liver cancer cell proliferation, migration and invasion. Mol Med Rep. 2019;19(3):2263–2270. doi: 10.3892/mmr.2019.9856. [DOI] [PubMed] [Google Scholar]
- 20.Lee YS, Dutta A. MicroRNAs in cancer. Annu Rev Pathol. 2009;4:199–227. doi: 10.1146/annurev.pathol.4.110807.092222. [DOI] [PMC free article] [PubMed] [Google Scholar]
- 21.Shen C, Wang B, Zhang K, Wang C, Wang J, An Z, Shu L. RGMB-AS1/miR-4428/PBX1 axis drives the progression of cervical cancer. Transl Cancer Res. 2020;9:3180–3190. doi: 10.21037/tcr.2020.04.19. [DOI] [PMC free article] [PubMed] [Google Scholar]
- 22.Yang R, Xu J, Hua X, Tian Z, Xie Q, Li J, Jiang G, Cohen M, Sun H, Huang C. Overexpressed miR-200a promotes bladder cancer invasion through direct regulating Dicer/miR-16/JNK2/MMP-2 axis. Oncogene. 2020;39:1983–1996. doi: 10.1038/s41388-019-1120-z. [DOI] [PMC free article] [PubMed] [Google Scholar]
- 23.Karreth FA, Pandolfi PP. ceRNA cross-talk in cancer: when ce-bling rivalries go awry. Cancer Discov. 2013;3:1113–1121. doi: 10.1158/2159-8290.CD-13-0202. [DOI] [PMC free article] [PubMed] [Google Scholar]
- 24.Thomson DW, Dinger ME. Endogenous microRNA sponges: evidence and controversy. Nat Rev Genet. 2016;17:272–283. doi: 10.1038/nrg.2016.20. [DOI] [PubMed] [Google Scholar]
- 25.Ou R, Lv M, Liu X, Lv J, Zhao J, Zhao Y, Li X, Li W, Zhao L, Li J, et al. HPV16 E6 oncoprotein-induced upregulation of lncRNA GABPB1-AS1 facilitates cervical cancer progression by regulating miR-519e-5p/Notch2 axis. FASEB J. 2020;34:13211–13223. doi: 10.1096/fj.202000762R. [DOI] [PubMed] [Google Scholar]
- 26.He H, Liyanarachchi S, Li W, Comiskey DF, Jr, Yan P, Bundschuh R, Turkoglu AM, Brock P, Ringel MD, de la Chapelle A. Transcriptome analysis discloses dysregulated genes in normal appearing tumor-adjacent thyroid tissues from patients with papillary thyroid carcinoma. Sci Rep. 2021;11:14126. doi: 10.1038/s41598-021-93526-9. [DOI] [PMC free article] [PubMed] [Google Scholar]
- 27.Bagheri-Yarmand R, Sinha KM, Li L, Lu Y, Cote GJ, Sherman SI, Gagel RF. Combinations of tyrosine kinase inhibitor and ERAD inhibitor promote oxidative stress-induced apoptosis through ATF4 and KLF9 in medullary thyroid cancer. Mol Cancer Res. 2019;17:751–760. doi: 10.1158/1541-7786.MCR-18-0354. [DOI] [PMC free article] [PubMed] [Google Scholar]
- 28.Li Y, Sun Q, Jiang M, Li S, Zhang J, Xu Z, Guo D, Gu T, Wang B, Xiao L, et al. KLF9 suppresses gastric cancer cell invasion and metastasis through transcriptional inhibition of MMP28. FASEB J. 2019;33:7915–7928. doi: 10.1096/fj.201802531R. [DOI] [PubMed] [Google Scholar]
- 29.Bai X, Jiang X, Liu Y, Wang Y, Song G, Qiu H, Zhang Q. Kruppel-like factor 9 upregulates E-cadherin transcription and represses breast cancer invasion and metastasis. Am J Cancer Res. 2021;11:3660–3673. [PMC free article] [PubMed] [Google Scholar]
- 30.Evans JR, Feng FY, Chinnaiyan AM. The bright side of dark matter: lncRNAs in cancer. J Clin Invest. 2016;126:2775–2782. doi: 10.1172/JCI84421. [DOI] [PMC free article] [PubMed] [Google Scholar]
- 31.Bian Z, Zhang J, Li M, Feng Y, Wang X, Yao S, Jin G, Du J, Han W, Yin Y, et al. LncRNA-FEZF1-AS1 promotes tumor proliferation and metastasis in colorectal cancer by regulating PKM2 signaling. Clin Cancer Res. 2018;24:4808–4819. doi: 10.1158/1078-0432.CCR-17-2967. [DOI] [PubMed] [Google Scholar]
- 32.Feng J, Zhou Q, Yi H, Ma S, Li D, Xu Y, Wang J, Yin S. A novel lncRNA n384546 promotes thyroid papillary cancer progression and metastasis by acting as a competing endogenous RNA of miR-145-5p to regulate AKT3. Cell Death Dis. 2019;10:433. doi: 10.1038/s41419-019-1637-7. [DOI] [PMC free article] [PubMed] [Google Scholar]
- 33.Guo H, Ingolia NT, Weissman JS, Bartel DP. Mammalian microRNAs predominantly act to decrease target mRNA levels. Nature. 2010;466:835–840. doi: 10.1038/nature09267. [DOI] [PMC free article] [PubMed] [Google Scholar]
- 34.Yang XZ, Cheng TT, He QJ, Lei ZY, Chi J, Tang Z, Liao QX, Zhang H, Zeng LS, Cui SZ. LINC01133 as ceRNA inhibits gastric cancer progression by sponging miR-106a-3p to regulate APC expression and the Wnt/beta-catenin pathway. Mol Cancer. 2018;17:126. doi: 10.1186/s12943-018-0874-1. [DOI] [PMC free article] [PubMed] [Google Scholar]
- 35.Li Y, Yang Z, Chen J. Mechanism underlying the regulation of lncRNA ACTA2-AS1 on CXCL2 by absorbing miRNA-532-5p as ceRNA in the development of ovarian cancer. Int J Clin Exp Pathol. 2021;14:596–607. [PMC free article] [PubMed] [Google Scholar]
- 36.Luo L, Wang M, Li X, Luo C, Tan S, Yin S, Liu L, Zhu X. A novel mechanism by which ACTA2-AS1 promotes cervical cancer progression: acting as a ceRNA of miR-143-3p to regulate SMAD3 expression. Cancer Cell Int. 2020;20:372. doi: 10.1186/s12935-020-01471-w. [DOI] [PMC free article] [PubMed] [Google Scholar]
- 37.Navarro-Corcuera A, Sehrawat TS, Jalan-Sakrikar N, Gibbons HR, Pirius NE, Khanal S, Hamdan FH, Aseem SO, Cao S, Banales JM, et al. Long non-coding RNA ACTA2-AS1 promotes ductular reaction by interacting with the p300/ELK1 complex. J Hepatol. 2022;76:921–933. doi: 10.1016/j.jhep.2021.12.014. [DOI] [PMC free article] [PubMed] [Google Scholar]
- 38.Cazarin JM, Coelho RG, Hecht F, Andrade BM, Carvalho DP. 5'- AMP-activated protein kinase regulates papillary (TPC-1 and BCPAP) thyroid cancer cell survival, migration, invasion, and epithelial-to-mesenchymal transition. Thyroid. 2016;26:933–942. doi: 10.1089/thy.2015.0440. [DOI] [PubMed] [Google Scholar]
- 39.Awwad O, Coperchini F, Pignatti P, Denegri M, Massara S, Croce L, Di Buduo CA, Abbonante V, Balduini A, Chiovato L, Rotondi M. The AMPK-activator AICAR in thyroid cancer: effects on CXCL8 secretion and on CXCL8-induced neoplastic cell migration. J Endocrinol Invest. 2018;41:1275–1282. doi: 10.1007/s40618-018-0862-8. [DOI] [PubMed] [Google Scholar]
- 40.Chong ST, Tan KM, Kok CYL, Guan SP, Lai SH, Lim C, Hu J, Sturgis C, Eng C, Lam PYP, Ngeow J. IL13RA2 is differentially regulated in papillary thyroid carcinoma vs follicular thyroid carcinoma. J Clin Endocrinol Metab. 2019;104:5573–5584. doi: 10.1210/jc.2019-00040. [DOI] [PubMed] [Google Scholar]
- 41.Xu S, Zhang L, Cheng X, Yu H, Bao J, Lu R. Capsaicin inhibits the metastasis of human papillary thyroid carcinoma BCPAP cells through the modulation of the TRPV1 channel. Food Funct. 2018;9:344–354. doi: 10.1039/C7FO01295K. [DOI] [PubMed] [Google Scholar]
- 42.Khatami F, Larijani B, Heshmat R, Nasiri S, Saffar H, Shafiee G, Mossafa A, Tavangar SM. Promoter methylation of four tumor suppressor genes in human papillary thyroid carcinoma. Iran J Pathol. 2019;14:290–298. doi: 10.30699/IJP.2019.94401.1922. [DOI] [PMC free article] [PubMed] [Google Scholar]
- 43.Cavalli G, Heard E. Advances in epigenetics link genetics to the environment and disease. Nature. 2019;571:489–499. doi: 10.1038/s41586-019-1411-0. [DOI] [PubMed] [Google Scholar]
- 44.Zhao N, Guo M, Zhang C, Wang C, Wang K. Pan-cancer methylated dysregulation of long non-coding RNAs reveals epigenetic biomarkers. Front Cell Dev Biol. 2022;10:882698. doi: 10.3389/fcell.2022.882698. [DOI] [PMC free article] [PubMed] [Google Scholar]
Associated Data
This section collects any data citations, data availability statements, or supplementary materials included in this article.
Supplementary Materials
Additional file 1: Table S1. Primer, siRNA, and miRNA sequence used in the study.
Additional file 2: Table S2. Targeted miRNAs of ACTA2-AS1 predicted by the Starbase platform.
Additional file 3: Table S3. Target genes of miR-428 predicted by GSE165724, microT, miRmap, and Targetscan tool, respectively.
Data Availability Statement
The datasets and materials used and/or analyzed during the current study are available from the corresponding author on reasonable request.


