

Abstract
Computational fluid dynamics simulations are used to model the velocity field and the transport of a passive scalar within a micro-scale chamber used to measure diffusional transport through various building materials. Comparisons of solutions obtained using a steady, laminar flow assumption with velocity measurements obtained from hot-wire anemometry show that the numerical method generally underpredicts the near surface velocity field. The results improve for higher flow rates and for carpeted test materials, modeled as a porous resistive layer. Calculations involving scalar transport within the upper chamber of the sampling device are performed for different flow rates and Schmidt numbers. The results are used to develop a model for the convective mass transfer coefficient, correlated as a function of the Reynolds and Schmidt numbers as well as the porosity of the carpet. This model is integrated into a steady-state mass transport model for predicting the diffusion of gaseous formaldehyde through various test materials. Predictions of diffusion and partition coefficients for vinyl flooring, gypsum wall board, and carpet are within the ranges of literature data. The results indicate that a perfectly mixed upper part of the sampling device is an adequate assumption.
1. Introduction
Humans are exposed to a variety of chemicals, including volatile and semi-volatile organic compounds (VOCs and SVOCs) through their everyday interactions with various building materials and consumer products [1]. The fate of these agents as they are emitted, transported, and absorbed is a key unknown in the prediction of the effects of exposure to these chemicals. More specifically, critical data gaps include 1) emission rates, 2) sorption rate parameters, 3) mass transfer coefficients, 4) material / air partition coefficients, and 5) material solid-phase diffusion coefficients. These, along with experimental data for agent concentration in well-characterized environments, are necessary to support the development of quantitative structure-activity relationship and mass transfer models that can be used to predict emission and transport of VOCs and SVOCs in indoor environments.
Developing analytical methods to accurately determine emission parameters for chemicals from solid materials such as material/air partition coefficient () and solid-phase diffusion coefficient () has been an active research area for decades. There are several methods in the literature to determine the parameters, including dynamic microbalance method [2,3], dynamic-static chamber methods [4], twin dynamic chamber methods [5,6], dual chamber in series method [7,8], C-history method [9], etc. These methods are mostly for volatile organic compounds that have small and do not impact of convective mass transfer resistance on the coefficients. For semi-volatile organic compounds, measuring their emissions and transport is challenging because of their slow emissions, low concentrations in the air, and strong sorption on the surfaces [10,11, and reference there in]. In addition, some of the methods require two or more parameters to be estimated from a single data set, which mathematically resulted in a large estimation error due to inter-dependency of the parameters in the nonlinear regression analysis process. Our recent research efforts have been focused on developing analytical methods and test protocols for studying the indoor fate and transport mechanisms of VOCs and SVOCs and collecting data on parameters suitable for quantifying their fate and transport including sources, emissions, partitioning between sources and air, source, and interior surface materials. More specifically, methods are being developed for determining key emission-controlling parameters, such as the material / air partition coefficient , material diffusion coefficients (), and convective mass transfer coefficients for organic chemicals present in building and consumer products. [2–12] A current focus is to develop portable, small-scale sampling devices based on a modified Markes Micro-chamber/Thermal Extractor (MCTE250) equipped with a customized permeation (diffusion) accessory (Markes International, Inc., CA, USA). A schematic of the sampling device is shown in Fig. 1. An emission agent (paraformaldehyde in this study) is placed at the lower chamber A. Its vapor reaches a near equilibrium state in Chamber A and migrates through the test material into Chamber B (the upper chamber). A certain amount of the vapor is absorbed into the test material; the remainder diffuses through the test material, is convectively transported within the recirculating flow established in Chamber B, exits the micro-scale chamber, and is sampled. The air velocity near the top surface of the test material is a key parameter in determining the effective when chemical emissions are controlled by external convection. However, due to the small size of the micro-scale chamber and the complicated recirculating flows that are present within it, it is not possible to directly measure the surface flow or to utilize classical boundary-layer theory estimates for. Once has been determined, other emission parameters, such as and , can be calculated based on mass transfer theory using the obtained experimental data, as discussed later.
Fig. 1.

Schematic of micro-scale chamber equipped with a diffusion accessory (CBin is the gas phase concentration in the inlet air, μg/m3; CB and CA are the bulk gas phase concentrations in the upper Chamber B and lower Chamber A respectively, μg/m3; CB0 and CA0 are the gas phase concentrations in Chambers B and A at the material surface μg/m3; VB (1.92e-5 m3) and VA (1.51e-5 m3) are the volumes of Chambers B and A; QB and QA are the air flow rates in Chambers B and A, m3/s; Cm|x=0 is the material phase concentration at the material surface adjacent to Chamber A, μg/m3; Cm|x=L is the material phase concentration at the material surface adjacent to Chamber B, μg/m3; Other parameters, L, A, Dm, De, hmB and hmA are defined in the text.
This article describes computational fluid dynamics (CFD) simulations of the operation of the modified MCTE250 device developed to sample VOCs emitted from indoor substrates, such as vinyl flooring and carpet. Computational analyses related to those described herein have been performed by Schripp et al. [13], and Mao, et al. [14] for a different kind of sampling device but using a very similar flow model and by Foat, et al. [15] within a larger enclosure, again using a similar but turbulent flow model. The purpose of these studies is to predict the time-dependent emission of an agent from a surface, and as such, they solve a transient conservation equation for the agent concentration subject to a steady velocity field. Our primary goal is to utilize the CFD results to develop a model for the convective mass transfer coefficient within the sampling device. This will enable the construction of a standalone mass-transfer model that can predict diffusion rates through substrates of interest. In this paper, the CFD model is described first, followed by a discussion of its validation through comparisons with available experimental data. The development of a model for the convective mass transfer coefficient is then detailed, and the application of this model to predict diffusion coefficients for agent transport through common household materials is presented.
2. Computational model description
Computational fluid dynamics studies were performed using ANSYS Fluent Version 20.1, licensed to North Carolina State University (NCSU). In common with the study of Mao, et al. [14], the SIMPLEC scheme is used for pressure-velocity coupling, and second-order upwind and central schemes are used for the advective and diffusive terms, respectively. The flow within the micro-scale chamber is assumed to be incompressible, perfect-gas air. Isothermal, no-slip boundary conditions were applied at all solid surfaces. The temperature of the micro-scale chamber and its inflow gas were controlled by heating tape. Accordingly, the wall temperature and gas temperature were both set to the measured values. Meshing of the chamber and the inflow / outflow tubes was performed using ANSYS Fluent’s built-in utilities. The unstructured meshes used prismatic layers near the walls and tetrahedra within the interior of the domain. Due to the low flow rates (50–500 mL/min) and small sizes of the micro-scale chambers, the flow was assumed to be laminar, and steady-state solutions were sought. As discussed later, the assumption of steady, laminar flow may not be entirely correct. Calculations were performed on up to 64 cores of NCSU’s high-performance computing cluster. User-defined functions were used to apply near-surface roughness and porous-layer models mimicking the effects of a patterned or rough test material and a carpet test material. Details of these additions are discussed later. Some calculations also involve transport of a passive scalar throughout the micro-scale chamber. In these calculations, a constant unity value of the scalar was imposed on the solid surface corresponding to the test material.
3. Experimental velocity measurements
Experimental velocity field data was collected in a version of the micro-scale chamber without a diffusion accessory to help anchor the CFD results. The conditions for these experiments are listed in Table 1:
Table 1.
Test conditions for velocity measurements
| Test materials | Flow rates (mL/min) | Temperature (°C) |
|---|---|---|
|
| ||
| Empty chamber | 50, 100, 250, 450, 500 | 23 |
| Painted gypsum wallboard-A a | 50, 100, 250, 450, 500 | 23 |
| Carpet | 50, 100, 250, 450, 500 | 23 |
| Vinyl flooring-B | 50, 100, 250, 450, 500 | 23 |
| Vinyl flooring-C | 50, 100, 250, 450, 500 | 23 |
| Painted gypsum wallboard-A | 250 | 30, 40, 55 |
| Carpet | 250 | 30, 40, 55 |
| Vinyl flooring-C | 250 | 30, 40, 55 |
Gypsum wallboard was painted with Behr Ultra Pure White Eggshell Enamel Low Odor Interior Paint and Primer in One.
Measurements were made with a Kanomax Climomaster (hot-wire) Anemometer Model 6501–0E (Kanomax USA, Inc. NJ, USA) with a model 6543 probe with the probe tip ~1 mm above the test substrate. The flow measurement has a precision of 0.015 m/s and the range of measurements extends 0.02 to ~0.2 m/s. The probe could be inserted into the micro-scale chamber at two locations (Fig. 2). The probe was allowed to equilibrate for 30 seconds prior to collecting velocity readings. Readings were recorded every 5 seconds for 100 readings (8-⅓ minutes). The average velocity and standard deviation were calculated from the readings from each zone. Temperature data was also collected simultaneously with the velocity data. The Model 6543 probe is ‘omnidirectional’ and for this purpose, the velocities measured could be assumed to be those in the horizontal plane parallel to the bottom of the micro-scale chamber. It is not possible to determine all three components of velocity with this probe. Actual distances from the probe tip to the test material were not recorded precisely in the initial experiments – the comparisons that follow present results for locations 2 mm and 3 mm from the test material. Fig. 2 (left) shows an isometric view of the micro-scale chamber while Fig. 2 (right) shows a top-down view that indicates the inlet / outlet ports as well as two locations (Probes 1 and 2) where the probes to collect the velocity measurements were inserted.
Fig. 2.

Isometric view (left) and top-down view (right) of micro-scale chamber used for velocity measurements
4. Results and discussion
4.1. Computation vs. experiment
The mesh used for the validation simulations is illustrated in Fig. 3 (left) as is a typical contour plot of velocity magnitude (Fig. 3, right). The latter shows the expected downward flow of the inlet jet. This jet impinges on the test material, creating a recirculating flow pattern. A mesh resolution study was performed for the 250 mL/min, empty chamber, 23° C case. The coarse mesh contains 557,495 elements, the medium mesh contains 765,824 elements, and the fine mesh contains 910,846 elements. Fig. 4 shows centerline velocity predictions versus distance from the bottom wall for each case. The medium mesh provides results very close to that of the finest mesh. This mesh density was used for the remaining cases performed.
Fig. 3.

Surface mesh (left) and centerplane velocity magnitude contours (m/s) (right)
Fig. 4.

Effect of mesh refinement on centerline velocity predictions (250 mL/min flow)
Except for the carpet test material (discussed later), all cases involving smoother test materials were meshed so that the volume occupied by the test material was subtracted from the volume of the empty chamber. This reduces the volume occupied by the recirculating flow. In the results that follow, predictions of the wall-parallel velocity magnitude at the two locations shown in Fig. 2 (termed Probe 1 and Probe 2) are compared with experimental measurements. As mentioned earlier, the actual distance between the probe tip and the surface was not determined precisely in the initial experiments – computational predictions were extracted at locations 2 mm and 3 mm above the test material (or the bottom of the chamber if no test material was present). The experimental measurements presented are associated with the Probe 1 (centerline) location. Fig. 5 shows results for the empty chamber at the two probe locations. In all cases, the computational model under-predicts the measured velocity, particularly at the lower flow rates. Velocity predictions extracted 2 mm from the surface are generally in better agreement with the experimental distribution.
Fig. 5.

Velocity predictions vs. experiment at different flow rates (empty chamber)
The level of disagreement shown is not ideal, and several modifications were made to try to narrow the gap between experiment and prediction. A time-dependent simulation was conducted for the 250 mL/min flow rate case. The time-dependent result (shown as the X in Fig. 5) is in the direction of improved agreement with the experimental data, but the cost of the time-dependent simulations proved to be prohibitive (nearly 800 times the cost of running one steady-state simulation).
Some of the measurements for the empty chamber using the Probe 1 location (center of the unit, see Fig. 2) were repeated with more precise monitoring of the probe tip’s distance from the test material. Table 2 shows results for the first three probe tip locations.
Table 2.
New velocity measurements (m/s)
| Flow rate (mL/min) | Probe tip distances from test material (mm) | CFD prediction | ||
|---|---|---|---|---|
|
| ||||
| 1 | 2 | 4 | 2 | |
| 250 | 0.11 | 0.03 | 0.00 | 0.06 |
| 450 | 0.11 | 0.04 | 0.03 | 0.14 |
These new experimental results point to closer agreement at low flow rates with the computational predictions, particularly if unsteady flow is assumed, but show a similar response at higher flow rates.
Computations and experiments were also performed for vinyl flooring and gypsum wallboard in the micro-chamber. These materials have surface roughness and non-uniformity, which was measured using a surface profilometer. The Root Mean Square (rms) roughness heights were measured as 31.55 microns and 12.34 microns for the vinyl flooring and gypsum wallboard, respectively. An attempt was made to model the effects of roughness using an effective-viscosity concept [12]. The form shown in Eq. (1) modifies the kinematic viscosity of the fluid near the wall. In this expression, is the kinematic viscosity (m2/s), is the rms roughness height (m), is the magnitude of the wall-parallel velocity vector (m/s) at the first layer of cells away from the wall, is the distance from the wall (m), and and are dimensionless model constants from [16]. The modified viscosity is used in the first layer of cells near the wall.
| (1) |
This model was implemented near the surface using a user-defined function. The simulation results showed negligible differences when the effective viscosity was applied near the test material surface. Figures 6 and 7 show results from these cases. Similar trends to those illustrated for the empty chamber are again in evidence – the Probe 1, 2 mm predictions are closer to the experimental data, but there is a substantial error at all flow rates.
Fig. 6.

Velocity predictions vs. experiment at different flow rates (vinyl flooring)
Fig. 7.

Velocity predictions vs. experiment at different flow rates (gypsum wallboard)
The experimental database also included cases involving a carpet test material. To simulate the effects of a porous layer, we incorporated a Darcy-Forchheimer model [17] into the momentum equations as a user-defined function:
| (2) |
The following parameters were used, following [17,18]: M = 85.2, N = 0.69, fiber diameter ds = 60 μm, gas-phase volume fraction α = 0.9158. The Reynolds number in Eq. (2) is based on the velocity magnitude (m/s) within the carpet. The carpet layer thickness was measured based on the actual sample, and the resistance model was applied only within the carpet layer. Fig. 8 shows snapshots of the centerplane velocity field along with the meshing arrangement. The resistance effect of the carpet layer is evident. Predictions of the velocity along with experimental data at the Probe 1 location are shown in Fig. 9. Agreement with experiment is somewhat better for this case, implying that the presence of the carpet may be dampening large-scale unsteady motion that might be present in the experiment but is not captured in the simulations.
Fig. 8.

Centerplane velocity magnitude contours (carpet layer at top, 250 mL/min flow)
Fig. 9.

Velocity predictions vs. experiment at different flow rates (carpet)
4.2. Determination of the convective mass transfer coefficient
As evidenced above, agreement with experiment for the larger diffusion chamber in the literature [3] used for the velocity field measurements is not ideal, but the trends are generally correct. We therefore regard the laminar flow model within the micro-scale chamber as an appropriate flow model and continue the analysis for a micro-scale chamber equipped with a diffusion accessory, as sketched in Fig. 1. The computational domain is comprised of Chamber B and parts of the inflow/outflow tubes. The test material is placed between Chamber A and Chamber B – the volume occupied by the flow in Chamber B does not change for solid test materials. For carpet, some of the carpet fibers will occupy volume within Chamber B – this displacement is accounted for by incorporating a porous layer and including the resistance model discussed earlier. The computational mesh is thus the same for all the studies performed. Fig. 10 shows some of the geometric details of Chamber B. The material contact area () is the part of the geometry that is exposed to the recirculating flow. The cross-section planform area () is used as a scaling factor, as discussed later. The darker red band in the planform area schematic indicates the part of the volume that would be considered as a porous medium for a carpet test material.
Fig. 10.

Geometric details of Chamber B
The convective mass transfer coefficient amalgamates local information regarding diffusional surface mass transport into an average form that connects a known surface concentration to the bulk (volumetrically averaged) concentration in the field. Assuming a Fickian diffusion process with the species diffusion velocity vector , modeled as , we have
| (3) |
as the expression for volumetric transfer of mass across a surface.
where is the concentration of the vapor at the top surface of the test material, is the concentration gradient normal to the surface, and the surface area is as defined above. The surface integral represented on the left-hand side can be formulated from the flow solution, as can the volume-averaged concentration of the agent in the upper chamber once steady-state has been reached. Since the agents in question are dilute enough not to affect the properties of the air within the chamber to a significant degree, it is appropriate to consider the agent as a passive scalar for the purpose of determining the mass transfer coefficient. As such, the surface concentration was fixed to unity. Computational simulations were performed for a range of flow rates (50, 100, 250, 450, 500 mL/min), a range of Schmidt numbers (dimensionless) (0.5, 0.75, 1.0, 1.25, 1.5), and for smooth and porous surfaces. The reciprocal of the Schmidt number is defined as the ratio of the diffusivity of the agent in air to the kinematic viscosity of air at a given temperature. Fig. 11 shows the surface distribution of the concentration gradient for different flow rates and a unity Schmidt number. The results show some asymmetry in the flow as the flow rate increases. A general trend of higher concentration gradients near the location of jet impingement is present, as is the increasing influence of the jet in promoting diffusional transport from the surface as the flow rate increases.
Fig. 11.

Surface concentration gradient vs flow rate
Models for convective mass transfer generally correlate the mass transfer coefficient in terms of a non-dimensional Sherwood number (), which itself is a function of a defined Reynolds number (, dimensionless) and the Schmidt number:
| (4) |
Where is the chemical diffusion coefficient in air (m2/s) and is the characteristic length of the material (m).
We have used the following definitions for the Reynolds number and characteristic length in Fig. 1:
| (5) |
| (6) |
Here, is the volume of Chamber B (1.92e-5 m3) and (4.14e-4 m2) is the cross-sectional platform area discussed earlier. The kinematic viscosity of air (m2/s) is determined from the ideal gas law and Sutherland’s law for the viscosity of air:
| (7) |
Here, is the chamber temperature ( is the density of air in the chamber (kg/m3), is the chamber pressure, assumed to be 101,325 Pa, and is the gas constant for air, 287 J/(kg-K) The Schmidt number is defined as .
Fig. 12 shows typical responses of the convective mass transfer coefficient as a function of Reynolds number and Schmidt number for the cases without the porous (carpet) layer. Fig. 12 shows that the convective mass transfer coefficient increases with increasing Reynolds number and decreases with increasing Schmidt number. Recalling the inverse relationship between the Schmidt number and the agent diffusivity relative to air, this implies that increased agent diffusivity increases the mass transfer coefficient substantially. The fact that the computational predictions generally under-estimate the experimental velocity data (Section 3) indicates that the actual mass transfer coefficients might be greater than predicted by the model, but as will be shown later, the material diffusivity predictions are nearly independent of the precise value of the convective mass transfer coefficient. Fig. 13 shows that including the carpet porous layer has the effect of reducing the increase in convective mass transfer coefficient with Reynolds number, while the effect of Schmidt number remains similar to the case without the carpet layer.
Fig. 12.

Convective mass transfer coefficient versus Reynolds number and Schmidt number
Fig. 13.

Convective mass transfer coefficient versus Reynolds number and Schmidt number: effect of carpet layer
The resistance model applied within the carpet layer is sensitive to the assumed porosity and fiber diameter. Fig. 14 indicates that the influence of the porosity on the predicted convective mass transfer coefficient is more pronounced than that of the fiber diameter, appearing to asymptote at lower porosities and reaching its maximum value (that of the smooth test material) as the porosity approaches one. The carpet layer provides resistance to the flow near the surface, effectively slowing it down. This reduces the convective mass transfer.
Fig. 14.

Effect of carpet porosity and fiber diameter on convective mass transfer coefficient (250 mL/min, Sc = 1.0)
4.3. Micro-scale chamber mass-balance modeling
We have regressed the data from the computational studies into the following functional form for the Sherwood number, assuming SI units throughout.
| (8) |
| (9) |
This model utilizes geometric information defined earlier and thus is specific to the customized micro-scale chamber geometry. The CFD studies considered carpet with gas-phase volume fractions (dimensionless) ranging from 0.9 to near 1.0. A non-porous surface (such as the empty chamber, gypsum wallboard, and vinyl flooring considered in this work) is assigned a default value of This model can be used in a steady-state mass balance model for agent transport within the micro-scale chamber [14] (see Fig. 1 and Supplementary Material (SM)) rearranged to solve for the material diffusion coefficient and the material / gas partition coefficient .
| (10) |
| (11) |
| (12) |
Here, convective mass transport in the lower chamber -A- is assumed to be negligible – the concentration in Chamber A is assumed to be uniform Quantities needed in the model include the flow rate out of the upper chamber (), the cross-sectional area of the chamber (), the thickness of the test material (), and the volume of the test material (). The steady-state concentration in the upper chamber, , is measured by the sampling device, the mass of the agent absorbed into the test material, , is measured by thermal desorption after the completion of each test, and the steady-state concentration of the agent in the lower chamber, , can either be measured using a headspace method or calculated by assuming equilibrium with the liquid or solid reactant. The model for the convective mass transfer coefficient for the upper chamber (B) closes the formulation. This form also requires the assumption of a linear concentration profile across the test material. The time rate of change of absorption in the test material is also neglected. Experiments have been conducted to obtain the input parameters to be used for the calculation of and in Equations (10) and (12). Before a diffusion test, the test specimen was confirmed to be free of the target chemical. The diffusion test in the micro chamber was conducted at 23°C, humidified or dry air and different air flows. Chamber background samples were collected prior to the test. About 0.3 gram of paraformaldehyde powder was added into the well (Chamber A), followed by placing the test material in the chamber. 2,4-dinitrophenylhydrazine (DNPH) cartridge (Waters Sep-Pak DNPH Silica Gel Cartridge, Waters Corporation, Milford, MA) samples were collected at defined time intervals at the top chamber (Chamber B). The test end time was determined by the concentration difference of two adjacent data points being less than 15%. When the test was stopped, the test chamber was opened, and then the test material was quickly moved out for further thermal desorption test. More details are described in the SM.
The operation of the micro-scale chamber results in time-dependent concentration output (shown in Fig. 15 for samples of vinyl flooring and gypsum wallboard). The agent is solid-phase paraformaldehyde, which is placed in the lower chamber and then volatilizes. The operation of the thermal desorption chamber results in another time-dependent concentration output (also shown in Fig. 15). The average concentration data needed () can be obtained from the time-dependent output, while the desorption mass flow rate can be obtained by solving a mass balance equation for the desorption reactor:
| (13) |
Fig. 15.
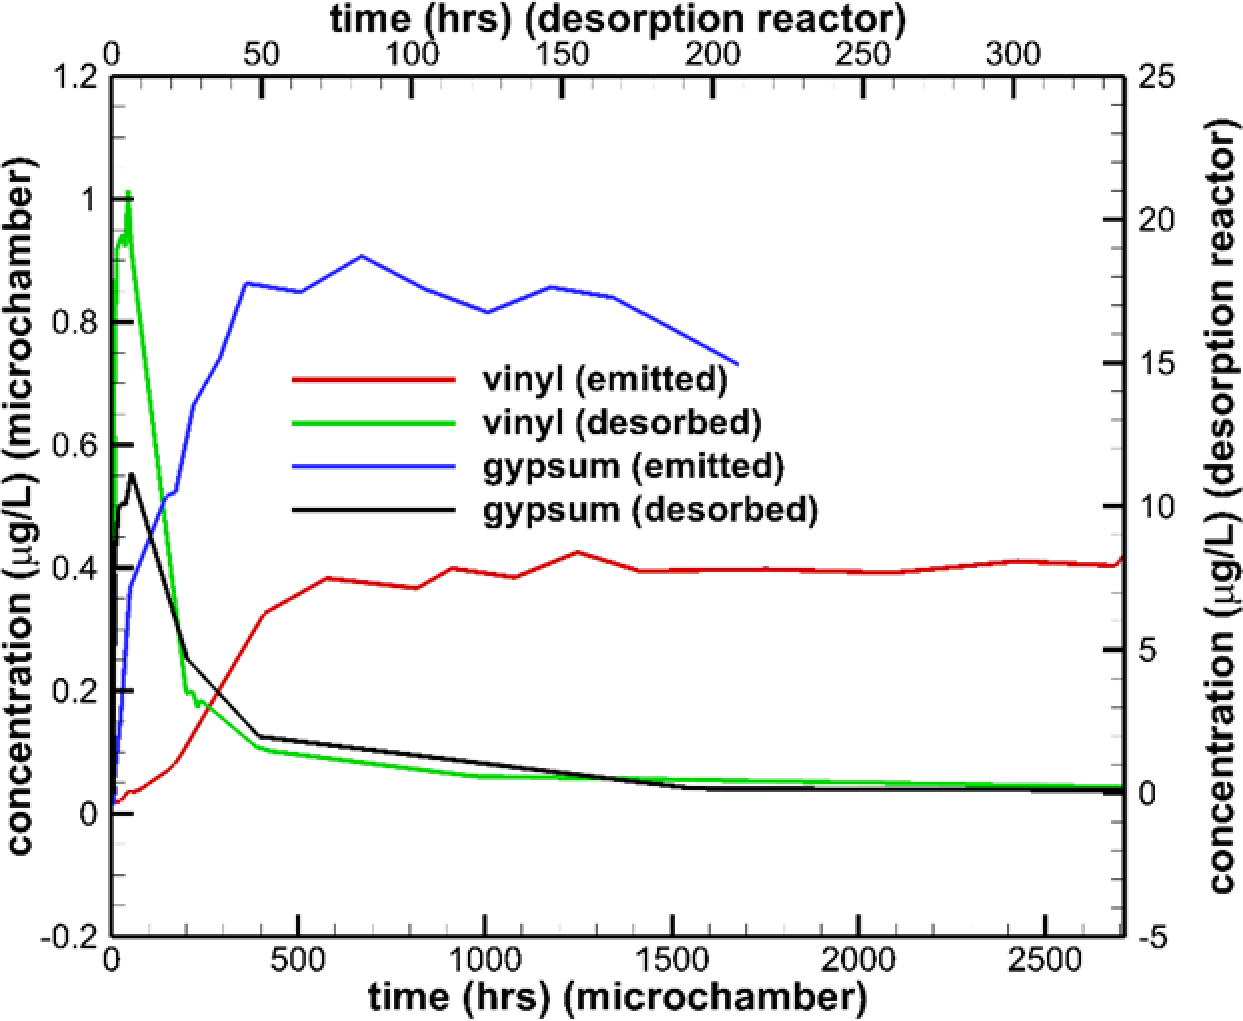
Concentration vs. time histories for vinyl and gypsum samples
Here, and are the volume of the desorption reactor and its volume flow rate, respectively, and is the measured concentration output. Once the desorption mass flow rate is known, it can be integrated over the duration of the desorption process to obtain the total mass of agent captured in the test material. Table 3 shows key input and output parameters for vinyl, gypsum, and carpet flooring examples. The concentration in Chamber A () is estimated from the vapor pressure of formaldehyde at room temperature. The diffusivity () is that of formaldehyde vapor in air, estimated to be 1.46e-5 m2/s according to [19]. The results indicate that the vinyl flooring is quite resistant to formaldehyde transport, and as expected, the carpet sample is not very resistant. The term in Equations (11) and (12) is much smaller than the concentration difference, implying that a well-mixed assumption for Chamber B might be appropriate.
Table 3.
Micro-scale chamber CFD model results
| Materials | (μg/L) | (μg) | (mL/min) | (m/s) | (m2/s) | |
|---|---|---|---|---|---|---|
|
| ||||||
| Vinyl (a) | 3.55E-01 | 3.27E03 | 5.10E01 | 6.95E-03 | 1.22E-10 | 7.11E02 |
| Vinyl (b) | 7.60E-02 | 9.20E02 | 3.86E02 | 9.71E-03 | 5.06E-11 | 2.10E02 |
| Vinyl (c) | 1.02E-01 | 8.56E02 | 3.96E02 | 9.67E-03 | 6.38E-11 | 2.05E02 |
| Vinyl (d) | 3.00E-02 | 4.78E02 | 5.01E02 | 1.19E-02 | 3.62E-11 | 1.14E02 |
| Vinyl (e) | 8.80E-02 | 4.63E02 | 5.09E02 | 8.53E-03 | 3.45E-11 | 1.10E02 |
| Gypsum (a) | 7.77E-01 | 1.09E04 | 2.42E02 | 9.61E-03 | 2.68E-09 | 4.63E02 |
| Gypsum (b) | 1.32E-01 | 8.66E03 | 2.48E02 | 9.69E-03 | 6.83E-10 | 2.52E02 |
| Gypsum (c) | 3.65E-01 | 9.32E03 | 2.45E02 | 9.65E-03 | 1.25E-10 | 4.05E02 |
| Carpet(a) | 3.15 | 9.65E01 | 4.50E02 | 7.53E-03 | 1.10E-08 | 7.54 |
| Carpet (b) | 6.51 | 4.92 | 1.55E02 | 6.92E-03 | 7.78E-09 | 3.71E-01 |
| Carpet (c) | 8.87 | 4.17 | 1.53E02 | 6.93E-03 | 1.06E-08 | 3.25E-01 |
CA,ss = 2300 μg/L and Da = 1.46e-5 m2/s for all the calculations in the table. Carpet used α = 0.91
Some of the test materials (Table S1) were similar to those used in an earlier study by Xu, et al. [6], also considering formaldehyde as the agent. The processes for analysis are similar, but the sampling chamber in [6] is much larger and the relative humidity was also varied in this study from 20% to 70%. Furthermore, a constant flowing formaldehyde supply was provided to Chamber A, which was not quiescent as in this work. Xu, et al. tabulated the effective diffusion coefficient instead of the material diffusion coefficient and considered various types of wallboard and carpet but not vinyl flooring. They also used a simplified form of Equations (11) and (12) that assumed that both chambers were well-mixed. Convective mass transfer effects are likely more important in the study of Xu, et al. than in this study due to continuous flow in both chambers. Table 4 compares values of and from the micro-scale chamber analysis with those from [6].
Table 4.
Comparison of results between this study and literature data
| Test materials | (m2/s) | |
|---|---|---|
|
| ||
| Vinyl (a) (this study) | 1.22E-10 | 7.11E02 |
| Vinyl (b) (this study) | 5.06E-11 | 2.10E02 |
| Vinyl (c) (average, n = 3; this study) | 4.48E-11 | 1.43E02 |
| Gypsum wallboard (a) (average, n=2; this study) | 1.49E-09 | 4.34E02 |
| Gypsum wallboard (b) (this study) | 6.83E-10 | 2.53E02 |
| Gypsum wallboard ([3], 20% RH) | 3.67E-08 | 3.04E02 |
| Gypsum wallboard ([3], 50% RH) | 6.34E-08 | 4.46E02 |
| Gypsum wallboard ([3], 70% RH) | 9.84E-08 | 4.04E02 |
| Carpet (average, n=3; this study) | 9.79E-09 | 2.75 |
| “Green” carpet ([3], 20% RH) | 2.30E-05 | 4.71E02 |
| “Green” carpet ([3], 50% RH) | 2.64E-05 | 6.61E02 |
| “Green” carpet ([3], 70% RH) | 5.00E-05 | 9.67E02 |
Model predictions for obtained from the micro-scale chamber experimental results range consistently below the values reported in [6]; values for are comparable. This indicates that the concentration difference between Chambers A and B in the present study is much larger than reported in [6] but that the mass absorbed within the test material is similar. Additional comparisons with other literature sources [20–27] for transport through common building materials are presented in Fig. 16 () and Fig. 17 (). Recall that the value of depends mostly on concentration differences and is thus a direct outcome of the sampling device. The material diffusivity and the material / air partition coefficient depend on a separate measurement of mass absorption into the test material. Square symbols indicate literature data; circles indicate results obtained from the present micro-scale chamber studies. Results are presented for other building materials (particle board, fiberboard, laminate flooring, miscellaneous materials) that are not included in the present test matrix. The intent is to show the scatter in and obtained even for the same class of material. The results for for wallboard are lower than available data; values obtained for vinyl flooring are close to the measurement of [21]. The results for carpet are scattered but generally indicate more resistance to agent transport than observed in other studies. Results for are placed with other literature data in Fig. 17. For wallboard, the present values for are well within the range of the literature but are lower than previous results for vinyl and much lower versus previous results for carpet. Overall, the current measurement approach and the model based on it provides outcomes in line with scatter evidenced in prior results. For the model, geometric features are specific to the micro-scale chamber but the general approach could be used for other testing devices when applicable.
Fig. 16.

Estimation of material diffusivity for various test materials (from this study and References 3, 20–27)
Fig. 17.

Estimation of material / air partition coefficient for various test materials (from this study and References 3, 20–27)
5. Conclusions
Computational fluid dynamics studies of the flow within micro-scale chamber sampling devices have been conducted using ANSYS Fluent software for the purpose of developing a data-driven model for the convective mass transfer coefficient. Initial validation studies conducted for a larger chamber without a diffusion accessory show that the computational model (based on steady laminar flow) predicts the experimentally observed trend of increasing near-surface velocity with increasing flow rate but deviates from experimental velocity measurements at lower flow rates. Assuming fully turbulent flow does not improve results but allowing for time-dependent laminar flow within the unit leads to somewhat better agreement with experimental data. The resistive effect of a carpet test material on the recirculating flow within the micro-scale chamber has been modeled using a Darcy-Brinkman porous layer. Agreement with experimental velocity measurements is better for the carpet layer than for smoother test materials (vinyl flooring, gypsum wallboard, empty chamber).
Computational studies that extract the steady-state agent concentration distribution within a micro-scale chamber device equipped with a diffusion accessory have also been performed. These studies vary the flow rate into the unit and the Schmidt number of the agent and have been used to regress a model for the convective mass transfer coefficient. The effects of a resistive layer representing a carpet test material have also been included in the model. The results indicate the upper chamber of the unit is essentially a well-mixed environment for the conditions studied. The regression for the convective mass transport coefficient has been integrated into a mass-balance model for the operation of the micro-scale chamber, with the goal being to predict the diffusivity of a known agent (paraformaldehyde) through a test material. Results obtained for vinyl flooring, gypsum wallboard, and carpet material show that the carpet is the least resistant to agent transport, while the vinyl flooring is the most resistant. Comparisons with other literature estimates of diffusivity and material / air partition coefficient indicate that the micro-scale chamber sampling device and the model built from its data provide results within the range of scatter of other experiments.
The model and data analysis in this paper made use of formaldehyde as an example of volatile chemicals. SVOCs such as phthalate, organophosphorus flame retardants, polychlorinated biphenyls and per- and polyfluoroalkyl substances, have lower vapor pressures and relatively smaller values of at room temperature. Therefore, the experimental temperature for SVOCs can be easily elevated in the micro-scale diffusion chamber, so that the mass transfer process can be similar to that of VOCs in the gas phase. When different experimental data at several elevated temperatures are collected, the and at room temperature can be determined by extrapolation. This is the major advantage of this micro-scale diffusion method over others.
Supplementary Material
6. Acknowledgements
This work is supported by the U.S. Environmental Protection Agency under PO# 68HE0B22P0086. The graphical user interface for implementing the developed models was written by Benjamin K. Edwards, Department of Computer Science, University of North Carolina. The authors would like to thank Edgar Folk IV from Jacobs Solutions Inc. for measuring air velocity in micro-scale chambers and conducting micro-scale chamber tests and Markes International to customize the micro-scale diffusion chamber.
Footnotes
Disclaimer
This manuscript has been reviewed in accordance with U.S. EPA policy and approved for publication. The views expressed are those of the author and do not necessarily represent the views and policies of the agency. Mention of trade names or commercial products does not constitute endorsement or recommendation for use.
8. References
- 1.Eichler CMA, Xu Y, Cohen Hubal EA, Cao. J, Bi C, Weschler CJ, Salthammer T, Glenn C Morrison GC, Koivisto AJ, Zhang Y, Mandin C, Wei W, Blondeau P, Poppendieck D, Liu X, Delmaar C, Jolliet O, Shin H Diamond ML, Shiraiwa M, Zuend A, Hopke PK, Fantke P, von Goetz N, Kulmala M, Little JC, Assessing Human Exposure to SVOCs in Materials, Products and Articles: A Modular Mechanistic Framework. Environmental Science & Technology, 2021, 55, 25–43. 10.1021/acs.est.0c02329 [DOI] [PMC free article] [PubMed] [Google Scholar]
- 2.Cox SS, Zhao D, Little JC, Measuring Partition and Diffusion Coefficients for Volatile Organic Compounds in Vinyl Flooring. Atmospheric Environment, 2001, 35(22): 3823–3830. https://cfpub.epa.gov/si/si_public_file_download.cfm?p_download_id=466888&Lab=NRMRL [Google Scholar]
- 3.Zhao D, Little JC, Cox SS, Characterizing Polyurethane Foam as a Sink for or Source of Volatile Organic Compounds in Indoor Air. Journal of Environmental Engineering, 2004, 130(9): 983–989 [Google Scholar]
- 4.Meininghaus R, Uhde E Diffusion Studies of VOC Mixtures in a Building Material. Indoor Air, 2002,12(4): 215–222. [DOI] [PubMed] [Google Scholar]
- 5.Xiong J Yan W, Zhang Y, He Z An improvement for dynamic twin chamber method to measure VOC diffusion coefficient and partition coefficient, ASHRAE Transactions, 2009, 115, 954–958. [Google Scholar]
- 6.Xu J, Zhang JS, Liu X, Gao Z, Determination of Partition and Diffusion Coefficients of Formaldehyde in Selected Building Materials and Impact of Relative Humidity, Journal of the Air & Waste Management Association, 2012, 62(6), 671–679. [DOI] [PubMed] [Google Scholar]
- 7.Liu X, Guo Z, Roache RF, Experimental method development for estimating solid-phase diffusion coefficients and material/air partition coefficients of SVOCs. Atmospheric Environment, 2014, 89, 76–84. [Google Scholar]
- 8.Liu X, Allen MR, Roache NF, Characterization of Organophosphorus Flame Retardants’ Sorption on Building Materials and Consumer Products, Atmospheric Environment, 2016, 140, 333–34. [Google Scholar]
- 9.Xiong J, Yao Y, and Zhang Y C-History Method: Rapid Measurement of the Initial Emittable Concentration, Diffusion, and Partition Coefficients for Formaldehyde and VOCs in Building Materials, Environmental Science and Technology, Vol 45, No. 8, 2011, pp. 3584–3590. [DOI] [PubMed] [Google Scholar]
- 10.Liang Y, Liu X, Allen MR, Measuring and Modeling Surface Sorption Dynamics of Organophosphate Flame Retardants on Impervious Surfaces, Chemosphere 2018, 193, 754–762. [DOI] [PMC free article] [PubMed] [Google Scholar]
- 11.Liang Y, Liu X, Allen MR, Measurements of Parameters Controlling the Emissions of Organophosphate Flame Retardants in Indoor Environments, Environmental Science & Technology, 2018, 52, 5821–5829. [DOI] [PMC free article] [PubMed] [Google Scholar]
- 12.Corsi RL, Crain N, Fardal J, Little J, and Xu Y Determination of Sorption Parameters for 36 VOC/Material Combinations, Final Report, U.S.EPA Contract EPA 600/R-07/035-R1, 2007. https://cfpub.epa.gov/si/si_public_file_download.cfm?p_download_id=466888&Lab=NRMRL [Google Scholar]
- 13.Schripp T Nachtwey B, Toelke, Salthammer T, Uhde E, Wensing M, Bahadir M, A microscale device for measuring emissions from materials for indoor use, Anal Bioanal Chem, 2007. Mar;387(5):1907–19, 10.1007/s00216-006-1057-2 [DOI] [PubMed] [Google Scholar]
- 14.Mao Y, Li Z, He Y, Tao W CFD analysis of SVOC mass transfer in different chambers, International Journal of Heat and Mass Transfer 99 (2016) 613–621, 10.1016/j.ijheatmasstransfer.2016.04.006 [DOI] [Google Scholar]
- 15.Foat T, Drodge J, Charlesona A, Whatmorea B, Pownall S, Glover P, Nallya J, Parker S,, Khana C, Marr A Predicting Vapour Transport from Semi-Volatile Organic Compounds Concealed within Permeable Packaging, International Journal of Heat and Mass Transfer, Volume 183, Part A, February 2022, 122012, 10.1016/j.ijheatmasstransfer.2021.122012 [DOI] [Google Scholar]
- 16.Merkle CL, Kubota T, Ko DRS An Analytical Study of the Effects of Surface Roughness on Boundary Layer Transition, Interim Report, AFOSR Contract F4462Q-74-C-00490, 1974. https://apps.dtic.mil/sti/tr/pdf/ADA004786.pdf [Google Scholar]
- 17.Cicciarelli BA, Davidson DL, Hart EH, and Peoples PR (2002). CFD Analysis of the Behavior of Airborne Allergens in Carpeted and Uncarpeted Dwellings, 2002 ASME Pressure Vessels and Piping Conference 2002–1557, Vancouver, Canada. 10.1115/PVP2002-1557 [DOI] [Google Scholar]
- 18.Oberoi RC, Choi J-I, Edwards JR, Rosati JA, Thornburg J, and Rodes CE Human Induced Resuspension in a Room, Aerosol Science and Technology, Vol. 44, No. 3, 2010, pp. 216–227, 10.1080/02786820903530852 [DOI] [Google Scholar]
- 19.Nelson GO Gas Mixtures: Preparation and Control. NY: Taylor &Francis, Inc, 1982. [Google Scholar]
- 20.Xu J, Zhang JS An experimental study of relative humidity effect on VOC’s effective diffusion coefficient and partition coefficient in a porous medium, Building and Environment, Vol. 46, No. 9, 2011, pp. 1765–1796, 10.1016/j.buildenv.2011.02.007 [DOI] [Google Scholar]
- 21.Zhang Y, Luo X, Wang X, Qian K, Zhao R Influence of temperature on formaldehyde emission parameters of dry building materials, Atmospheric Environment, Vol. 41, No. 15, 2007, pp. 3203–3216. 10.1016/j.atmosenv.2006.10.081 [DOI] [Google Scholar]
- 22.Wang X and Zhang Y A New Method for Determining the Initial Mobile Formaldehyde Concentrations, Partition Coefficients, and Diffusion Coefficients of Dry Building Materials, Journal of the Air and Waste Management Association, Vol. 59, No. 7, 2009, pp. 819–825. 10.3155/1047-3289.59.7.819 [DOI] [PubMed] [Google Scholar]
- 23.Zhou X, Liu Y, Song C, Liu J A Study on the Formaldehyde Emission Parameters of Porous Building Materials based on Adsorption Potential Theory, Building and Environment, Vol 106, September, 2016, pp. 254–264. 10.1016/j.buildenv.2016.07.003 [DOI] [Google Scholar]
- 24.Zhou X, Dong X, Wang X, and Wang F A New Method for Determining the Formaldehyde Emission Characteristic Parameters of Building Materials: Single Airtight Emission Method, Building and Environment, Vol. 207, Part A, January, 2022, 108419. 10.1016/j.buildenv.2021.108419 [DOI] [Google Scholar]
- 25.Zhang X, Cao J, Wei J, and Zhang Y Improved C-History Method for Rapidly and Accurately Measuring the Characteristic Parameters of Formaldehyde / VOCs Emitted from Building Materials, Building and Environment, Vol. 143, October, 2018, pp. 570–578. 10.1016/j.buildenv.2018.07.030 [DOI] [Google Scholar]
- 26.Wang H, Wang H, Xiong J, Huang S, Koutrakis P A Rapid and Robust Method to Determine the Key Parameters of Formaldehyde Emissions from Building and Vehicle Cabin Materials: Principle, Multi-Source Application and Exposure Assessment, Journal of Hazardous Materials, Vol. 430, 15 May 2022, 128422. 10.1016/j.jhazmat.2022.128422 [DOI] [PubMed] [Google Scholar]
- 27.He Z, Xiong J, Kumagai K, Chen W An Improved Mechanism-based Model for Predicting the Long-Term Formaldehyde Emissions from Composite Wood Products with Exposed Edges and Seams, Environmental International, Vol. 132, November 2019, 105086. 10.1016/j.envint.2019.105086 [DOI] [PubMed] [Google Scholar]
Associated Data
This section collects any data citations, data availability statements, or supplementary materials included in this article.