



Abstract
Purpose
Lipocalin 2 (LCN2) is a newly recognized bone-derived factor that is important in regulation of energy metabolism. We investigated the correlation of serum LCN2 levels and glycolipid metabolism, and body composition in a large cohort of patients with osteogenesis imperfecta (OI).
Methods
A total of 204 children with OI and 66 age- and gender-matched healthy children were included. Circulating levels of LCN2 and osteocalcin were measured by enzyme-linked immunosorbent assay. Serum levels of fasting blood glucose (FBG), triglyceride (TG), total cholesterol (TC), and low- and high-density lipoprotein cholesterol (LDL-C, HDL-C) were measured by automated chemical analyzers. The body composition was measured by dual-energy X-ray absorptiometry. Grip strength and timed-up-and-go (TUG) were tested to evaluate the muscle function.
Results
Serum LCN2 levels were 37.65 ± 23.48 ng/ml in OI children, which was significantly lower than those in healthy control (69.18 ± 35.43 ng/ml, P < 0.001). Body mass index (BMI) and serum FBG level were significantly higher and HDL-C levels were lower in OI children than healthy control (all P < 0.01). Grip strength was significantly lower (P < 0.05), and the TUG was significantly longer in OI patients than healthy control (P < 0.05). Serum LCN2 level was negatively correlated to BMI, FBG, HOMA-IR, HOMA-β, total body, and trunk fat mass percentage, and positively correlated to total body and appendicular lean mass percentage (all P < 0.05).
Conclusions
Insulin resistance, hyperglycemia, obesity, and muscle dysfunction are common in OI patients. As a novel osteogenic cytokine, LCN2 deficiency may be relevant to disorders of glucose and lipid metabolism, and dysfunction of muscle in OI patients.
Supplementary Information
The online version contains supplementary material available at 10.1007/s40618-023-02121-4.
Keywords: Lipocalin 2, Glycolipid metabolism, Muscle function, Body composition, Osteogenesis imperfecta
Introduction
Lipocalin 2 (LCN2), also known as neutrophil gelatinase-associated lipocalin (NGAL), is a newly identified osteogenic cytokine, a secretory protein of a superfamily that bind and transport lipids and other hydrophobic molecules [1]. LCN2 is mainly produced by osteoblasts, which plays diverse functions, including anorexigenic action, reducing body weight, and improving the glucose metabolism through acting as a satiety signal molecule that is upregulated after feeding [1, 2]. LCN2 can cross the blood–brain barrier and activate the melanocortin four receptor (MC4R)-dependent pathway, one of the most potent regulating pathways of obesity [1]. However, the precise roles of LCN2 in diabetes, obesity, and muscle dysfunction still need to be elucidated in depth.
Over the years, metabolic dysfunction has been gradually noted in bone diseases. Osteogenesis imperfecta (OI) is the most common inherited disorders of connective tissue, which is characterized by increased bone fragility, impaired bone strength, recurrent bone fractures, and progressive bone deformities, with several extra-skeletal manifestations, such as blue sclera, dentinogenesis imperfecta, joint hypermobility, and hearing impairment [3, 4]. According to the clinical severity, OI was classified as five subtypes: mild OI (type I), perinatally lethal OI (type II), progressive deforming OI (type III), intermediate (type IV), and OI with hypertrophic callus (type V) [5]. Recently, multiple studies have found that insulin resistance, hyperglycemia, obesity, and sarcopenia are common comorbidities of OI patients [6–9], but the mechanism is unknown, and researches are scarce with regard to the effects of osteogenic cytokine and metabolic dysfunction in OI patients. It is worth studying whether the important osteogenic cytokine LCN2 participates in metabolic abnormalities of OI patients.
Therefore, we investigate serum levels of LCN2 and parameters of glycolipid metabolism, body composition, and muscle function in a large cohort of patients with OI, and analyze their relationship.
Subjects and methods
Subjects
This was a cross-sectional study conducted in endocrinology department of Peking Union Medical College Hospital (PUMCH) from May 2018 to April 2022. OI patients less than 18 years old and age- and gender-matched normal controls who came for health examination were enrolled. The patients were diagnosed as OI if they met one of the following inclusion criteria: (1) patients had a genetic diagnosis of OI; (2) patients had a history of more than one bone fracture under minor trauma, and an age- and sex-adjusted BMD Z-score less than or equal to − 1.0 at lumbar spine (LS) or femoral neck (FN); (3) patients with BMD Z-scores less than or equal to − 2.0 at LS or FN [10, 11]. Patients were excluded if they had a history of fracture within the recent 6 months prior to enrollment, to exclude the impact of recent fracture on parameters of osteogenic cytokine and metabolism. Patients were also excluded if they had other inherited or metabolic bone disease, or receiving treatment which could affect the glycolipid metabolism or muscle function, or with severe dysfunction of liver or kidney.
Medical history of OI patients was obtained in detail, and the height and weight were measured by Harpenden stadiometer (Seritex Inc., East Rutherford, NJ, USA). Body mass index (BMI) was calculated as weight (kg) divided by the square of height (m). Standard deviation score (SDS) of height, weight, and BMI were calculated basing on the reference data in normal Chinese [12–14]. Overweight and obesity were defined as BMI higher than the 85th and 95th percentile of reference data of normal Chinese children [12]. Ambulatory status was recorded and included unassisted, exclusively wheelchair, and assisted devices (walkers). If the patients were unassisted, they were recorded as “ambulatory”, otherwise they were recorded as “nonambulatory”.
The study was approved by the Scientific Ethics Committee of PUMCH (JS-2081). The legal guardians of OI patients and the normal controls provided written informed consents before they participated in this study.
Measurement of the levels of LCN2 and metabolic parameter
Venous blood specimens were obtained from OI patients and healthy controls between 8:00 and 9:00 am after an overnight fast. As osteocalcin (OC) is a very important marker of osteoblastic activity, serum OC levels were also detected. Serum LCN2 and OC levels were measured by enzyme-linked immunosorbent assay (ELISA, R&D Systems, Inc, USA) following the manufacturer’s instructions. The detection range of LCN2 and OC was 0.156–10.0 ng/ml and 0.5–16.0 ng/ml, respectively. The intra-assay coefficients of variation (CV) of LCN2 and OC were 3.1–4.4% and 3.0–4.8%, with the inter-assay CVs of 5.6–7.9% and 0.7–2.4%, respectively.
Serum levels of fasting blood glucose (FBG), triglyceride (TG), total cholesterol (TC), low-density lipoprotein cholesterol (LDL-C), high-density lipoprotein cholesterol (HDL-C), calcium (Ca), phosphate (P), total alkaline phosphatase (ALP, a bone formation marker), alanine aminotransferase (ALT), and creatinine (Cr) were measured by automated chemical analyzers (ADVIA1800, Siemens, Germany). Serum levels of fasting insulin (FINS), beta cross-linked carboxy-terminal telopeptide of type I collagen (β-CTX, a bone resorption marker), 25-hydroxyvitamin D (25OHD), and intact parathyroid hormone (PTH) were measured using an automated electrochemiluminescence system (E170; Roche Diagnostics, Switzerland). Insulin sensitivity/resistance and β-cell function were calculated as follows: homeostasis model assessment insulin resistance (HOMA-IR) equal to FBG (mmol/L) × FINS(μU/mL)/22.5, and homeostasis model assessment islet beta cell function (HOMA-β) equal to 20 × FINS(μU/mL)/ (FPG, mmol/L)-3.5)) (%). As renal function could affect the results, Schwartz equation was used to estimate glomerular filtration rate (eGFR) [15].
Normal controls only measured serum levels of LCN2 and glycolipid metabolic parameters. All these biochemical parameters were measured in the clinical central laboratory of PUMCH.
Measurement of BMD and body composition
BMD at lumbar spine (LS) 2–4 and proximal hip of OI patients were measured by dual-energy X-ray absorptiometry (DXA, Lunar Prodigy Advance, GE Healthcare, USA), of which Z-scores were calculated basing on a reference data of BMD in Chinese and Asian [13, 14]. Phantom testing was completed daily for calibration and quality check to ensure the accuracy of the measurement. The CVs of DXA measurement were 0.8 to 1.0%.
Composition of whole body of OI patients was also measured by DXA. Body fat mass percentage (%FM) and lean mass percentage (%LM) were calculated as the total fat mass or lean mass divided by the sum of bone, lean, and fat mass [16, 17]. Fat mass index (FMI) or lean mass index (LMI) was calculated as body fat mass (kg) or lean mass (kg) divided by height (m) squared, and appendicular mass was calculated as the sum of upper and lower limb masses [16, 17]. For males, slightly-to-moderately or severely increased %FM were set to greater than or equal to 20% or 25%, respectively, which were set to greater than or equal to 30% or 35% for female [18].
Measurement of muscle function
Grip strength of the dominant hand was detected using a handheld dynamometer (Hand Grip Dynamometer, FEINECE. Inc, China), and the highest of three attempts was recorded. Physical function was measured by the timed-up-and-go (TUG) test. The patients were timed, while they rise from an arm chair with approximate height of 46 cm, walking at a comfortable and safe pace to a line on the floor 3 m away, turning and walking back to the chair and siting down again [19].
Detection of pathogenic mutation of OI patients
Genetic mutations of OI patients were identified by a targeted next-generation sequencing (NGS) panel (Illumina HiSeq2000 platform, Illumina, Inc., San Diego, CA, USA) which was previously described in detail [20]. Twenty known candidate genes of OI were covered in this panel, including COL1A1, COL1A2, IFITM5, WNT1, SERPINF1, FKBP10, CRTAP, SERPINH1, SP7, BMP1, PLS3, TMEM38B, PLOD2, P3H1, P4HB, PPIB, SEC24D, SPARC, CREB3L1, and MBTPS2. The genomic DNA from OI patients were fragmented and ligated with end-repaired adaptors oligonucleotides. Then DNA fragments with adaptor molecules were purified and enriched by polymerase chain reaction (PCR). The candidate gene mutations identified by NGS were further confirmed by PCR and Sanger sequence.
Statistical analysis
Continuous data of normal distribution (age, height, weight, BMI, eGFR, BMD, serum levels of LCN2, FBG, TC, TG, HDL-C, LDL-C, Ca, P, ALP, β-CTX, and Cr) were expressed as mean ± standard deviation (SD), while those of abnormal distribution (times of fracture, HOMA-IR, HOMA-β, serum levels of insulin, 25OHD, PTH, and ALT) were presented as median (quartiles). Categorical data were expressed as the number and percentage (%). The independent sample T test and the analysis of variance (ANOVA) were utilized to compare continuous data of normal distribution. Continuous data of abnormal distribution were analyzed by the Mann–Whitney U test and Kruskal–Wallis test for two groups or more groups. The Chi-squared test and Fisher’s test were used to analyze categorical variables. Relationships between the serum LCN2 levels and parameters of glycolipid metabolism were analyzed by the Spearman correlation. Multiple linear regression models were used for adjustments of age, gender, 25OHD, eGFR, ambulatory status, OC, and clinical classifications.
Statistical analyses were performed using the Statistical Package for Windows (version 20.0; SPSS Inc., Chicago, IL, USA). It was considered as significance if P value was less than 0.05.
Results
General characteristics and LCN2 levels of OI patients
A total of 204 OI children with mean age of 8.0 ± 4.6 years and 66 healthy children with age of 8.5 ± 3.6 years were included in this study. OI children had higher BMI and BMI SDS, more percentage of overweight and obesity, and higher serum FBG and OC levels, with lower HDL-C levels than control group (P < 0.05, Table 1).
Table 1.
Metabolic disorder in OI children and healthy control
| OI patients | Healthy control | P value | |
|---|---|---|---|
| (n = 204) | (n = 66) | ||
| Male, n (%) | 145 (71.1%) | 44 (66.7%) | 0.497 |
| Age (y) | 8.0 ± 4.6 | 8.5 ± 3.6 | 0.461 |
| Height (cm) | 119.4 ± 28.1 | 133.0 ± 20.3 | < 0.001 |
| Height SDS | − 1.7 ± 2.6 | 0.5 ± 1.3 | < 0.001 |
| Weight (kg) | 29.0 ± 16.2 | 32.4 ± 12.7 | 0.081 |
| Weight SDS | − 0.2 ± 1.6 | 0.7 ± 1.1 | < 0.001 |
| BMI (kg/m2) | 18.8 ± 3.9 | 17.6 ± 2.5 | 0.004 |
| BMI SDS | 1.15 ± 1.87 | 0.55 ± 1.63 | 0.013 |
| Overweight, n (%) | 10 (4.9%) | 1 (1.5%) | 0.011 |
| Obese, n (%) | 38 (18.6%) | 4 (6.1%) | 0.014 |
| FBG (mmol/L) | 5.07 ± 0.39 | 4.87 ± 0.42 | 0.001 |
| Insulin (μIU/mL) | 9.00 (6.00, 14.50) | 7.35 (4.78, 12.95) | 0.243 |
| HOMA-IR | 2.00 (1.34, 3.38) | 1.53 (1.01, 2.80) | 0.156 |
| HOMA-β (%) | 118.33 (80.00, 187.69) | 117.50 (80.52, 170.63) | 0.464 |
| TC (mmol/L) | 4.21 ± 0.79 | 4.28 ± 0.68 | 0.520 |
| TG (mmol/L) | 0.83 ± 0.45 | 0.78 ± 0.51 | 0.492 |
| HDL-C (mmol/L) | 1.04 ± 0.26 | 1.43 ± 0.29 | < 0.001 |
| LDL-C (mmol/L) | 2.23 ± 0.57 | 2.25 ± 0.57 | 0.802 |
| LCN2 (ng/ml) | 37.65 ± 23.48 | 69.18 ± 35.43 | < 0.001 |
| OC (ng/ml) | 24.15 ± 10.82 | 28.32 ± 11.58 | 0.020 |
| ALT (IU/L) | 14.0 (11.0, 18.0) | 13.0 (11.0, 17.0) | 0.608 |
| Cr (μmol/L) | 35.8 ± 12.3 | 47.8 ± 13.2 | < 0.001 |
| eGFR (ml/min/1.73 m2) | 173.8 ± 41.2 | 150.1 ± 28.2 | < 0.001 |
Bold values indicated that there was a significant difference between two groups
OI osteogenesis imperfecta, BMI body mass index, SDS standard deviation score, FBG fasting blood glucose, HOMA-IR homeostasis model assessment insulin resistance, HOMA-β homeostasis model assessment islet beta cell function, TG triglyceride, TC total cholesterol, HDL-C high-density lipoprotein cholesterol, LDL-C low-density lipoprotein cholesterol, LCN2 lipocalin 2, OC osteocalcin, ALT alanine aminotransferase, Cr creatinine, eGFR estimated glomerular filtration rate
Serum LCN2 levels were 37.65 ± 23.48 ng/ml in OI children, which was significantly lower than those in control group (69.18 ± 35.43 ng/ml, P < 0.001). Serum LCN2 levels were similar between OI boys (36.47 ± 21.94 ng/ml) and OI girls (40.56 ± 26.89 ng/ml, P = 0.214).
Association of LCN2 levels, metabolic abnormalities, and clinical severity of OI patients
According to the clinical severity [21, 22], OI patients were classified as OI-type I, type III, type IV, and type V. OI-type III children had significantly lower LCN2 levels (26.23 ± 14.83 ng/mL) than children with type I (39.14 ± 23.29 ng/mL) and type IV OI (39.59 ± 23.89 ng/mL) (Fig. 1a, Table 2). Patients with OI-type III had higher BMI than type IV OI patients (P < 0.05), and significantly higher FBG levels than OI-type I and IV patients. HOMA-IR, HOMA-β, levels of TC, LDL-C, HDL-C, and TG had no differences among patients with OI-type I, III, and IV. These results indicated that the more severe of OI, the lower LCN2 levels, and the more obvious metabolic disorder.
Fig. 1.

Serum LCN2 levels with different clinical and genotypic classifications of OI children. a Serum LCN2 levels with different clinical severity of OI children. b Serum LCN2 levels with different genotypes of OI children. *P < 0.05
Table 2.
Metabolic disorder in OI children with different clinical severity
| Total OI patients | OI-type I | OI-type III | OI-type IV | P value | |
|---|---|---|---|---|---|
| (n = 204) | (n = 84) | (n = 36) | (n = 78) | ||
| Male, n (%) | 151 (67.1%) | 64 (66.7%)a | 21 (58.3%)a,c | 62 (76.5%)c | 0.048 |
| Age (y) | 8.0 ± 4.7 | 8.8 ± 4.5 | 7.4 ± 4.6 | 7.9 ± 4.6 | 0.249 |
| Height (cm) | 119.6 ± 27.9 | 128.3 ± 28.3a,b | 101.9 ± 24.9a,c | 119.5 ± 25.5b,c | < 0.001 |
| Height Z-score | − 1.6 ± 2.6 | − 0.9 ± 1.9a | − 4.0 ± 3.8a,c | − 1.6 ± 2.0c | < 0.001 |
| Weight (kg) | 29.0 ± 16.1 | 33.4 ± 17.2a,b | 22.0 ± 12.2a,c | 28.4 ± 15.7b,c | 0.087 |
| Weight Z-score | − 0.1 ± 1.5 | 0.3 ± 1.5a,b | − 1.4 ± 1.9a,c | − 0.3 ± 1.1b,c | < 0.001 |
| BMI (kg/m2) | 18.7 ± 4.0 | 18.8 ± 3.7 | 19.9 ± 4.8c | 18.4 ± 3.6c | 0.154 |
| BMI SDS | 1.15 ± 1.87 | 1.20 ± 1.80 | 1.23 ± 1.71 | 1.08 ± 1.86 | 0.880 |
| Overweight, n (%) | 10 (4.9%) | 7 (8.3%) | 2 (5.6%) | 1 (1.2%) | 0.121 |
| Obese, n (%) | 38 (18.6%) | 12 (16.7%) | 11 (30.6%) | 14 (17.3%) | 0.109 |
| Nonambulatory, n (%) | 78 (38.2%) | 14 (14.3%)a,b | 29 (80.6%)a,c | 35 (43.2%)b,c | < 0.001 |
| Number of fractures | 4.0 (3.0, 7.0) | 3.0 (2.0, 5.0)a,b | 10.0 (4.3, 20.0)a,c | 5.0 (3.8, 6.0)b,c | < 0.001 |
| Ca (mmol/L) | 2.46 ± 0.20 | 2.47 ± 0.09 | 2.48 ± 0.11 | 2.43 ± 0.30 | 0.427 |
| P (mmol/L) | 1.66 ± 0.20 | 1.69 ± 0.20 | 1.68 ± 0.21 | 1.64 ± 0.19 | 0.251 |
| ALP (U/L) | 285.7 ± 103.3 | 302.6 ± 106.2a | 246.5 ± 84.6a | 280.4 ± 93.9 | 0.018 |
| β-CTX (ng/ml) | 0.86 ± 0.36 | 0.91 ± 0.37a | 0.67 ± 0.32a | 0.85 ± 0.34 | 0.044 |
| 25OHD (ng/ml) | 21.2 (13.7, 31.6) | 21.4 (16.1, 31.5) | 25.5 (17.2, 39.3) | 22.3 (15.4, 27.8) | 0.456 |
| PTH (ng/ml) | 21.2 (13.7, 31.6) | 22.9 (17.7, 32.8)a | 17.4 (10.5, 25.6)a | 19.2 (11.1, 32.7) | 0.036 |
| ALT (U/L) | 14.0 (11.0, 18.0) | 14.0 (11.3, 19.0)a | 12.0 (9.0, 16.0)a,c | 14.0 (11.0, 19.0)c | 0.054 |
| Cr (μmol/L) | 35.8 ± 12.3 | 38.7 ± 12.3a,b | 33.1 ± 11.0a | 34.6 ± 12.6b | 0.038 |
| eGFR (ml/min/1.73m2) | 173.8 ± 41.2 | 174.2 ± 37.8a | 157.6 ± 48.2a,c | 190.7 ± 39.8c | 0.025 |
| FBG (mmol/L) | 5.07 ± 0.39 | 5.00 ± 0.35a | 5.27 ± 0.41a,c | 5.04 ± 0.39c | 0.002 |
| Insulin (μIU/mL) | 9.00 (6.00, 14.50) | 7.90 (4.30, 13.80) | 9.00 (7.40, 12.80) | 10.50 (5.40, 17.90) | 0.148 |
| HOMA-IR | 2.00 (1.34, 3.38) | 1.79 (1.03, 3.16) | 2.08 (1.68, 3.22) | 2.36 (1.22, 4.03) | 0.157 |
| HOMA-β (%) | 118.33 (80.00, 187.69) | 109.23 (66.32, 181.25) | 111.43 (92.50, 155.56) | 142.35 (76.47, 250.00) | 0.099 |
| TC (mmol/L) | 4.21 ± 0.79 | 4.14 ± 0.86 | 4.11 ± 0.65 | 4.31 ± 0.79 | 0.365 |
| TG (mmol/L) | 0.83 ± 0.45 | 0.82 ± 0.48 | 0.80 ± 0.39 | 0.85 ± 0.46 | 0.848 |
| HDL-C (mmol/L) | 1.04 ± 0.26 | 1.03 ± 0.26 | 1.07 ± 0.25 | 1.03 ± 0.26 | 0.795 |
| LDL-C (mmol/L) | 2.23 ± 0.57 | 2.19 ± 0.59 | 2.12 ± 0.41 | 2.33 ± 0.61 | 0.170 |
| LCN2 (ng/ml) | 37.65 ± 23.48 | 39.14 ± 23.29a | 26.23 ± 14.83a,c | 39.59 ± 23.89c | 0.007 |
| OC (ng/ml) | 24.15 ± 10.82 | 25.93 ± 10.51a | 17.84 ± 9.29a,c | 24.95 ± 11.04c | 0.001 |
| LS BMD (g/cm2) | 0.467 ± 0.199 | 0.547 ± 0.190a,b | 0.341 ± 0.170a,c | 0.448 ± 0.178b,c | < 0.001 |
| LS BMD Z-score | − 2.2 ± 2.1 | − 1.4 ± 1.8a,b | − 3.4 ± 2.1a | − 2.6 ± 1.9b | < 0.001 |
| FN BMD (g/cm2) | 0.427 ± 0.188 | 0.517 ± 0.190a,b | 0.285 ± 0.160a,c | 0.396 ± 0.146b,c | < 0.001 |
| FN BMD Z-score | − 3.7 ± 2.3 | − 2.7 ± 2.0a,b | − 5.3 ± 2.8a,c | − 4.2 ± 1.9b,c | < 0.001 |
| Troch BMD (g/cm2) | 0.349 ± 0.194 | 0.415 ± 0.204a,b | 0.268 ± 0.187a | 0.315 ± 0.163b | < 0.001 |
| TH BMD (g/cm2) | 0.471 ± 0.208 | 0.550 ± 0.223a,b | 0.350 ± 0.186a,c | 0.433 ± 0.163b,c | < 0.001 |
OI osteogenesis imperfecta, BMI body mass index, SDS standard deviation score, Ca calcium, P phosphate, ALP alkaline phosphatase, β-CTX β cross-linked carboxy-terminal telopeptide of type I, 25OHD 25-hydroxyvitamin D, PTH parathyroid hormone, FBG fasting blood glucose, HOMA-IR homeostasis model assessment insulin resistance, HOMA-β homeostasis model assessment islet beta cell function, TG triglyceride, TC total cholesterol, HDL-C high-density lipoprotein cholesterol, LDL-C low-density lipoprotein cholesterol, LCN2 lipocalin 2, OC osteocalcin, ALT alanine aminotransferase, Cr creatinine, eGFR estimated glomerular filtration rate, LS lumbar spine, FN femoral neck, Troch trochanter, TH total hip, BMD bone mineral density
Bold values indicated that there was a significant difference among three groups
aP < 0.05 for comparison between OI-type I and OI-type III; bP < 0.05 for comparison between OI-type I and OI-type IV; cP < 0.05 for comparison between OI-type III and OI-type IV
Association of LCN2 levels and metabolic abnormalities with genotypes of OI patients
According to the inheritance pattern of pathogenic gene mutation, OI patients were divided into autosomal dominant (AD) inheritance, including COL1A1, COL1A2, IFITM5 mutation, and the autosomal recessive (AR) inheritance, including mutations of FKBP10, WNT1, TMEM38B, PLOD2, SERPINF1, BMP1, P3H1, SERPINH1, and CRTAP. Since the patients with autosomal recessive inheritance were quite few, we summarize them into one group.
There was no significant difference in proportion of overweight or obesity, and serum levels of FBG, FINS, HOMA-IR, HOMA-β, TG, TC, LDL-C, and HDL-C among COL1A1, COL1A2, IFITM5, and the autosomal recessive (AR) gene mutation group (Table 3). However, children with IFITM5 mutation had significantly higher serum LCN2 levels (60.1 ± 37.6 ng/mL) than the other gene mutation groups (P < 0.05). Children with COL1A1 mutation had higher LCN2 levels (39.5 ± 25.1 ng/mL) than children with AR gene mutations (P < 0.05) (Fig. 1b, Table 3).
Table 3.
Metabolic disorder in OI children with different genotypes
| COL1A1 | COL1A2 | IFITM5 | AR | P value | |
|---|---|---|---|---|---|
| (n = 117) | (n = 60) | (n = 6) | (n = 21) | ||
| Male, n (%) | 83 (70.9%) | 44 (73.3%) | 3 (50.0%) | 15 (71.4%) | 0.694 |
| Age (y) | 8.0 ± 4.5b | 8.4 ± 4.7d | 3.7 ± 2.5b,d,f | 8.2 ± 5.0f | 0.123 |
| Height (cm) | 122.5 ± 27.5b | 116.0 ± 28.4 | 97.2 ± 16.8b | 117.8 ± 30.7 | 0.103 |
| Height Z-score | − 1.2 ± 2.4a | − 2.6 ± 2.7a | − 0.6 ± 1.9 | − 2.3 ± 3.0 | 0.003 |
| Weight (kg) | 30.1 ± 16.9b | 27.9 ± 15.0 | 16.8 ± 8.5b | 29.3 ± 16.6 | 0.236 |
| Weight Z-score | 0.0 ± 1.6a | − 0.6 ± 1.6a | − 0.5 ± 1.7 | − 0.5 ± 1.3 | 0.048 |
| BMI (kg/m2) | 18.5 ± 3.8 | 19.2 ± 3.8 | 17.0 ± 5.3 | 19.7 ± 4.3 | 0.306 |
| BMI SDS | 0.99 ± 1.77 | 1.35 ± 1.88 | 0.86 ± 3.80 | 1.57 ± 1.68 | 0.428 |
| Overweight, n (%) | 8 (6.8%) | 1 (1.7%) | 0 (0) | 1 (4.8%) | 0.458 |
| Obese, n (%) | 20 (17.1%) | 11 (18.3%) | 1 (16.7%) | 6 (28.6%) | 0.666 |
| Nonambulatory, n (%) | 37 (31.6%)a | 29 (48.3%)a,e | 1 (16.7%) | 11 (52.4%)e | 0.155 |
| Number of fractures | 4.0 (3.0, 6.0)a | 5.0 (3.0, 8.0)a | 3.0 (1.8, 6.3) | 4.0 (2.0, 8.5) | 0.111 |
| Ca (mmol/L) | 2.45 ± 0.25 | 2.47 ± 0.12 | 2.48 ± 0.11 | 2.46 ± 0.14 | 0.897 |
| P (mmol/L) | 1.66 ± 0.19b | 1.70 ± 0.23d | 1.44 ± 0.15b,d,f | 1.62 ± 0.15f | 0.011 |
| ALP (U/L) | 304.3 ± 107.4a | 244.8 ± 72.8a,d | 343.8 ± 197.8d | 281.8 ± 89.4 | 0.002 |
| β-CTX (ng/ml) | 0.87 ± 0.32a,c | 0.71 ± 0.32a,e | 0.89 ± 0.34 | 1.08 ± 0.52c,e | 0.006 |
| 25OHD (ng/ml) | 21.6 (15.3, 30.3) | 22.8 (15.8, 27.1) | 24.1 (15.1, 35.6) | 25.4 (16.2, 34.9) | 0.67 |
| PTH (ng/ml) | 21.4 (14.0, 31.0) | 21.0 (12.1, 34.4) | 16.9 (12.6, 34.1) | 21.2 (14.2, 52.8) | 0.931 |
| ALT (U/L) | 14.0 (11.0, 18.0) | 14.0 (11.0, 18.5) | 12.5 (9.5, 21.3) | 14.0 (9.0, 23.0) | 0.884 |
| Cr (μmol/L) | 36.0 ± 11.2 | 36.1 ± 14.1 | 27.0 ± 4.8 | 36.5 ± 13.7 | 0.364 |
| eGFR (ml/min/1.73m2) | 175.6 ± 40.2 | 171.8 ± 43.1 | 174.4 ± 44.3 | 168.7 ± 42.9 | 0.884 |
| FBG (mmol/L) | 5.02 ± 0.40 | 5.10 ± 0.37 | 5.23 ± 0.51 | 5.20 ± 0.38 | 0.165 |
| Insulin (μIU/mL) | 9.00 (5.35, 16.60) | 9.45 (6.43, 13.05) | 7.80 (4.53, 25.70) | 9.75 (7.63, 15.65) | 0.777 |
| HOMA-IR | 1.93 (1.17, 3.53) | 2.12 (1.44, 3.23) | 1.80 (1.04, 6.42) | 2.25 (1.70, 3.61) | 0.751 |
| HOMA-β (%) | 123.08 (75.51, 192.12) | 113.62 (80.56, 181.54) | 103.75 (70.70, 243.79) | 130.00 (85.63, 212.91) | 0.729 |
| TC (mmol/L) | 4.20 ± 0.75 | 4.24 ± 0.93 | 4.26 ± 0.67 | 4.17 ± 0.65 | 0.984 |
| TG (mmol/L) | 0.82 ± 0.44 | 0.88 ± 0.52 | 0.84 ± 0.38 | 0.73 ± 0.29 | 0.666 |
| HDL-C (mmol/L) | 1.06 ± 0.27 | 1.03 ± 0.23 | 1.14 ± 0.34 | 0.99 ± 0.27 | 0.652 |
| LDL-C (mmol/L) | 2.25 ± 0.55 | 2.21 ± 0.67 | 2.06 ± 0.34 | 2.21 ± 0.40 | 0.878 |
| LCN2 (ng/ml) | 39.7 ± 24.8b,d | 34.6 ± 19.6e | 60.1 ± 37.6b,e,f | 28.3 ± 11.5d,f | 0.012 |
| OC (ng/ml) | 24.73 ± 10.42 | 22.62 ± 8.76 | 26.04 ± 9.45 | 24.68 ± 17.47 | 0.634 |
| LS BMD (g/cm2) | 0.494 ± 0.194 | 0.441 ± 0.206 | 0.360 ± 0.157 | 0.425 ± 0.205 | 0.122 |
| LS BMD Z-score | − 1.9 ± 1.9c | − 2.5 ± 2.0 | − 2.8 ± 2.5 | − 3.3 ± 2.5c | 0.022 |
| FN BMD (g/cm2) | 0.457 ± 0.181a | 0.374 ± 0.183a | 0.438 ± 0.162 | 0.405 ± 0.220 | 0.047 |
| FN BMD Z-score | − 3.3 ± 2.1a | − 4.5 ± 2.5a | − 2.7 ± 2.6 | − 4.1 ± 2.6 | 0.01 |
| Troch BMD (g/cm2) | 0.363 ± 0.195 | 0.316 ± 0.175 | 0.304 ± 0.158 | 0.370 ± 0.245 | 0.437 |
| TH BMD (g/cm2) | 0.495 ± 0.206 | 0.435 ± 0.196 | 0.478 ± 0.167 | 0.438 ± 0.259 | 0.309 |
Bold values indicated that there was a significant difference among four groups
AR autosomal recessive, BMI body mass index, SDS standard deviation score, Ca calcium, P phosphate, ALP alkaline phosphatase, β-CTX β cross-linked carboxy-terminal telopeptide of type I, 25OHD 25-hydroxyvitamin D, PTH parathyroid hormone, FBG fasting blood glucose, HOMA-IR homeostasis model assessment insulin resistance, HOMA-β homeostasis model assessment islet beta cell function, TG triglyceride, TC total cholesterol, HDL-C high-density lipoprotein cholesterol, LDL-C low-density lipoprotein cholesterol, LCN2 lipocalin 2, OC osteocalcin, ALT alanine aminotransferase, Cr creatinine, eGFR estimated glomerular filtration rate, LS lumbar spine, FN femoral neck, Troch trochanter, TH total hip, BMD bone mineral density
aP < 0.05 for comparison between COL1A1 and COL1A2 mutation; bP < 0.05 for comparison between COL1A1 and IFITM5 mutation; cP < 0.05 for comparison between COL1A1 mutation and AR group. dP < 0.05 for comparison between COL1A2 and IFITM5 mutation. eP < 0.05 for comparison between COL1A2 mutation and AR group. fP < 0.05 for comparison between IFITM5 mutation and AR group
Association of LCN2 levels and glycolipid metabolic parameters, body composition, and muscle function
Serum LCN2 levels were negatively correlated with age, BMI, and serum levels of FBG and insulin, HOMA-IR, and HOMA-β of OI children (Fig. 2, Table 4). Our previous study has found that osteocalcin had a close relationship with glycolipid metabolism in OI children [23]. Thus, when we analyzed the relationship between glucolipid metabolism parameters and LCN2, we adjusted age, gender, OC levels, 25OHD levels, eGFR, ambulatory status, and clinical classifications, and the negative correlation between levels of LCN2 with BMI, serum insulin levels, and HOMA-β remained (Supplementary Table 1).
Fig. 2.

Correlation of serum LCN2 levels and glucose metabolic parameters in OI children. a Correlation of serum LCN2 levels and fasting blood glucose (FBG) in OI children. b Correlation of serum LCN2 levels and body mass index (BMI) in OI children. c Correlation of serum LCN2 levels and HOMA-IR in OI children. d Correlation of serum LCN2 levels and HOMA-β in OI children
Table 4.
The correlation of LCN2 levels and metabolic parameters in OI children
| LCN2 | ||
|---|---|---|
| r | P value | |
| Gender | 0.053 | 0.448 |
| Age | − 0.202 | 0.004 |
| BMI | − 0.530 | < 0.001 |
| FBG | − 0.232 | 0.001 |
| Insulin | − 0.254 | 0.001 |
| HOMA-IR | − 0.271 | < 0.001 |
| HOMA-β | − 0.181 | 0.015 |
| TC | − 0.053 | 0.475 |
| LDL-C | − 0.121 | 0.102 |
| HDL-C | 0.118 | 0.111 |
| TG | − 0.067 | 0.368 |
| Ambulatory status | − 0.265 | < 0.001 |
| Clinical classification | 0.034 | 0.626 |
| Times of fracture | − 0.059 | 0.398 |
| ALP | 0.197 | 0.005 |
| β-CTX | 0.171 | 0.036 |
| OC | 0.347 | < 0.001 |
| 25OHD | 0.048 | 0.584 |
| PTH | 0.051 | 0.533 |
| LS BMD | − 0.029 | 0.677 |
| FN BMD | 0.018 | 0.798 |
| Troch BMD | − 0.013 | 0.861 |
| TH BMD | 0.019 | 0.795 |
| LS BMD Z-score | 0.038 | 0.593 |
| FN BMD Z-score | 0.102 | 0.148 |
| Cr | − 0.082 | 0.251 |
| eGFR | 0.038 | 0.594 |
LCN2 lipocalin 2, BMI body mass index, FBG fasting blood glucose, HOMA-IR homeostasis model assessment insulin resistance, HOMA-β homeostasis model assessment islet beta cell function, ALP alkaline phosphatase, β-CTX β cross-linked carboxy-terminal telopeptide of type I, 25OHD 25-hydroxyvitamin D, PTH parathyroid hormone, FBG fasting blood glucose, HOMA-IR homeostasis model assessment insulin resistance, HOMA-β homeostasis model assessment islet beta cell function, TG triglyceride, TC total cholesterol, HDL-C high-density lipoprotein cholesterol, LDL-C low-density lipoprotein cholesterol, LCN2 lipocalin 2, OC osteocalcin, ALT alanine aminotransferase, Cr creatinine, eGFR estimated glomerular filtration rate, LS lumbar spine, FN femoral neck, Troch trochanter, TH total hip, BMD bone mineral density. Bold values indicated that the correlation was significantly different
Body composition, the grip strength, and TUG test of 16 OI patients with age of 8.5 ± 3.6 years were measured. OI children had significantly lower grip strength and longer TUG than healthy children (Fig. 3, P < 0.05). We found that 1 (6.3%) and 10 (62.5%) patients had slightly-to-moderately or severely increased %FM, respectively. Serum LCN2 levels were positively correlated with total body and appendicular %LM, but negatively correlated to %FM and FMI of total body and trunk in OI children (Table 5). Serum LCN2 levels were uncorrelated to grip strength and TUG of OI children.
Fig. 3.
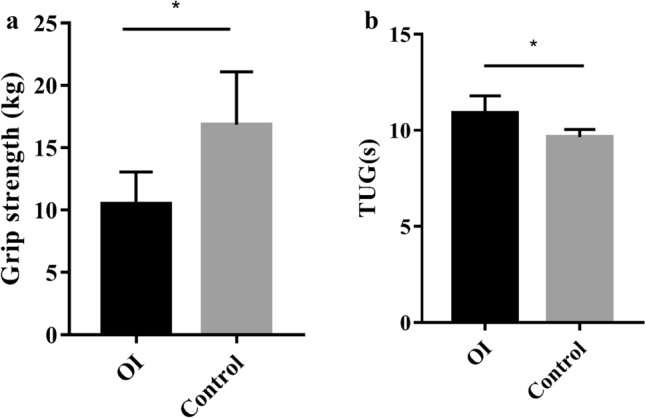
Muscle strength and function in OI children and healthy controls. a Grip strength in OI children and healthy controls. b Timed-up-and-go (TUG) test in OI children and healthy controls. *P < 0.05
Table 5.
The correlation between LCN2 levels with muscle parameters and body composition in OI children
| LCN2 | ||
|---|---|---|
| r | P value | |
| Grip strength | 0.209 | 0.473 |
| TUG | 0.143 | 0.736 |
| Total body LM (kg) | − 0.332 | 0.208 |
| Total body LM% | 0.662 | 0.005 |
| Total body LMI | − 0.126 | 0.641 |
| Appendicular LM (kg) | − 0.474 | 0.064 |
| Appendicular LM (%) | 0.656 | 0.006 |
| Appendicular LMI | − 0.538 | 0.031 |
| Total body FM (kg) | − 0.479 | 0.060 |
| Total body FM% | − 0.656 | 0.006 |
| Total body FMI | − 0.674 | 0.004 |
| Trunk FM (kg) | − 0.471 | 0.066 |
| Trunk FM% | − 0.653 | 0.006 |
| Trunk FMI | − 0.594 | 0.015 |
| Trunk/limb fat mass ratio | − 0.221 | 0.412 |
TUG timed-up-and-go, LM lean mass, LMI lean mass index, FM fat mass, FMI fat mass index. Bold values indicated that the correlation was significantly different
Discussion
As LCN2 was recently identified as a critical bone-derived regulator of appetite, which was essential in regulating feeding behaviors and energy homeostasis, we examined serum LCN2 levels and analyzed its relationship with glycolipid metabolism and body composition for the first time in a relatively large cohort of OI children. We found that circulating LCN2 levels were significantly lower in OI children than in healthy children. We also found that the proportion of obesity and overweight, impaired glucose tolerance, and insulin resistance were significantly higher in OI children than in healthy children. More importantly, we observed for the first time that serum LCN2 levels were negatively correlated to BMI, FBG levels, HOMA-IR, HOMA-β, total body, and trunk fat mass percentage, and positively correlated to total body and appendicular lean mass percentage of OI children.
In this study, we found that the more severe the OI patient's clinical phenotype, the higher BMI they had, which was consistent with the previous findings [6, 7]. In a large North American cohort of OI children and adults, type III OI patients had higher BMI than type I and type IV OI patients [6]. Another study indicated that patients with type I and type III OI had higher FM% than normal controls [7]. These results suggested that the clinical severity of OI was closely correlated to a higher BMI and fat content of the body [7, 24]. In our study, we did not find that the pathogenic gene mutations were associated with OI children's body composition. However, we found that patients with IFITM5 mutation had higher LCN2 levels than patients carrying other gene mutations, and the exact mechanism deserved further investigated.
As we know, obesity is an important risk factor for insulin resistance, diabetes, hypertension, hyperlipidemia, and atherosclerosis, and even higher mortality [25, 26]. We found that OI children had a higher proportion of obesity, overweight, and insulin resistance than normal children. BMI and serum FBG levels were also significantly higher and HDL-C levels were obviously lower in OI patients than in healthy controls. Previously, repeated fracture, bone deformation, and reduced activities were considered as the main causes of overweight and obesity in OI patients [24]. However, we found that the BMI was not correlated to the ambulatory status of OI patients in this study. This indicated that there could be other mechanisms involved in overweight, obesity, and metabolic disorders of OI patients.
On the other hand, in a relatively large sample study, lower muscle cross-sectional area was found in children and adolescents with OI-type I and type III than in healthy controls [27]. However, no correlation was found in the cross-sectional area of fat or muscle between OI patients with COL1A1 and COL1A2 mutations [27]. Likewise, we did not find that the pathogenic gene mutations were associated with OI children's body composition. Moreover, more and more studies indicated that the volume and strength of muscle were significantly reduced in OI patients [9, 28]. In this study, lower grip strength and longer TUG were found in OI children than in normal controls, which suggested that the muscle function of OI patients was weakened [8]. The mechanism of body composition changes and muscle dysfunction was also worth investigating in patients with OI.
In recent years, more and more evidence has shown that bone was also an endocrine organ, with osteoblasts and osteoblasts secreting bioactive factors with endocrine functions [29, 30]. It was previously thought that LCN2 was secreted mainly by adipose tissue, but recent studies have found that LCN2 was secreted by osteoblasts and its expression level in bone is at least tenfold higher than that in adipose tissue [1]. An important new function of bone was identified as regulation of food intake through osteogenic LCN2. Previous studies demonstrated that genetically or diet-induced obese animals had upregulated Lcn2 gene expression in adipose tissue and liver [31, 32]. On the contrary, several studies showed that Lcn2 knock out mice gained more weight, developed dyslipidemia and insulin resistance with high-fat diet compared to their wild-type littermates [33, 34]. In mice with osteoblast specific knockout Lcn2 gene (Lcn2 osb−/−), serum levels of LCN2 were decreased by 67%, and impaired glucose tolerance, insulin resistance, and increased body weight, fat mass, and food intake was observed after glucose loading [1]. LCN2 was able to cross the blood brain barrier and binds to MC4R, thus played roles on the hypothalamus in primates, which could suppress food intake and reduce body weight [35, 36]. LCN2 was also described for playing roles in numerous processes, and increased hepatic gluconeogenesis and inflammatory state were found in LCN2-deficient mice [37]. In this study, we found that that serum LCN2 levels were significantly lower in OI children than in healthy children. We also found that serum LCN2 levels were negatively correlated to BMI, FBG levels, HOMA-IR, HOMA-β, total body, and trunk fat mass percentage, and positively correlated to total body and appendicular lean mass percentage of OI children. Therefore, we speculated that OI patients could had insufficient secretion of LCN2 from bone, which could increase food intake and then increase the risk of obesity and disorders of glucose metabolism. However, the mechanism of abnormal bone secretion of LCN2 in patients with OI is worthy of in-depth study.
Furthermore, the muscle strength and function were impaired in OI patients of this study, of which the disuse was previously considered as the main reason. A recent study indicated that serum LCN2 levels were increased following acute high‐intensity exercise [38]. The Wnt pathway antagonist, DKK1, and cytokine interleukin 6 were also increased after running, which not only played an important role in regulating muscle volume and muscle function, but also were positively correlated to LCN2 level. Besides, DKK1, RANKL, and TNF-α played key roles in regulating bone cell activity of subjects with OI [39]. Lcn2−/− mice exhibited smaller muscle fibers, delayed muscle regeneration after injury, and impaired clearance of fibrous tissue from regenerated muscle, suggesting a novel role for LCN2 in regulating muscle satellite cell activation and skeletal muscle repair [38]. In this study, serum LCN2 level was positively correlated to total body and appendicular lean mass percentage of OI patients; therefore, we deduced that LCN2 may have a certain effect on muscle metabolism.
Thus, obesity, fasting hyperglycemia, insulin resistance, and decreased muscle strength were common comorbidities in OI children, which indicated that bones had important endocrine functions and there was a close crosstalk between bone, muscle, and adipose tissue. We speculated that OI led to reduced secretion of LCN2, which induce appetite increase and excess energy intake through regulating the activity of feeding center of hypothalamus, then leading to obesity, insulin resistance, hyperglycemia, hyperlipidemia, and muscle dysfunction. However, the present study had several limitations. This was a cross-sectional study, which made it difficult to establish a causal relationship between LCN2 levels and glycolipid metabolism and muscle function changes in OI patients. The information about the pubertal status and energy intake was not collected in OI children, which could play roles in glycolipid metabolism, body composition, peak bone mass, and peak muscle mass. Serum adipokines (such as asprosin and leptin) also played key roles in feeding behaviors and energy homeostasis and is important in the crosstalk between bone–muscle–pancreas–adipose tissues. We did not detect serum adipokines levels in OI patients, which was one of the limitations of this study. Moreover, body composition and muscle functions were measured only in a few OI patients of this study. Furthermore, we found that children with IFITM5 mutation had significantly higher serum LCN2 levels than other gene mutation groups, and children with COL1A1 mutation had higher LCN2 levels than children with autosomal recessive gene mutations, but the effects of different pathogenic gene mutations of OI on LCN2 secretion were still unknown.
In conclusion, obesity or overweight, insulin resistance, hyperglycemia, and sarcopenia are common comorbidity of OI children, of which circulating LCN2 deficiency may be closely relevant to these disorders, which indicates that bone may play an important role in regulating glycolipid metabolism and body composition through LCN2. Further studies on how LCN2 functions under different bone diseases are of great importance, and precise role of LCN2 in the pathogenesis of metabolic and muscular disorders will pave the way for novel therapies targeting LCN2.
Supplementary Information
Below is the link to the electronic supplementary material.
Acknowledgements
We appreciate the patients with OI and the healthy controls for their participation in this study.
Authors' contributions
WBZ carried out the biochemical analysis, collected the clinical data from the patients, analyzed data, and wrote the manuscript. JH, SL, and JYL contributed to data collection and blood sample collection. QZ, OW, YJ, WBX, and XPX contributed to review the manuscript. ML contributed to the conception and design of the research, acquisition, and interpretation of the data, and revised the manuscript.
Funding
This work was supported by National Key R&D Program of China (2018YFA0800801, 2021YFC2501704), CAMS Innovation Fund for Medical Sciences (CIFMS) (2021-I2M-C&T-B-007, 2021-I2M-1-051), National Natural Science Foundation of China (Nos. 81873668, 82070908), and Beijing Natural Science Foundation (7202153).
Data availability
The data supporting the findings of the study are available from the corresponding author upon reasonable request.
Declarations
Conflict of interest
The authors have no relevant financial or non-financial interests to disclose.
Research involving human participants and/or animals
The study was approved by the Scientific Ethics Committee of PUMCH (JS-2081).
Informed consent
The legal guardians of OI patients and the normal controls provided written informed consents before they participated in this study.
Footnotes
Publisher's Note
Springer Nature remains neutral with regard to jurisdictional claims in published maps and institutional affiliations.
References
- 1.Mosialou I, Shikhel S, Liu JM, Maurizi A, Luo N, He Z, Huang Y, Zong H, Friedman RA, Barasch J, Lanzano P, Deng L, Leibel RL, Rubin M, Nickolas T, Chung W, Zeltser LM, Williams KW, Pessin JE, Kousteni S. MC4R-dependent suppression of appetite by bone-derived lipocalin 2. Nature. 2017;543(7645):385–390. doi: 10.1038/nature21697. [DOI] [PMC free article] [PubMed] [Google Scholar]
- 2.Mosialou I, Shikhel S, Luo N, Petropoulou PI, Panitsas K, Bisikirska B, Rothman NJ, Tenta R, Cariou B, Wargny M, Sornay-Rendu E, Nickolas T, Rubin M, Confavreux CB, Kousteni S. Lipocalin-2 counteracts metabolic dysregulation in obesity and diabetes. J Exp Med. 2020 doi: 10.1084/jem.20191261. [DOI] [PMC free article] [PubMed] [Google Scholar]
- 3.Tournis S, Dede AD. Osteogenesis imperfecta—a clinical update. Metabolism. 2018;80:27–37. doi: 10.1016/j.metabol.2017.06.001. [DOI] [PubMed] [Google Scholar]
- 4.Marom R, Rabenhorst BM, Morello R. Osteogenesis imperfecta: an update on clinical features and therapies. Eur J Endocrinol. 2020;183(4):R95–r106. doi: 10.1530/eje-20-0299. [DOI] [PMC free article] [PubMed] [Google Scholar]
- 5.Chetty M, Roomaney IA, Beighton P. The evolution of the nosology of osteogenesis imperfecta. Clin Genet. 2021;99(1):42–52. doi: 10.1111/cge.13846. [DOI] [PubMed] [Google Scholar]
- 6.Jain M, Tam A, Shapiro JR, Steiner RD, Smith PA, Bober MB, Hart T, Cuthbertson D, Krischer J, Mullins M, Bellur S, Byers PH, Pepin M, Durigova M, Glorieux FH, Rauch F, Lee B, Sutton VR, Nagamani SCS. Growth characteristics in individuals with osteogenesis imperfecta in North America: results from a multicenter study. Genet Med. 2019;21(2):275–283. doi: 10.1038/s41436-018-0045-1. [DOI] [PMC free article] [PubMed] [Google Scholar]
- 7.Chagas CE, Roque JP, Santarosa PB, Lazaretti-Castro M, Martini LA. Do patients with osteogenesis imperfecta need individualized nutritional support? Nutrition. 2012;28(2):138–142. doi: 10.1016/j.nut.2011.04.003. [DOI] [PubMed] [Google Scholar]
- 8.Veilleux LN, Pouliot-Laforte A, Lemay M, Cheung MS, Glorieux FH, Rauch F. The functional muscle-bone unit in patients with osteogenesis imperfecta type I. Bone. 2015;79:52–57. doi: 10.1016/j.bone.2015.05.019. [DOI] [PubMed] [Google Scholar]
- 9.Veilleux LN, Lemay M, Pouliot-Laforte A, Cheung MS, Glorieux FH, Rauch F. Muscle anatomy and dynamic muscle function in osteogenesis imperfecta type I. J Clin Endocrinol Metab. 2014;99(2):E356–362. doi: 10.1210/jc.2013-3209. [DOI] [PubMed] [Google Scholar]
- 10.Bishop N, Adami S, Ahmed SF, Antón J, Arundel P, Burren CP, Devogelaer JP, Hangartner T, Hosszú E, Lane JM, Lorenc R, Mäkitie O, Munns CF, Paredes A, Pavlov H, Plotkin H, Raggio CL, Reyes ML, Schoenau E, Semler O, Sillence DO, Steiner RD. Risedronate in children with osteogenesis imperfecta: a randomised, double-blind, placebo-controlled trial. Lancet. 2013;382(9902):1424–1432. doi: 10.1016/s0140-6736(13)61091-0. [DOI] [PubMed] [Google Scholar]
- 11.Li LJ, Zheng WB, Zhao DC, Yu W, Wang O, Jiang Y, Xia WB, Li M. Effects of zoledronic acid on vertebral shape of children and adolescents with osteogenesis imperfecta. Bone. 2019;127:164–171. doi: 10.1016/j.bone.2019.06.011. [DOI] [PubMed] [Google Scholar]
- 12.Li H, Ji CY, Zong XN, Zhang YQ. Body mass index growth curves for Chinese children and adolescents aged 0 to 18 years. Zhonghua Er Ke Za Zhi. 2009;47(7):493–498. [PubMed] [Google Scholar]
- 13.Wu XP, Yang YH, Zhang H, Yuan LQ, Luo XH, Cao XZ, Liao EY. Gender differences in bone density at different skeletal sites of acquisition with age in Chinese children and adolescents. J Bone Miner Metab. 2005;23(3):253–260. doi: 10.1007/s00774-004-0592-1. [DOI] [PubMed] [Google Scholar]
- 14.Xu H, Zhao Z, Wang H, Ding M, Zhou A, Wang X, Zhang P, Duggan C, Hu FB. Bone mineral density of the spine in 11,898 Chinese infants and young children: a cross-sectional study. PLoS ONE. 2013;8(12):e82098. doi: 10.1371/journal.pone.0082098. [DOI] [PMC free article] [PubMed] [Google Scholar]
- 15.Schwartz GJ, Haycock GB, Edelmann CM, Spitzer A. A simple estimate of glomerular filtration rate in children derived from body length and plasma creatinine. Pediatrics. 1976;58(2):259–263. doi: 10.1542/peds.58.2.259. [DOI] [PubMed] [Google Scholar]
- 16.Dhana K, Koolhaas CM, Schoufour JD, Rivadeneira F, Hofman A, Kavousi M, Franco OH. Association of anthropometric measures with fat and fat-free mass in the elderly: the Rotterdam study. Maturitas. 2016;88:96–100. doi: 10.1016/j.maturitas.2016.03.018. [DOI] [PubMed] [Google Scholar]
- 17.Cruz-Jentoft AJ, Bahat G, Bauer J, Boirie Y, Bruyère O, Cederholm T, Cooper C, Landi F, Rolland Y, Sayer AA, Schneider SM, Sieber CC, Topinkova E, Vandewoude M, Visser M, Zamboni M. Sarcopenia: revised European consensus on definition and diagnosis. Age Ageing. 2019;48(4):601. doi: 10.1093/ageing/afz046. [DOI] [PMC free article] [PubMed] [Google Scholar]
- 18.Deurenberg P, Yap M, van Staveren WA. Body mass index and percent body fat: a meta analysis among different ethnic groups. Int J Obes Relat Metab Disord. 1998;22(12):1164–1171. doi: 10.1038/sj.ijo.0800741. [DOI] [PubMed] [Google Scholar]
- 19.Podsiadlo D, Richardson S. The timed "Up & Go": a test of basic functional mobility for frail elderly persons. J Am Geriatr Soc. 1991;39(2):142–148. doi: 10.1111/j.1532-5415.1991.tb01616.x. [DOI] [PubMed] [Google Scholar]
- 20.Liu Y, Asan MD, Lv F, Xu X, Wang J, Xia W, Jiang Y, Wang O, Xing X, Yu W, Wang J, Sun J, Song L, Zhu Y, Yang H, Wang J, Li M. Gene mutation spectrum and genotype-phenotype correlation in a cohort of Chinese osteogenesis imperfecta patients revealed by targeted next generation sequencing. Osteoporos Int. 2017;28(10):2985–2995. doi: 10.1007/s00198-017-4143-8. [DOI] [PubMed] [Google Scholar]
- 21.Sillence DO, Senn A, Danks DM. Genetic heterogeneity in osteogenesis imperfecta. J Med Genet. 1979;16(2):101–116. doi: 10.1136/jmg.16.2.101. [DOI] [PMC free article] [PubMed] [Google Scholar]
- 22.Semler O, Garbes L, Keupp K, Swan D, Zimmermann K, Becker J, Iden S, Wirth B, Eysel P, Koerber F, Schoenau E, Bohlander SK, Wollnik B, Netzer C. A mutation in the 5'-UTR of IFITM5 creates an in-frame start codon and causes autosomal-dominant osteogenesis imperfecta type V with hyperplastic callus. Am J Hum Genet. 2012;91(2):349–357. doi: 10.1016/j.ajhg.2012.06.011. [DOI] [PMC free article] [PubMed] [Google Scholar]
- 23.Zheng WB, Hu J, Zhao DC, Zhou BN, Wang O, Jiang Y, Xia WB, Xing XP, Li M. The role of osteocalcin in regulation of glycolipid metabolism and muscle function in children with osteogenesis imperfecta. Front Endocrinol. 2022;13:898645. doi: 10.3389/fendo.2022.898645. [DOI] [PMC free article] [PubMed] [Google Scholar]
- 24.Germain-Lee EL, Brennen FS, Stern D, Kantipuly A, Melvin P, Terkowitz MS, Shapiro JR. Cross-sectional and longitudinal growth patterns in osteogenesis imperfecta: implications for clinical care. Pediatr Res. 2016;79(3):489–495. doi: 10.1038/pr.2015.230. [DOI] [PubMed] [Google Scholar]
- 25.Kim JH, Park YS. Low muscle mass is associated with metabolic syndrome in Korean adolescents: the Korea National Health and Nutrition Examination Survey 2009–2011. Nutr Res. 2016;36(12):1423–1428. doi: 10.1016/j.nutres.2016.09.013. [DOI] [PubMed] [Google Scholar]
- 26.Burrows R, Correa-Burrows P, Reyes M, Blanco E, Albala C, Gahagan S. Low muscle mass is associated with cardiometabolic risk regardless of nutritional status in adolescents: a cross-sectional study in a Chilean birth cohort. Pediatr Diabetes. 2017;18(8):895–902. doi: 10.1111/pedi.12505. [DOI] [PMC free article] [PubMed] [Google Scholar]
- 27.Palomo T, Glorieux FH, Schoenau E, Rauch F. Body composition in children and adolescents with osteogenesis imperfecta. J Pediatr. 2016;169:232–237. doi: 10.1016/j.jpeds.2015.10.058. [DOI] [PubMed] [Google Scholar]
- 28.Veilleux LN, Darsaklis VB, Montpetit K, Glorieux FH, Rauch F. Muscle function in osteogenesis imperfecta type IV. Calcif Tissue Int. 2017;101(4):362–370. doi: 10.1007/s00223-017-0287-y. [DOI] [PubMed] [Google Scholar]
- 29.Lee NK, Sowa H, Hinoi E, Ferron M, Ahn JD, Confavreux C, Dacquin R, Mee PJ, McKee MD, Jung DY, Zhang Z, Kim JK, Mauvais-Jarvis F, Ducy P, Karsenty G. Endocrine regulation of energy metabolism by the skeleton. Cell. 2007;130(3):456–469. doi: 10.1016/j.cell.2007.05.047. [DOI] [PMC free article] [PubMed] [Google Scholar]
- 30.David V, Dai B, Martin A, Huang J, Han X, Quarles LD. Calcium regulates FGF-23 expression in bone. Endocrinology. 2013;154(12):4469–4482. doi: 10.1210/en.2013-1627. [DOI] [PMC free article] [PubMed] [Google Scholar]
- 31.Kratchmarova I, Kalume DE, Blagoev B, Scherer PE, Podtelejnikov AV, Molina H, Bickel PE, Andersen JS, Fernandez MM, Bunkenborg J, Roepstorff P, Kristiansen K, Lodish HF, Mann M, Pandey A. A proteomic approach for identification of secreted proteins during the differentiation of 3T3-L1 preadipocytes to adipocytes. Mol Cell Proteom. 2002;1(3):213–222. doi: 10.1074/mcp.m200006-mcp200. [DOI] [PubMed] [Google Scholar]
- 32.Guo H, Bazuine M, Jin D, Huang MM, Cushman SW, Chen X. Evidence for the regulatory role of lipocalin 2 in high-fat diet-induced adipose tissue remodeling in male mice. Endocrinology. 2013;154(10):3525–3538. doi: 10.1210/en.2013-1289. [DOI] [PMC free article] [PubMed] [Google Scholar]
- 33.Guo H, Jin D, Zhang Y, Wright W, Bazuine M, Brockman DA, Bernlohr DA, Chen X. Lipocalin-2 deficiency impairs thermogenesis and potentiates diet-induced insulin resistance in mice. Diabetes. 2010;59(6):1376–1385. doi: 10.2337/db09-1735. [DOI] [PMC free article] [PubMed] [Google Scholar]
- 34.Jin D, Guo H, Bu SY, Zhang Y, Hannaford J, Mashek DG, Chen X. Lipocalin 2 is a selective modulator of peroxisome proliferator-activated receptor-gamma activation and function in lipid homeostasis and energy expenditure. Faseb J. 2011;25(2):754–764. doi: 10.1096/fj.10-165175. [DOI] [PMC free article] [PubMed] [Google Scholar]
- 35.Petropoulou PI, Mosialou I, Shikhel S, Hao L, Panitsas K, Bisikirska B, Luo N, Bahna F, Kim J, Carberry P, Zanderigo F, Simpson N, Bakalian M, Kassir S, Shapiro L, Underwood MD, May CM, Soligapuram Sai KK, Jorgensen MJ, Confavreux CB, Shapses S, Laferrère B, Mintz A, Mann JJ, Rubin M, Kousteni S. Lipocalin-2 is an anorexigenic signal in primates. Elife. 2020 doi: 10.7554/eLife.58949. [DOI] [PMC free article] [PubMed] [Google Scholar]
- 36.Olson B, Zhu X, Norgard MA, Levasseur PR, Butler JT, Buenafe A, Burfeind KG, Michaelis KA, Pelz KR, Mendez H, Edwards J, Krasnow SM, Grossberg AJ, Marks DL. Lipocalin 2 mediates appetite suppression during pancreatic cancer cachexia. Nat Commun. 2021;12(1):2057. doi: 10.1038/s41467-021-22361-3. [DOI] [PMC free article] [PubMed] [Google Scholar]
- 37.Rebalka IA, Monaco CMF, Varah NE, Berger T, D'Souza DM, Zhou S, Mak TW, Hawke TJ. Loss of the adipokine lipocalin-2 impairs satellite cell activation and skeletal muscle regeneration. Am J Physiol Cell Physiol. 2018;315(5):C714–c721. doi: 10.1152/ajpcell.00195.2017. [DOI] [PMC free article] [PubMed] [Google Scholar]
- 38.Ponzetti M, Aielli F, Ucci A, Cappariello A, Lombardi G, Teti A, Rucci N. Lipocalin 2 increases after high-intensity exercise in humans and influences muscle gene expression and differentiation in mice. J Cell Physiol. 2022;237(1):551–565. doi: 10.1002/jcp.30501. [DOI] [PMC free article] [PubMed] [Google Scholar]
- 39.Brunetti G, Papadia F, Tummolo A, Fischetto R, Nicastro F, Piacente L, Ventura A, Mori G, Oranger A, Gigante I, Colucci S, Ciccarelli M, Grano M, Cavallo L, Delvecchio M, Faienza MF. Impaired bone remodeling in children with osteogenesis imperfecta treated and untreated with bisphosphonates: the role of DKK1, RANKL, and TNF-α. Osteoporos Int. 2016;27(7):2355–2365. doi: 10.1007/s00198-016-3501-2. [DOI] [PubMed] [Google Scholar]
Associated Data
This section collects any data citations, data availability statements, or supplementary materials included in this article.
Supplementary Materials
Data Availability Statement
The data supporting the findings of the study are available from the corresponding author upon reasonable request.