

Abstract
Proteolysis is a critical biochemical process yet a challenging field to study experimentally due to the self-degradation of a protease and the complex, dynamic degradation steps of a substrate. Mass spectrometry (MS) is the traditional way for proteolytic studies, yet it is challenging when time-resolved, step-by-step details of the degradation process are needed. We recently found a way to resolve the cleavage site, preference/selectivity of cleavage regions, and proteolytic kinetics by combining site-directed spin labeling (SDSL) of protein substrate, time-resolved two-dimensional (2D) electron paramagnetic resonance (EPR) spectroscopy, protease immobilization via metal–organic materials (MOMs), and MS. The method has been demonstrated on a model substrate and protease, yet there is a lack of details on the practical operations to carry out our strategy. Thus, this protocol summarizes the key steps and considerations when carrying out the EPR/MS study on proteolytic processes, which can be generalized to study other protein/polypeptide substrates in proteolysis. Details for the experimental operation and cautions of each step are reported with figures illustrating the concepts. This protocol provides an effective approach to understanding the proteolytic process with the advantages of offering time-resolved, residue-level resolution of structural basis underlying the process. Such information is important for revealing the cleavage site and proteolytic mechanisms of unknown proteases. The advantage of EPR, probing the target substrate regardless of the complexities caused by the proteases and their self-degradation, offers a practically effective, rapid, and easy-to-operate approach to studying proteolysis.
Key features
• Combining protease immobilization, EPR, spin labeling, and MS experimental methods allows for the analysis of proteolysis process in real time.
• Reveals cleavage site, kinetics of product generation, and preference of cleavage regions via time-resolved SDSL-EPR.
• MS confirms EPR findings and helps depict the sequences and populations of the cleaved segments in real time.
• The demonstrated method can be generalized to other proteins or polypeptide substrates upon proteolysis by other proteases.
Keywords: Protease immobilization, Metal–organic materials (MOMs), Electron paramagnetic resonance (EPR), Site-directed spin labeling, Mass spectrometry (MS), Tandem MS
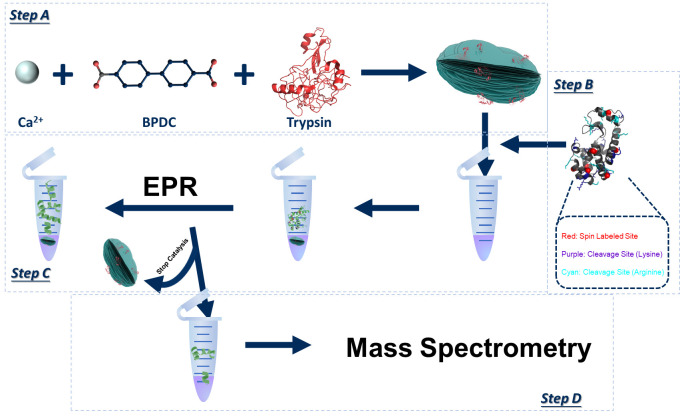
Graphical overview
Background
Proteolysis is a critical cellular/biochemical process receiving extensive research attention that has found wide applications in industry and biomedicine [1–6]. Most current progress has been focused on the structures [7–9], cleavage sites [10–13], and proteolytic mechanisms of commonly seen proteases [14–17]. Meanwhile, a knowledge gap still remains regarding the molecular level details of the step-by-step, proteolytic actions on the substrate polypeptides/proteins. Bridging this gap is challenging because it requires revealing, in real time, the details of the reaction mixture, a complex ensemble containing peptide pieces with constantly changing lengths and populations. Perhaps the most feasible practice to probe the lengths and populations of the broken peptide sequences of the entire ensemble would be tandem mass spectrometry (MS/MS or MS2) [18–21], which also resolves amino acid sequence [22–24]. However, MS does not conveniently provide time-resolved information due to the change in product size and population as well as the self-degradation of the protease, which may create additional peptide sequences in the reaction mixture in real time, complicating the mass analysis and even the proteolytic kinetics due to the loss in protease over time. Thus, MS is often applied to analyze the final products after a certain stage (or upon completion) of a proteolytic reaction.
Recently, we found it possible to track the proteolytic process using site-directed spin labeling (SDSL) in combination with electron paramagnetic resonance (EPR) spectroscopy, which is sensitive only to the spin-labeled peptide truncations regardless of the presence of the protease and other broken peptide pieces [25]. This is because EPR line width is sensitive to the molecular size of the labeled polypeptides, which can be tracked via time-resolved, two-dimensional (2D) EPR [26–27]. We also found that immobilizing proteases on the surface of metal–organic materials (MOMs) crystals via co-crystallization allowed for the separation of protease from the soluble reaction mixture during a proteolytic reaction, which contains intact and broken peptides, by centrifugation [28–30]. The soluble portion can then be subjected to MS/MS study to determine the peptide sequences of the entire ensemble. Thus, we proposed a combination of MOMs, EPR, and MS to reveal the global (via MS) and local (via EPR) structural information of the peptide substrates in real time upon proteolysis, which ended up with a dynamic movie depicting the cleavage process [25]. As that was the first time that such a combination was applied to study proteases, we believe it is necessary to summarize the practical protocols to carry out such a complicated study. This protocol is based on our recent publication and utilized the data therein to demonstrate the protocol [25].
Materials and reagents
Reagents
Biphenyl-4,4′-dicarboxylic acid (BPDC-COOH) (Sigma-Aldrich, catalog number: 225266)
NaOH (Sigma-Aldrich, catalog number: 221465)
2-Isopropanol (Fisher Scientific, catalog number: A416-4)
CaCl2 (Sigma-Aldrich, catalog number: C4901)
Trypsin (Sigma-Aldrich, catalog number: T1426)
1-Oxyl-2,2,5,5-tetramethyl-∆3-(methanesulfonyloxymethyl)pyrroline (MTSL) (Toronto Research Chemicals, catalog number: O872400)
Acetonitrile (Fisher Scientific, catalog number: A21-200)
3-(N-Morpholino)propanesulfonic acid, 4-Morpholinepropanesulfonic acid (MOPS) (Sigma-Aldrich, catalog number: M1254)
NaCl (Sigma-Aldrich, catalog number: S9888)
4-(2-Hydroxyethyl)piperazine-1-ethanesulfonic acid, N-(2-Hydroxyethyl)piperazine-N′-(2-ethanesulfonic acid) (HEPES) (Sigma-Aldrich, catalog number: H3375)
Solutions
Spin buffer (pH 6.8) (see Recipes)
HEPES buffer (pH 7.4) (see Recipes)
Recipes
-
Spin buffer (pH 6.8)
Reagent Final concentration Quantity MOPS 50 mM 10.46 g NaCl 25 mM 1.46 g H2O n/a 1 L Total n/a 1 L -
HEPES buffer (pH 7.4)
Reagent Final concentration Quantity HEPES 50 mM 11.92 g NaCl 50 mM 2.92 g H2O n/a 1 L Total n/a 1 L
Laboratory supplies
Beaker (100 mL) (Fisher Scientific, catalog number: 02-540N)
Magnetic spin bar (VWR, catalog number: 58948-080)
Buchner funnel (Sigma-Aldrich, catalog number: Z247340)
Side arm flask (Sigma-Aldrich, catalog number: Z740685)
Microcentrifuge tube (Fisher Scientific, catalog number: 02-682-004)
Amicon spin concentrator (Millipore Sigma, catalog number: ACS 501024)
Borosilicate capillary tube (DWK Life Sciences, catalog number: 13-707-47)
Filter paper (Millipore Sigma, catalog number: WHA1093125)
Equipment
Oven, sample drying (Global Industrial, catalog number: T9FB918772)
Stirring hot plate, mixing (Thermo Scientific, catalog number: SP88854100)
Vortex, mixing (VWR, catalog number: 10153-838)
Nutation mixer, incubation (VWR, catalog number: 82009-202)
Centrifuge, separation (Thermo Scientific, catalog number: 75887203)
EPR, dynamic monitoring (Bruker, model: ESC-106)
Mass spectrometer, peptide mass (Water, model: SYNAPT MS)
Ultra performance liquid chromatography (UPLC), peptide separation (ACQUITY UPLC I-class System)
Software and datasets
Software and algorithms
Multi-component for CW EPR spectral simulation (https://sites.google.com/site/altenbach/labview-programs/epr-programs/multicomponent?authuser=0)
Confirm peptide sequence ProteinLynx Global SERVER 3.0.3
Procedure
The key to achieving the full picture of substrate cleavage by a protease is to obtain both the change in the length/population of different substrate segments in real time via EPR and the peptide sequences of the whole ensemble via MS. This requires protease immobilization, followed by EPR and MS measurements to be carried out separately.
-
Protease immobilization on MOMs
This major step is to immobilize the target protease onto MOMs during the MOM formation process via co-precipitation. We chose Ca-BPDC as the MOM for protease immobilization due to its high reliability and reproducibility when co-crystalizing with enzymes as well as the proper size of co-crystals formed this way [28, 29]. This material is constructed via incubation of CaCl2 and disodium biphenyl-4,4′-dicarboxylate (BPDC-Na2) in aqua condition, an enzyme friendly environment. Here, biphenyl-4,4′-dicarboxylic acid (BPDC-COOH) has to be converted to BPDC-Na2 due to its low solubility in water.
-
Preparation of BPDC-Na2
Mix 9.69 g (~40 mmol) of BPDC-COOH and 3.20 g (~80 mmol) of NaOH in a molar ratio of 1:2 in 100 mL of double-deionized (dd-) water. Upon immediate mixing, the reaction system should be white and cloudy because of the low solubility of BPDC-COOH in water.
Vigorously stir the mixture at room temperature for 2 h. Over time, a transparent solution will be obtained due to the enhanced solubility of BPDC-Na2.
Slowly add 1 L of cold 2-isopropanol to the mixture to precipitate BPDC-Na2 and collect the obtained BPDC-Na2 by filtration through a standard filter paper.
Wash the collected filtration with cold isopropanol until a final pH of 7.0 (for the flowthrough). Usually, 0.5 L of cold isopropanol is needed.
Dry the obtained BPDC-Na2 at 75 in an oven overnight.
-
Immobilization of protease on Ca-BPDC
Prepare stock solutions of CaCl2 and BPDC-Na2 in water at 0.5 M and 0.25 M, respectively. Usually, the stock volume is 5–10 mL, which can be stored for a few months.
Disperse 50 μL of 0.25 M BPDC-Na2 into 1 mL of dd-water, followed by the addition of 20 μL of 20 mg/mL protease and 50 μL of 0.5 M CaCl2. The amount of added protease is adjustable, depending on its solubility and activity. Here, we are using trypsin, a widely seen serine protease, as an example.
Immediately mix the reaction system via vigorous vortex for 30 s and incubate at ambient temperature overnight with gentle nutation (~25 RPM nutation rate is suggested).
Wash the obtained protease@Ca-BPDC with dd-water three times. Each wash is done by centrifugation at 19,000× g for 5 min and resuspend it in 1 mL of water. The obtained co-crystal can be stored for weeks at 4 as judged by testing the crystal properties of the formed Ca-BPDC for many weeks (for characterization see step A3).
Caution: One has to confirm the complete removal of unreacted species in the reaction mixture by determining that no protease (by checking the protein UV absorption at 280 nm) or other involved chemicals (by checking MS) are present in the supernatant after the final wash. If needed, more washes can be applied. Depending on protease, the nutation can be carried out in a fridge if self-degradation is serious.
-
Characterization
Confirm the structure of Ca-BPDC and inclusion of protease by standard MOM characterization approaches, such as confocal fluorescence microscopy, Powder X-ray diffractometer, thermal gravimetric analysis, and scanning electron microscopy.
Caution: Usually, we do not run nitrogen isotherm [also known as the BET (Brunauer, Emmett, and Teller), experiment] on Ca-based MOMs. Because these techniques are well-established, a detailed procedure to run each equipment is not provided here [25].
-
-
Spin labeling of the substrate
This major step is to create an EPR sensitive substrate for monitoring the proteolysis process. Spin labeling is required for protein dynamics, and thus protein size studies by EPR for most proteins. T4 phage lysozyme (T4L) is selected in this protocol as an example to facilitate the discussion, due to its well-studied structure and high population of lysine (K) and arginine (R), which are known as the typical cleavage sites of trypsin [31]. We are using the most widely used spin labeling approach, SDSL of proteins via a methanethiosulfonate-based nitroxide labeling reagent developed by Hubbell and coworkers [32, 33]. The basis of this approach is to create a single cysteine mutation at the site of interest, followed by reaction with the labeling reagent. In principle, any substrate protein can be studied this way.
Caution: For cysteine-rich substrates, an alternative labeling strategy is needed (see below) [34].
-
Expression of substrate cysteine mutants
Depending on the structure of the substrate, multiple single cysteine mutants need to be created to cover most regions of the substrate and monitor their cleavage over time. The general rule is to place at least one cysteine for each secondary structure (for example α-helix, β-strand, and loop), in order to cover the degradation of each segment by a protease. If there are specific regions of the target protein that need special attention in a proteolytic study, more cys mutants can be placed in these regions. The position of the cys mutants should be solvent accessible. For example, in T4L, 44C, 65C, 72C, 89C, 109C, 118C, 131C, and 151C (each “C” indicates the native residue at the corresponding position was mutated to a cysteine) were generated, one at a time, which is sufficient to cover most regions of the protein. The procedures of site-directed mutagenesis are well documented in the literature and thus not repeated here [32]. Verification of each mutation can be carried out via standard sequencing service available commercially. Nowadays, the cost of sequence is easily affordable.
The generated substrate mutants should be over-expressed and purified in appropriate cell lines. In our case, T4L mutants were expressed in E. coli and purified using published procedures [27, 35], which are not repeated here for the conciseness of this protocol.
Verification of the purity of obtained substrate mutants should be confirmed with circular dichroism (CD) spectroscopy, protein gel–electrophoresis, and protein activity if possible. In our case, each T4L mutant was confirmed to have the expected secondary structure, molecular weight, and catalytic activity [27, 32].
-
Spin labeling of the substrate mutants
The most widely used spin labeling compound for cysteine mutants is the 1-Oxyl-2,2,5,5-tetramethyl-∆3-(methanesulfonyloxymethyl)pyrroline (MTSL), available at Toronto Research Chemicals, Inc. Powder MTSL should be dissolved in acetonitrile with the concentration of 200 mM.
Add 10-fold molar excess of MTSL into purified T4L mutants and incubate at 4 °C overnight. This will yield a spin labeled sidechain typically designated as R1. Usually, the protein concentration depends on its stability. For most proteins, we suggest maintaining a relatively low protein concentration, ca. < tens of micromolar, to avoid aggregation during labeling.
Filtrate the mixture after incubation to remove excess MTSL by using the Amicon spin concentrator (10,000 MWCO cutoff, 50 mL).
Wash the spin-labeled T4L mutants with a spin buffer three times to further remove the excess MTSL. Removal of all unreacted labeling compound should be confirmed by EPR. Typical EPR settings include ~1 mW power, 3300–3400 G scan range, 30 s scan time for each scan, 1 G modulation depth, and 250 video gain. Incomplete removal is often indicated by an additional sharp component on top of the regular EPR spectrum of a labeled protein. Note that because proteolytic reactions also generate short peptides and thus a sharp spectral component, it is critical to completely remove all unreacted labeling reagent (Figure 1).
Caution: For cysteine-rich proteins, spin labeling based on unnatural amino acids and the corresponding labeling reagents need to be employed as detailed in the literature [34, 36]. The selection of the labeling reagent needs additional caution so that relatively more rigid spin labels should be preferred such as the R1p and RX discussed in a review [26]. This way, the narrowing of the continuous wave (CW) EPR spectrum is mainly caused by the cleavage of the substrate protein, maximizing the sensitivity of the CW EPR spectrum to the protein size. It is also critical to completely remove all unreacted labeling reagent.
-
-
EPR study of the proteolytic process
-
Solution state EPR study as a control
An advantage of time-resolved EPR is to monitor the change in the rotational tumbling rate and thus the molecular weight of the labeled substrate protein pieces in the presence of protease in both the solution state and upon the presence of MOMs. Usually, the proteolytic process could take from minutes to hours, depending on the concentrations of the substrates and protease. Thus, a proper selection of concentration is necessary so that the whole process can be revealed without lengthy experimentation time. In addition, a control of free protease activity against the substrate in solution is often needed in order to confirm the operation. Finally, the EPR spectrum of the sole substrate is needed in order to compare with that of the degraded substrate and confirm cleavage. In our case, we monitored trypsin activity upon degradation of spin-labeled T4L in real time by a Bruker ECS-106 Electron Paramagnetic Resonance (EPR) spectrometer equipped with a cavity resonator (W1700750). The spectrum of each spin-labeled T4 mutant with a 1 mg/mL concentration was acquired prior to later steps discussed below.
Dissolve an appropriate volume of protease into HEPES buffer to make a 1.75 mg/mL (10 times of the final concentration) stock solution for the protease. Note that this stock solution should be freshly prepared due to its self-digestion tendency. Also, HEPES buffer is needed to be consistent with the MOM study because MOMs are stable in HEPES buffer.
Prepare spin-labeled T4L substrate to 10 mg/mL with HEPES buffer. Depending on substrate solubility, this stock concentration can be adjusted.
Bring 2 μL of stock protease and 2 μL of 10 mg/mL T4 substrate to 16 μL of HEPES buffer to make a proteolytic system with 0.175 mg/mL and 1 mg/mL final concentrations of protease and T4L, respectively.
Load the mixture into a borosilicate capillary tube and subject immediately for time-resolved EPR study for 2 h with a 5 min interval. We found 2 h to be sufficient to observe the completion of the proteolytic process using the concentrations detailed above.
An observe power of 200 µW, modulation frequency of 100 kHz, and a modulation amplitude of 0.5 G were used for the acquisition of all CW EPR spectra. Note that a narrow modulation amplitude is needed to detect the narrow linewidth of spectral components originated from cleaved, short peptide chains, bearing in mind that the shorter the peptides, the faster their rotational tumbling is, and the narrower their linewidths.
Caution: The concentrations of protease and substrate could vary depending on the system of study and instrument sensitivity. The EPR data at 0 min could not be acquired yet is often assumed that zero degradation occurs upon immediate mixing. A 5 min interval is often more than sufficient to observe the whole process, yet depending on protease and substrate, instrument sensitivity, and rate of reaction, smaller intervals can be applied.
-
EPR on protease@MOMs to degrade peptide substrates
Centrifuge 800 µL of protease@CaBPDC suspension to collect all composite. Then, resuspend the composite into 20 µL of buffer, which contains 1 mg/mL of spin-labeled T4 substrate.
Load the mixture into a borosilicate capillary tube and subject immediately for time-resolved EPR study for 2 h with a 5 min interval. Loading the mixture of co-crystals and substrate solution is often completed via capillary effects with tubes open in both ends. Upon completion of loading, the end containing the sample should be sealed to prevent leaking during the measurement.
An observe power of 200 µW, modulation frequency of 100 kHz, and a modulation amplitude of 0.5 G was used for the acquisition of all CW EPR spectra.
-
-
MS/MS data acquisition
Protease immobilization on MOMs allows for ease of separation from the soluble products and thus MS analysis of the product ensemble without the interference of protease. A major difference from EPR measurements is that the ion concentration in the buffer needs to be minimized in MS studies, which requires a buffer switch via wash–resuspension. The reaction rate will also be reduced as compared with that in buffer. However, although the reaction kinetics can be altered, being able to carry out time-resolved MS study will still offer valuable information such as the sequences of various broken protein pieces on the dynamic picture of the substrate cleavage process, supporting and confirming the findings from EPR. Thus, MS is necessary in this protocol.
Sample preparation for MS in principle does not need to offer the same time resolution as EPR studies due to the slower reaction rate and the difficulty in practical operation. For example, in our case, upon mixing 40 folds of trypsin@Ca-BPDC with T4L (which does not need to be spin labeled) in 120 μL with 1 mg/mL concentration of the composite and T4L, 20 µL of the mixture was removed from the reaction at 30 min, 1 h, 1.5 h, 2 h, 2.5 h, and 3 h, followed by a quick centrifugation (19,000× g for 1 min) and collection of the supernatant.
Each supernatant should be diluted with dd-water to 100 ng/μL to match the most sensitive concentration range for mass spectrometry.
The data acquisition and analysis can be done in a regular modern MS spectrometer. In our case, a Waters SYNAPT MS system controlled by MassLynx 4.2 Software was employed. An ACQUITY I-class UPLC System equipped with 2.1 × 100 mm BEH300 1.7 μm Peptide Separation Technology C18 column was used to separate fragmented polypeptides.
Run each sample with a 20 min gradient (3%–37% B), after 1 min non-gradient flow at initial conditions (3% B). Mobile phase A was 0.1% formic acid (FA) in water and B was 0.1% FA in acetonitrile. The flow rate was 0.2 mL/min, and the column temperature was 65 °C. An auxiliary pump delivered a lockmass solution [100 fmol/μL (GLu1)-fibrinopeptide B (GFP) in 50:50 ACN/water containing 0.1% FA] for mass accuracy reference.
The instrument is operated in the positive ion V-mode. Use an alternating low collision energy (5 V) and elevated collision energy (ramping from 17 to 40 V) acquisition to acquire peptide precursor (MS) and fragmentation (MSE) data. Scan time was 0.5 s (1 s total duty cycle). The capillary voltage was 3.0 kV, source temperature 110 °C, cone voltage 30 V, and cone gas flow 10 L/h. Sampling of the lock spray channel was performed every 1 min.
Process the acquired data with IdentityE Software of ProteinLynx Global SERVER 3.0.3. Search the processed data against the manual database consisting of single protein (T4L in our case) sequence. Primary Digest Reagent will be selected as non-specific, while Cysteine (C) carbamidomethylation and methionine (M) oxidation will be allowed as optional modifications in this search. The average mass of the intact protein can be determined by MassLynx software.
Figure 1. Representative electron paramagnetic resonance (EPR) spectrum of an intact spin-labeled protein (A) and that of the cleaved pieces with spin labels attached (B).
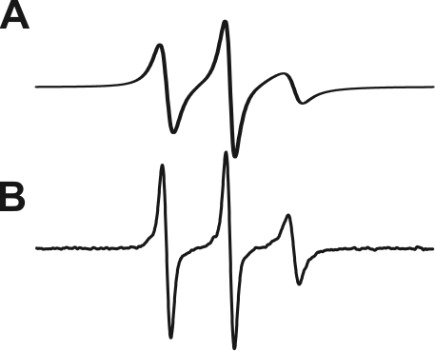
The smaller the cleaved protein piece, the sharper the continuous wave (CW) EPR spectrum.
Data analysis
This major step is to depict the processes of proteolysis via spectral analysis of data acquired from EPR and MS. To obtain the population changes of cleaved shorter peptides from EPR data, spectral simulation is needed. Since the simulation procedure has been published, only cautions and specific details are highlighted below [27]. An additional bonus is that by plotting the populations of the cleaved segments of T4L, it is possible to obtain the reaction kinetics and compare the effects of MOMs on protease performance (see below).
-
Simulate all collected EPR spectra using the Multi-component program available from Prof. Hubbell’s website. Note that the runtime engine of Labview available at National Instrument is needed for software installation. Before simulation, a careful baseline correction and normalization is needed for all spectra. Details of the baseline correction, spectra normalization, and simulation can be found in our protocol on the resolving enzyme orientation and dynamics via SDSL-EPR [32].
A key difference from our previous simulation works is that the two components involved in protease studies via EPR do not have the traditional immobile peak corresponding to very slow and/or highly restriction motion of the spin label. Instead, one component from our simulation originates from the uncleaved substrate; the linewidth and position fall within the classic mobile component, as described in our recent protocol. The other component, originated from the shorter peptides due to cleavage, results in a sharper peak located close to the classic mobile. The software we are using is able to distinguish the two components as long as the sharper component is populated by 5%–10% during cleavage.
Caution: Protease will continue cleaving other peptide bonds when no more K and R residues in the sequence are available for proteolysis. This will make the truncated peptides become shorter and shorter over time. Since the CW EPR spectra are sensitive to sub-ns motions, when the peptides are too short, EPR loses the sensitivity. Thus, our data analysis was only focused on the first 30–40 min. A representative data is shown in Figure 2.
-
Plot the mobile population vs. time to reveal the changes in the rotational tumbling rate and population of the spin-labeled protein segment and thus the proteolytic process. At all spin-labeled sites, the sharper mobile population increases over time and then tends to flatten. At the beginning of 40 min, the greater mobile population slope indicates the generation of a shorter fragmented polypeptide (Figure 3).
The proteolytic kinetics can also be obtained from the plot via fitting with the Michalis-Menten equation. For example, in our case (Figure 4), we found that reduced km indicates an enhanced binding affinity of trypsin@CaBPDC toward 151R1 as compared with free trypsin. The Vmax of trypsin@CaBPDC is lower than that of free trypsin in buffer. However, this does not mean trypsin@CaBPDC has a lower catalytic efficiency. To compare the catalytic efficiencies of enzymes, one often utilizes kcat/km, wherein kcat is the turnover number that is related to Vmax by Vmax = kcat[Etotal]. Based on the enhanced kcat/km, we believe that roughly 5–10 times catalytic efficiency enhancement is offered by entrapping trypsin in Ca-MOM.
For MS, taking trypsin as the example protease, it is already well known that it hydrolyzes peptide bonds of arginine and lysine at c-terminal side. Also, the amino acids sequence of the substrate is known. The IdentityE Software of ProteinLynx Global SERVER 3.0.3 could result in all fragmented peptide sequences and their intensities. A typical MS data set is shown in Figure 5. The products of proteolysis separated from the reaction mixture contain substrate and trypsin@Ca-BPDC at various time points. The ease of separation between the trypsin@Ca-BPDC composite and the broken peptide pieces in the solution allows the characterization of the ensemble of substrate protein and hydrolyzed peptides. The drop in the intensity of the peak highlighted in the red block confirms the reduction in molecular mass of the protein (Figure 5).
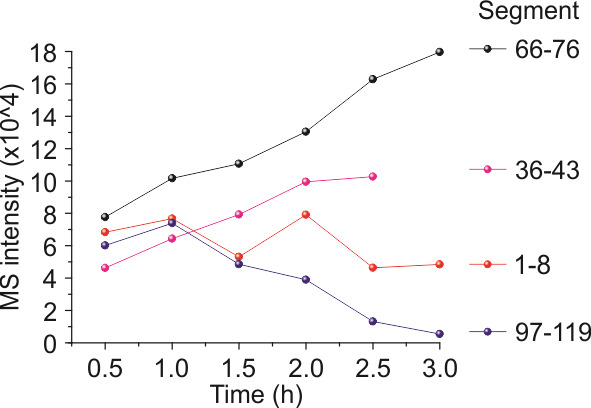
Plot the intensities of different polypeptides from MS vs. timeline. A rapid growth rate of a certain polypeptide fragment indicates that the cleavage sites near the fragment are more likely to be captured and broken down by trypsin. Thus, the intensities and slopes monitor the proteolytic process roughly. A representative data set is shown in Figure 6. Most segments show an increased population over time upon cleavage.
Lastly, the plots of population vs. time from EPR and MS need to be compared to confirm the findings. In our case, we found the 66–76 segment is favored to be cleaved by trypsin according to both EPR and MS. A quick way to prove this finding is mutagenesis, wherein 65K was mutated out and we did observe the disappearance of the 66–76. The site at 76 was still cleaved, resulting in the 61–76 truncation, which was generated at a much lower rate, confirming our speculation that 65K sticking out of the protein favors T4L contact with trypsin@Ca-BPDC. The other three dominant truncations were observed with a similar trend for each, as the mutation does not affect these regions.
Figure 2. Two-dimensional electron paramagnetic resonance (2D-EPR) data under the optimal trypsin concentration within a 2 h timeframe to degrade 151R1 of T4L using trypsin (a) and trypsin@Ca-BPDC (b).
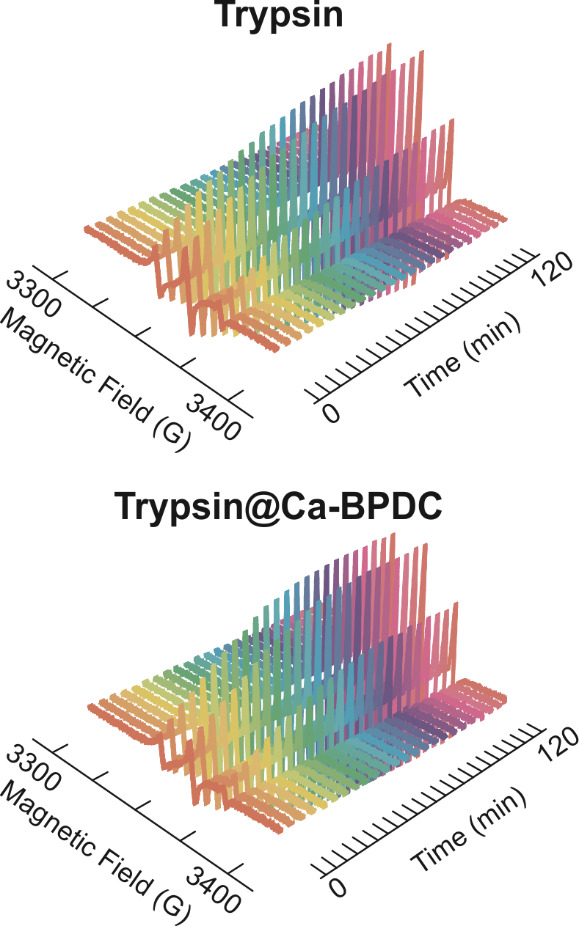
Figure 3. Plotting the mobile population of each labeled segment of T4L substrate upon reaction with free (left) and Ca-BPDC-encapsulated trypsin (right) for 40 min.
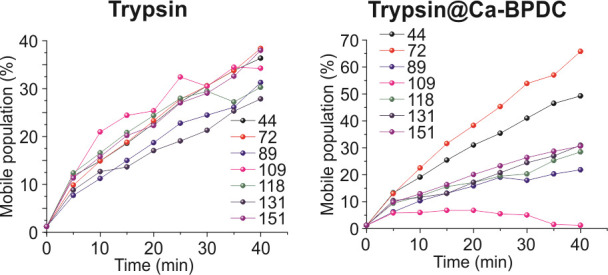
Figure 4. Fitting the velocity (V) as a function of substrate concentration to determine the Vmax and Km of free and MOM-encapsulated trypsin under varied substrate (151R1) concentrations.
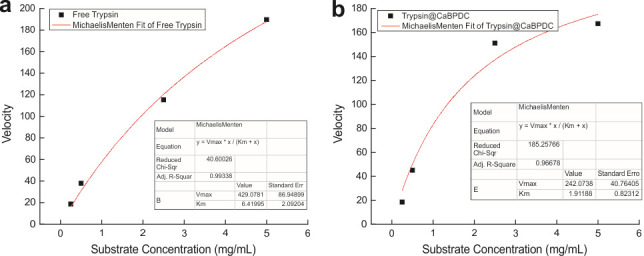
Figure 5. Representative mass spectrometry (MS) data from the products of proteolysis on our trypsin@Ca-BPDC study.
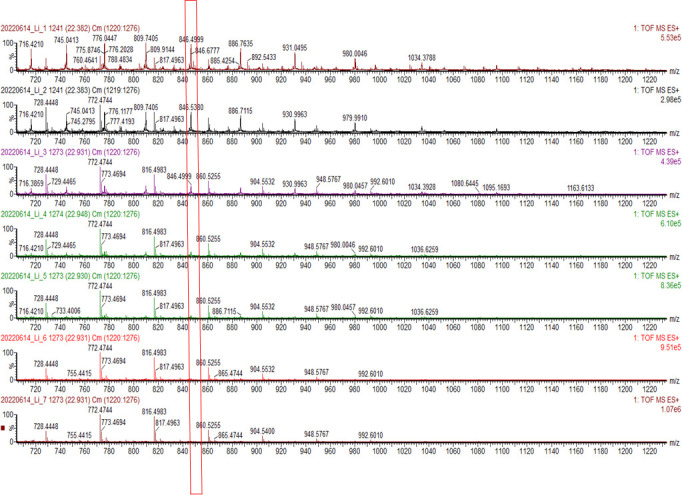
Figure 6. Representative mass spectrometry (MS) data at the beginning (1.5 h) of the reaction when trypsin@CaBPDC catalyzed the T4L substrate.
Validation of protocol
The whole procedure is validated in our recent work and the supplemental information [25].
General notes and troubleshooting
General notes
For proteolytic processes in a faster timescale (<30 min), the protocol should be modified to offer a higher time resolution. It has to be noted that the immobilization can only reduce the chance for two proteases to collide and cleave each other; it cannot completely prevent self-degradation. However, as shown in our recent work, the reusability of the protease@Ca-BPDC composites is very high, indicating that the self-degradation of the immobilized protease is marginal [25].
Additionally, the protease we are using is a commercial trypsin, which is relatively stable under our immobilization process. However, for a general protease that is sensitive to certain metal ions (ca. Ca2+) or ligands, caution should be given when immobilizing it. We recently published a paper on more possible combinations of metal ions and ligands to immobilize enzymes in water, which may help the custom immobilization of a general protease [37].
Troubleshooting (Table 1)
Table 1. Troubleshooting.
| Trouble | Possible cause | Suggested solution |
|---|---|---|
| Too slow or fast kinetics | Improper protease@CaMOMs concentration | Adjust concentration of protease@CaMOMs |
| Low protease activity upon immobilization | Self-degradation during co-crystallization | Adjust initial concentration of protease; reduce co-crystallization temperature |
Acknowledgments
This work is supported by the National Science Foundation (NSF: MCB 1942596 and DMR 2306137). We appreciate Dr. Peter G. Fajer for generously donating the Bruker ECS-106 to our institution (North Dakota State University) and Dr. Wayne Hubbell for generously providing the EPR data analysis software. This protocol is adapted from our recent work (Li et al., 2023).
Competing interests
The authors declare no competing interests.
Ethical considerations
No human subjects are involved in this work.
Citation
Readers should cite both the Bio-protocol article and the original research article where this protocol was used.
Q&A
Post your question about this protocol in Q&A and get help from the authors of the protocol and some of its users.
References
- 1.Neurath H. and Walsh K. A.(1976). Role of proteolytic enzymes in biological regulation(a review). Proc. Natl. Acad. Sci. U.S.A. 73(11): 3825-3832. [DOI] [PMC free article] [PubMed] [Google Scholar]
- 2.Turk B.(2006). Targeting proteases: successes, failures and future prospects. Nat. Rev. Drug Discovery 5(9): 785-799. [DOI] [PubMed] [Google Scholar]
- 3.Drag M. and Salvesen G. S.(2010). Emerging principles in protease-based drug discovery. Nat. Rev. Drug Discovery 9(9): 690-701. [DOI] [PMC free article] [PubMed] [Google Scholar]
- 4.Contesini F. J., Melo R. R. d. and Sato H. H.(2017). An overview of Bacillus proteases: from production to application. Crit. Rev. Biotechnol. 38(3): 321-334. [DOI] [PubMed] [Google Scholar]
- 5.Eatemadi A., Aiyelabegan H. T., Negahdari B., Mazlomi M. A., Daraee H., Daraee N., Eatemadi R. and Sadroddiny E.(2017). Role of protease and protease inhibitors in cancer pathogenesis and treatment. Biomed. Pharmacoth. 86: 221-231. [DOI] [PubMed] [Google Scholar]
- 6.Luo D., Vasudevan S. G. and Lescar J.(2015). The flavivirus NS2B–NS3 protease–helicase as a target for antiviral drug development. Antiviral Res. 118: 148-158. [DOI] [PubMed] [Google Scholar]
- 7.Zhang Z., Li Y., Loh Y. R., Phoo W. W., Hung A. W., Kang C. and Luo D.(2016). Crystal structure of unlinked NS2B-NS3 protease from Zika virus. Science 354(6319): 1597-1600. [DOI] [PubMed] [Google Scholar]
- 8.Ye Q., Campbell R. L. and Davies P. L.(2018). Structures of human calpain-3 protease core with and without bound inhibitor reveal mechanisms of calpain activation. J. Biol. Chem. 293(11): 4056-4070. [DOI] [PMC free article] [PubMed] [Google Scholar]
- 9.Puchades C., Rampello A. J., Shin M., Giuliano C. J., Wiseman R. L., Glynn S. E. and Lander G. C.(2017). Structure of the mitochondrial inner membrane AAA+ protease YME1 gives insight into substrate processing. Science 358(6363): eaao0464. [DOI] [PMC free article] [PubMed] [Google Scholar]
- 10.Vidmar R., Vizovišek M., Turk D., Turk B. and Fonović M.(2017). Protease cleavage site fingerprinting by label‐free in‐gel degradomics reveals pH‐dependent specificity switch of legumain. EMBO J. 36(16): 2455-2465. [DOI] [PMC free article] [PubMed] [Google Scholar]
- 11.Kleine-Weber H., Elzayat M. T., Hoffmann M. and Pöhlmann S.(2018). Functional analysis of potential cleavage sites in the MERS-coronavirus spike protein. Sci. Rep. 8(1): 16597. [DOI] [PMC free article] [PubMed] [Google Scholar]
- 12.Rögnvaldsson T., You L. and Garwicz D.(2014). State of the art prediction of HIV-1 protease cleavage sites. Bioinformatics 31(8): 1204-1210. [DOI] [PubMed] [Google Scholar]
- 13.Li Z., Hu L., Tang Z. and Zhao C.(2021). Predicting HIV-1 Protease Cleavage Sites With Positive-Unlabeled Learning. Front. Genet. 12: e658078. [DOI] [PMC free article] [PubMed] [Google Scholar]
- 14.Hedstrom L.(2002). Serine Protease Mechanism and Specificity. Chem. Rev. 102(12): 4501-4524. [DOI] [PubMed] [Google Scholar]
- 15.Xue Y. and Ha Y.(2012). Catalytic Mechanism of Rhomboid Protease GlpG Probed by 3,4-Dichloroisocoumarin and Diisopropyl Fluorophosphonate. J. Biol. Chem. 287(5): 3099-3107. [DOI] [PMC free article] [PubMed] [Google Scholar]
- 16.Lima M. C. P. and Seabra G. M.(2016). Reaction mechanism of the dengue virus serine protease: a QM/MM study. PCCP 18(44): 30288-30296. [DOI] [PubMed] [Google Scholar]
- 17.Nutho B., Mulholland A. J. and Rungrotmongkol T.(2019). Quantum Mechanics/Molecular Mechanics(QM/MM) Calculations Support a Concerted Reaction Mechanism for the Zika Virus NS2B/NS3 Serine Protease with Its Substrate. J. Phys. Chem. B 123(13): 2889-2903. [DOI] [PubMed] [Google Scholar]
- 18.Bagga T., Tulsian N. K., Mok Y. K., Kini R. M. and Sivaraman J.(2022). Mapping of molecular interactions between human E3 ligase TRIM69 and Dengue virus NS3 protease using hydrogen–deuterium exchange mass spectrometry. Cell. Mol. Life Sci. 79(5): 233. [DOI] [PMC free article] [PubMed] [Google Scholar]
- 19.Giansanti P., Tsiatsiani L., Low T. Y. and Heck A. J. R.(2016). Six alternative proteases for mass spectrometry–based proteomics beyond trypsin. Nat. Protoc. 11(5): 993-1006. [DOI] [PubMed] [Google Scholar]
- 20.Schopper S., Kahraman A., Leuenberger P., Feng Y., Piazza I., Müller O., Boersema P. J. and Picotti P.(2017). Measuring protein structural changes on a proteome-wide scale using limited proteolysis-coupled mass spectrometry. Nat. Protoc. 12(11): 2391-2410. [DOI] [PubMed] [Google Scholar]
- 21.Holding A. N.(2015). XL-MS: Protein cross-linking coupled with mass spectrometry. Methods 89: 54-63. [DOI] [PubMed] [Google Scholar]
- 22.Medzihradszky K. F. and Chalkley R. J.(2013). Lessons inde novopeptide sequencing by tandem mass spectrometry. Mass Spectrom. Rev. 34(1): 43-63. [DOI] [PMC free article] [PubMed] [Google Scholar]
- 23.Tran N. H., Qiao R., Xin L., Chen X., Liu C., Zhang X., Shan B., Ghodsi A. and Li M.(2018). Deep learning enables de novo peptide sequencing from data-independent-acquisition mass spectrometry. Nat. Methods 16(1): 63-66. [DOI] [PubMed] [Google Scholar]
- 24.Kong A. T., Leprevost F. V., Avtonomov D. M., Mellacheruvu D. and Nesvizhskii A. I.(2017). MSFragger: ultrafast and comprehensive peptide identification in mass spectrometry–based proteomics. Nat. Methods 14(5): 513-520. [DOI] [PMC free article] [PubMed] [Google Scholar]
- 25.Li Q., Armstrong Z., MacRae A., Ugrinov A., Feng L., Chen B., Huang Y., Li H., Pan Y., Yang Z., et al.(2023). Metal–Organic Materials(MOMs) Enhance Proteolytic Selectivity, Efficiency, and Reusability of Trypsin: A Time-Resolved Study on Proteolysis. ACS Appl. Mater. Interfaces 15(7): 8927-8936. [DOI] [PubMed] [Google Scholar]
- 26.Hubbell W. L., López C. J., Altenbach C. and Yang Z.(2013). Technological advances in site-directed spin labeling of proteins. Curr. Opin. Struct. Biol. 23(5): 725-733. [DOI] [PMC free article] [PubMed] [Google Scholar]
- 27.Pan Y., Li H., Li Q., Lenertz M., Zhu X., Chen B. and Yang Z.(2021). Site-directed spin labeling-electron paramagnetic resonance spectroscopy in biocatalysis: Enzyme orientation and dynamics in nanoscale confinement. Chem Catal. 1(1): 207-231. [Google Scholar]
- 28.Li Q., Pan Y., Li H., Lenertz M., Reed K., Jordahl D., Bjerke T., Ugrinov A., Chen B., Yang Z., et al.(2021). Cascade/Parallel Biocatalysis via Multi-enzyme Encapsulation on Metal–Organic Materials for Rapid and Sustainable Biomass Degradation. ACS Appl. Mater. Interfaces 13(36): 43085-43093. [DOI] [PubMed] [Google Scholar]
- 29.Li Q., Pan Y., Li H., Alhalhooly L., Li Y., Chen B., Choi Y. and Yang Z.(2020). Size-Tunable Metal–Organic Framework-Coated Magnetic Nanoparticles for Enzyme Encapsulation and Large-Substrate Biocatalysis. ACS Appl. Mater. Interfaces 12(37): 41794-41801. [DOI] [PMC free article] [PubMed] [Google Scholar]
- 30.Pan Y., Li Q., Li H., Farmakes J., Ugrinov A., Zhu X., Lai Z., Chen B. and Yang Z.(2021). A general Ca-MOM platform with enhanced acid-base stability for enzyme biocatalysis. Chem Catal. 1(1): 146-161. [Google Scholar]
- 31.Rick W.(1974). Trypsin. In: Methods of Enzymatic Analysis(Second Edition).(pp 1013–1024). Bergmeyer, H. U.(Ed.). Academic Press. [Google Scholar]
- 32.Pan Y., Li H., Li Q., Lenertz M., Schuster I., Jordahl D., Zhu X., Chen B. and Yang Z.(2021). Protocol for resolving enzyme orientation and dynamics in advanced porous materials via SDSL-EPR. STAR Protoc. 2(3): 100676. [DOI] [PMC free article] [PubMed] [Google Scholar]
- 33.Hubbell W. L., Cafiso D. S. and Altenbach C.(2000). Identifying conformational changes with site-directed spin labeling. Nat. Struct. Biol. 7: 735-739. [DOI] [PubMed] [Google Scholar]
- 34.Fleissner M. R., Brustad E. M., Kálai T., Altenbach C., Cascio D., Peters F. B., Hideg K., Peuker S., Schultz P. G., Hubbell W. L., et al.(2009). Site-directed spin labeling of a genetically encoded unnatural amino acid. Proc. Natl. Acad. Sci. U.S.A. 106(51): 21637-21642. [DOI] [PMC free article] [PubMed] [Google Scholar]
- 35.Pan Y., Li H., Farmakes J., Xiao F., Chen B., Ma S. and Yang Z.(2018). How Do Enzymes Orient When Trapped on Metal–Organic Framework(MOF) Surfaces?. J. Am. Chem. Soc. 140(47): 16032-16036. [DOI] [PubMed] [Google Scholar]
- 36.Kim C. H., Axup J. Y. and Schultz P. G.(2013). Protein conjugation with genetically encoded unnatural amino acids. Curr. Opin. Chem. Biol. 17(3): 412-419. [DOI] [PMC free article] [PubMed] [Google Scholar]
- 37.Jordahl D., Armstrong Z., Li Q., Gao R., Liu W., Johnson K., Brown W., Scheiwiller A., Feng L., Ugrinov A., et al.(2022). Expanding the“Library” of Metal–Organic Frameworks for Enzyme Biomineralization. ACS Appl. Mater. Interfaces 14: 51619-51629. [DOI] [PubMed] [Google Scholar]