Abstract
Efficient energy storage and conversion is crucial for a sustainable society. Battery-supercapacitor hybrid energy storage devices offer a promising solution, bridging the gap between traditional batteries and supercapacitors. In this regard, metal–organic frameworks (MOFs) have emerged as the most versatile functional compounds owing to their captivating structural features, unique properties, and extensive diversity of applications in energy storage. MOF properties are governed by the structure and topological characteristics, which are influenced by the types of ligands and metal nodes. Herein, MOFs based on pyridine 3,5-dicarboxylate (PYDC) ligand in combination with copper and cobalt are electrochemically analyzed. Owing to the promising initial characterization of Cu-PYDC-MOF, a battery supercapacitor hybrid device was fabricated, comprising Cu-PYDC-MOF and activated carbon (AC) electrodes. The device showcased energy and power density of 17 W h kg −1 and 2550 W kg −1, respectively. Dunn's model was employed to gain deeper insights into the capacitive and diffusive contributions of the device. With their performance and versatility, the PYDC-based MOFs stand at the forefront of energy technology, ready to power a brighter future for upcoming generations.
Battery–supercapacitor hybrid: merging of battery and supercapacitor electrodes for hybrid energy storage devices.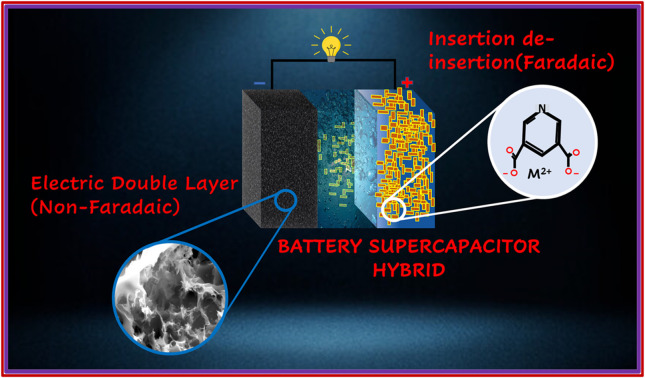
1. Introduction
Continuous development pushes the world towards more consumption of fossil fuels, which makes us think about a systematic transition towards more sustainable green energy resources.1 The future of green energy is correlated with the advances in energy storage devices (ESDs) with the capability of delivering energy on demand.2 Currently, supercapacitors (SCs) are in the spotlight for their exceptional power density, rapid charging and discharging capabilities, and extended cycling endurance. However, the low energy density of SCs leads us to search for the electrode materials that satisfy the need for power along with high energy.3 In this regard, combining a battery with a supercapacitor in a single device emerged as a resurrect that works by merging the (non-faradaic) capacitive electrode with a (faradaic) battery type electrode. Various materials are explored for energy applications, and they performed well but oxides have poor electrical conductivity, phosphates have low cyclability, and sulfides show low stability, which lead to discontinuity in their use as electrode material in SCs. However, because of their low cost and better catalytic activity, they showed the best performance in batteries.4,5
Metal–organic frameworks (MOFs), a novel category of porous materials, consisting of metal nodes and organic ligands, have garnered significant attention from researchers over the past two decades due to their potential for various applications. MOFs are a promising class of crystalline organic-inorganic hybrid materials. They exhibit high absorbency and provide abundant catalytic sites due to their unique and porous structure. MOFs consist of metal ions interconnected by organic ligands through coordination bonds, which allows for the possibility of pore structure engineering.6 While the judicious selection of specific ligands directs the formation of specific MOFs leading to a plethora of applications, such as in energy storage, selective gas adsorption and separation, hydrogen storage, sensors, and drug delivery. Keeping this in view, MOFs could be suitable contenders as electrode materials for rechargeable batteries and electrochemical capacitors and as electrolytes for electrochemical devices.
It has also been observed that pristine MOFs provide exceptionally high diffusion because of the large number of active centers. In recent studies, it has been observed that uniform and robust shaped cobalt MOFs have exhibited a capacitance of around 200 F g−1 in the electrolyte solution of LiOH.7 Similarly, in the case of copper (Cu), multiple oxidation states, and conductivity make it fit for different MOFs.8,9 It is also worth mentioning that the ligand metal coordination in MOFs plays a vital role in enhancing the performance of energy storage devices.10 Among the high diversity of ligands, pyridine 3,5-dicarboxylate (PYDC) has been electrochemically analyzed in this study. Containing two carboxylate groups, the PYDC coordinates with the metal center through nitrogen atoms resulting in the formation of chelating rings.11,12 The carboxylic group also participates in bonding through oxygen atoms as bridging ligands leading to the extended structures that are important for energy storage applications.13
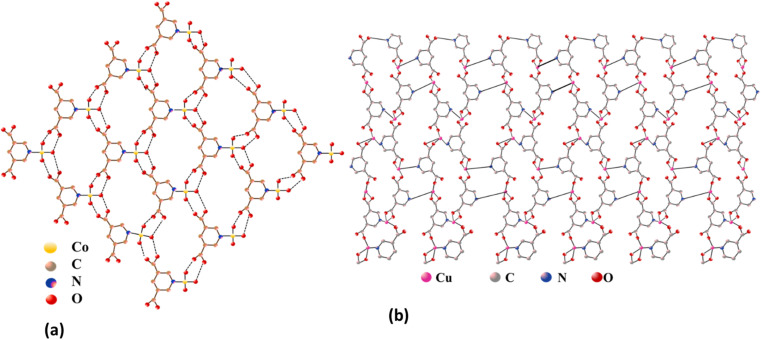
The structural analysis conducted by Yi-Long Lu et al. reveals distinct coordination geometries in Co-PYDC and Cu-PYDC frameworks. In the case of Co-PYDC having chemical formula C12H8CoN2O4, the Co(ii) ion coordinates with one nitrogen atom from a 3,5-PYDC ligand and five water molecules, forming discrete octahedral geometries. These structures assemble into 2D layers along the ab plane with a 63 topology, interconnected through hydrogen bonds as shown in Fig. 1a. Along the c-axis, these layers adopt an ABAB packing order, stabilized by O–H⋯O hydrogen bonding interactions between the layers. Conversely, in Cu-PYDC with chemical formula C12H8CuN2O4, the Cu(ii) centers exhibit a coordination environment involving one monodentate carboxylate, one chelated carboxylate, and one pyridyl nitrogen from distinct 3,5-PDC ligands, along with two pyridine molecules. The CuN3O2 core represents a square pyramidal geometry, where the Cu1–O1 bond is notably weak, exhibiting semi-coordinated behavior. The structure manifests an unprecedented 2D sheet architecture with a 4.82 topology, revealing hydrophilic channels housing guest water molecules, as shown in Fig. 1b. These sheets, when observed along the axis, stack in an eclipsed manner, creating the framework with interleaved layers held together by the interlayer π–π interactions between the adjacent pyridine molecules.14,15
Fig. 1. Structures of (a) Co-PYDC (octahedral geometry) and (b) Cu-PYDC (square pyramidal geometry).
Herein, Co-PYDC and Cu-PYDC MOFs were prepared by the sonochemical method. Synthesized MOFs were then analyzed through X-ray diffraction (XRD) and scanning electron microscopy (SEM). A three-electrode assembly was utilized to gain in-depth information about electrochemical processes and best best-performing MOFs were utilized to fabricate a hybrid supercapacitor with activated carbon (AC). The comparative analysis of these MOFs presents a novel perspective on their potential utilization to meet the energy demands of the future by integrating them into ESDs.
2. Experimental studies
2.1. Chemicals employed
In this study, pyridine 3,5-dicarboxylate acid (PYDC, 99.99% pure), Co (NO3)2·6H2O, and dimethylformamide (DMF, 99.99%) were received from Sigma-Aldrich and were used as-received without additional processing. Whereas the platinum counter electrode and Hg/HgO served as reference electrodes.
2.2. Materials synthesis
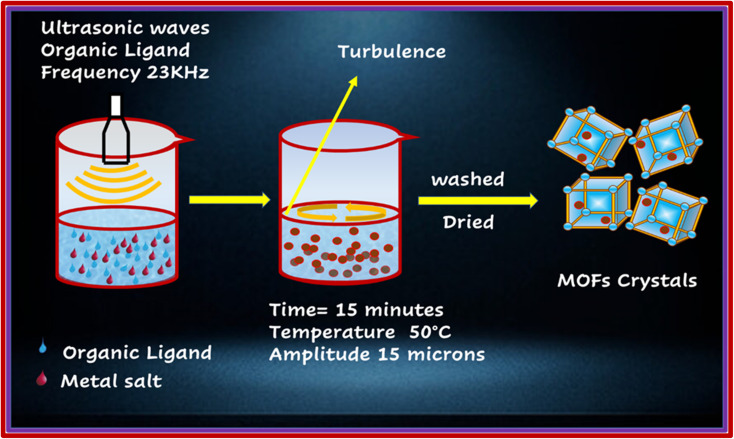
The above-mentioned MOFs were synthesized through the process of sonication, as shown in Fig. 2.16 PYDC (41.7 mg, 0.25 mmol) was dissolved in a 5 mL mixture of DMF and H2O (30 : 70 v/v) in two separate beakers. Thereafter, equivalent amounts of cobalt acetate and copper acetate monohydrate (49.91 mg, 0.25 mmol) were dissolved in 3 mL of the above mixtures. The Ligand and metal salt solutions were mixed with a dropwise addition of HCl and sonicated (MSE Sanyo, Soni prep 150) for 15 minutes at 15 microns amplitude and frequency of 23 kHz, followed by maintaining the temperature at 50 °C and providing slow evaporation. Dark blue needle-like crystals were obtained, which were then washed three times with DMF, DI water, acetone, and methanol, and then dried in the air.
Fig. 2. Schematic representation of sonochemical synthesis of MOFs.
2.3. Fabrication of the electrode material
For the preparation of the electrode material, a slurry comprising 75 wt% of the active material, 10 wt% of PVDF with NMP (solvent), and 15 wt% of acetylene black was prepared. The slurry was then stirred at 200 RPM overnight using a hot plate magnetic stirrer. The prepared solution was next deposited over a purified nickel foam having an area of 1 × 1 cm2. For purification, nickel foam was first washed with 0.3 M HCl solution in 50 mL of DI water, then it was successively cleaned with acetone, methanol, and DI water. Later on, it was dried at 70 °C for 3 hours. Furthermore, the fabricated electrode was dried in a muffle furnace at 90 °C for 8 hours. Whereas 1 M KOH as an electrolyte was used throughout the electrochemical measurements. The mass loading on the electrode was decided by the charge balance equation below: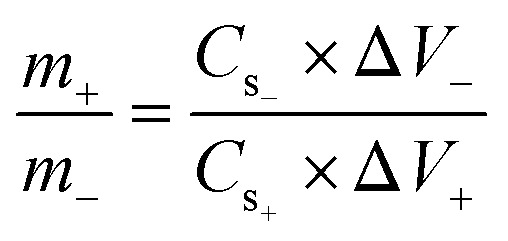 where m, Cs, and V denote the masses, capacitance, and potential window of the positive and negative electrodes. For experiments using three and two-cell assemblies, the same process was used to produce the electrodes. For three cell measurements, the mass of the Cu-PYDC MOF electrode was 4 mg. Additionally, for two electrode assemblies, the mass of the activated carbon used was 8 mg.
2.4. Material characterization
XRD and SEM techniques were employed to obtain insights into the structure and morphology of the respective MOFs. Furthermore, the electrochemical analysis was conducted using both, the three-electrode configuration and the two-electrode setup, with a potentiostat electrochemical analyzer.17
3. Results and discussion
3.1. Structural characterization
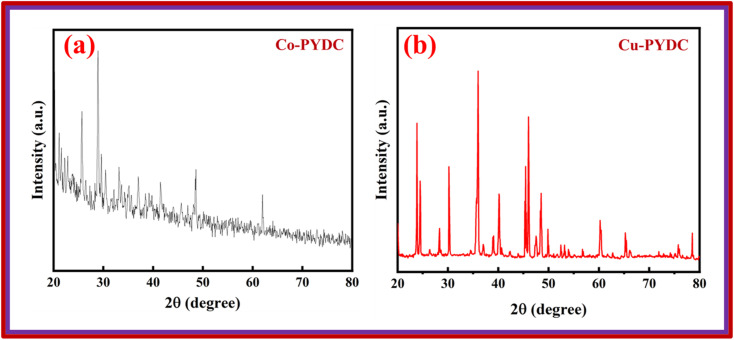
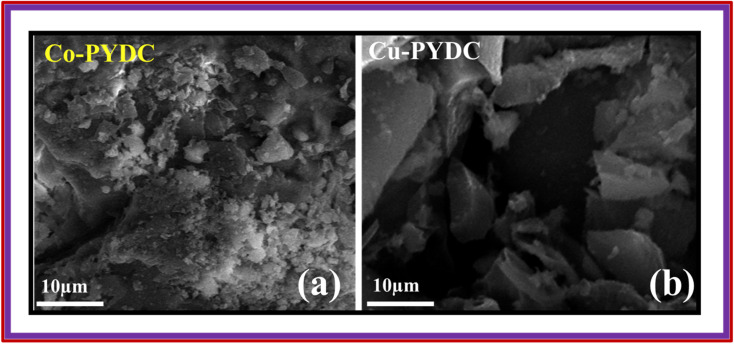
XRD analyses of the samples were performed using the Proto XRD system. The evaluations were performed using the Bragg–Brentano (θ–2θ) scanning technique, employing a monochromatic Cu-Kα radiation source operating at 40 kV acceleration voltage and 25 mA tube current, all this process was conducted at room temperature. The goniometer systematically scanned a 2θ range spanning from 15° to 80°, employing a step size of 0.05°. To ensure the reliability of the results, XRD analyses were repeated three times to verify the consistency and repeatability of the outcomes. This approach was employed to unveil crucial structural information concerning the deposited materials. The XRD pattern for Co-PYDC is presented in Fig. 3a. XRD analysis of the sample revealed (111), (200), (211), (220), (311), (222), (330), and (420) intense diffraction peaks centered at 2θ of 23.7°, 30.1°, 35.1°, 40.3°, 48.5°, 49.8°, 60.3°, and 65.2° respectively. The peaks well matched with those of the reference (JCPDS no. 43-1003). The XRD pattern for Cu-PYDC is presented in Fig. 3b. The sample revealed (111), (211), (311), (320), and (125) intense diffraction peaks at 2θ of 13.2°, 20.1°, 25.7°, 28.9°, and 48.6°, respectively.13,18 The morphological characteristics of both MOFs were examined using SEM in which crystal structures were observed and are shown in Fig. 4a and b.
Fig. 3. XRD patterns of (a) Co-PYDC MOF and (b) Cu-PYDC MOF.
Fig. 4. SEM images of (a) Co-PYDC MOF and (b) Cu-PYDC MOF.
3.2. Three-electrode electrochemical analysis (CV/GCD/EIS)
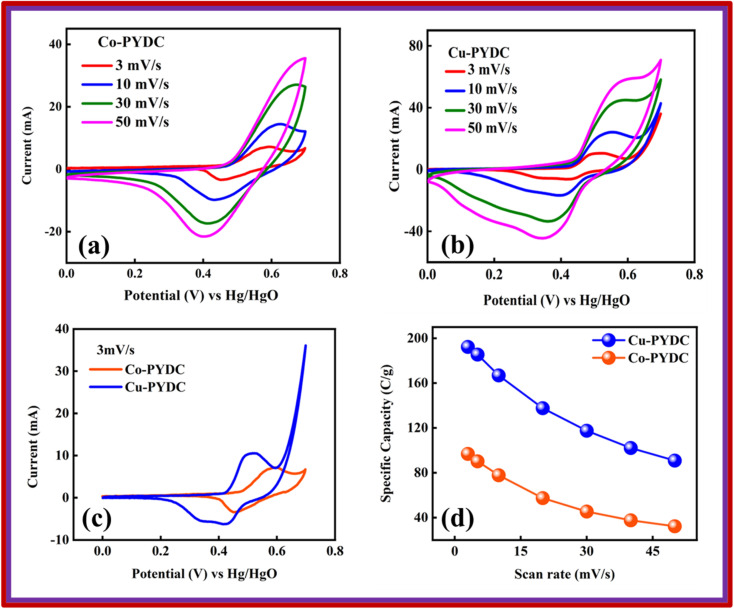
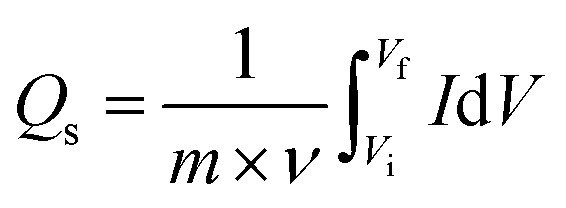
Co-PYDC and Cu-PYDC MOFs were subjected to electrochemical analysis via cyclic voltammetry (CV), galvanostatic charge/discharge (GCD) measurements, and electrochemical impedance spectroscopy (EIS), using a three-electrode electrochemical system.19,20 The CV measurements were conducted for both electrodes at sweep rates of 3, 10, 30, and 50 mV s−1 as displayed in Fig. 5a and b. CV spectra exhibited a consistent balance between electron uptake and release processes at a sweep rate of 3 mV s−1 for both the MOFs while more prominent peaks in the case of Cu-PYDC MOF at a sweep rate of 50 mV s−1 showed a change in the electrochemical state of the analyte at the electrode surface with more oxidation and reduction of the active species in the solution. Higher potentials indicated the dominating charge storage mechanisms to be diffusion-controlled, while at lower potentials a capacitive process was dominating.21,22 The CVs of Co-PYDC and Cu-PYDC-MOFs were compared at a sweep rate of 3 mV s−1 having a potential window of 0.7 V, as shown in Fig. 5c validating that the more electrolytic ions transfer inside the active pores in case of Cu-PYDC with definite peaks in a region along with area under the curve. Specific capacity (Qs) values are derived from the CV spectra using the following equation:
 |
1 |
where the area under the CV curve is represented by ∫IdV, denoting the potential window set at 0.7 V, ν is the scan rate (mV s−1). Fig. 5d shows the variation of Qs of 97 C g−1 for Co-PYDC and 192 C g−1 for Cu-PYDC. A decreasing trend in capacity values as the faster ion flow at higher sweep rates was observed. At higher scan rates the surface effects dominate giving less time for the faradaic changes involving the electrode surface, as for the surface processes, the current response varied directly with ν, which was indictive of weaker interactions between ions and the electrode material.23 Furthermore, the equation used for the Qs calculation from GCD is:
 |
2 |
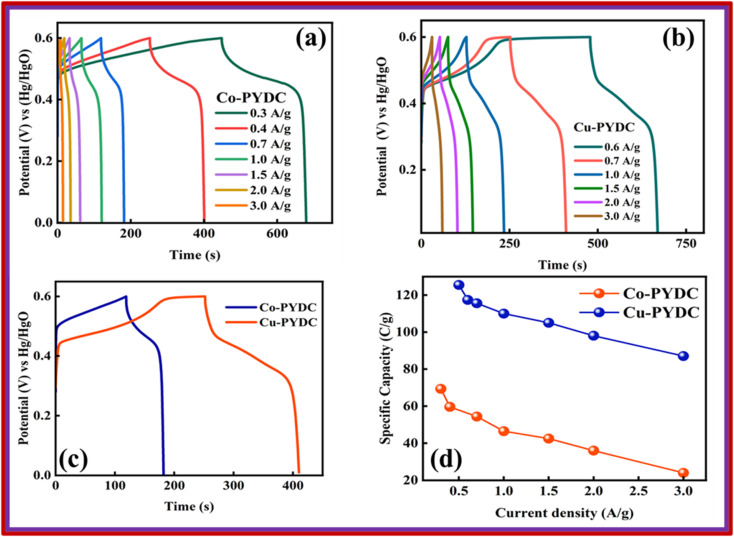
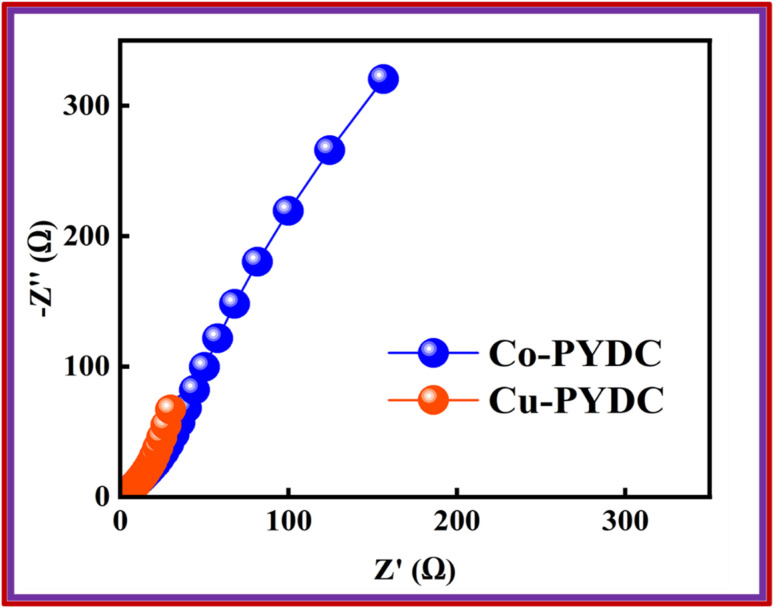
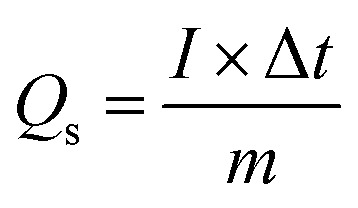
In this equation, I represent the current (A), while ΔV represents the potential window, and Δt represents the discharge time. The GCD of the specified MOFs at various current densities with a potential window of (0–0.7) V are shown in Fig. 6a and b. The nonlinear trend with humps shows the faradaic reactions occurring between ionic species of the electrolyte and the deposited material on the electrode. Fig. 6c shows the comparison of the GCD of both the MOFs at the current density of 0.7 A g−1, clearly showing the more prominent peak and the higher discharge time for Cu-PYDC. At any specified current density, the electrode with the greater capability to sustain the charge in it over an extended period without degradation will have a higher charge storage ability and thus the best performance material. The Qs of both MOFs were derived from the aforementioned equation and are compared at varying current densities, as depicted in Fig. 6d. Co-PYDC delivered Qs of 69 C g−1 at 0.3 A g−1while Cu-PYDC delivered maximum Qs of 122 C g−1 0.7 A g−1. At higher current density, the Qs and Cs showed a declining trend due to the following three phenomena, i.e., (1) limited ion diffusion (2) resistance and heating, and (3) structural changes. The decline is because of the minimization of the intercalation of ions by accumulating charges near the electrode surface, thereby decreasing the effective capacitance of the electrode.24 To better understand the electronic-ionic kinetics regarding the interfacial resistance and transfer of charge mechanisms, EIS was conducted across a frequency range spanning from 0.1–105 Hz. Fig. 7 represents the Nyquist plots for the Co-PYDC and Cu-PYDC-MOFs. In the classical Nyquist plot, a semicircular feature observed at high frequency is typically indicative of the absence of charge transfer resistance (RCT), indicating processes involving the transfer of charge at the electrode/electrolyte interface. Conversely, a low-frequency arch shows ion transport, reductive, and oxidative reactions occurring at the interfacial region of electrode/electrolyte, and ion intercalation. The real impedance values, located on the left side of the semicircle in the x-axis of the plot are commonly attributed to the equivalent series resistance (ESR) of the battery-supercapacitor hybrid. Co-PYDC MOF shows an ESR of 2.2 Ω while for Cu-PYDC MOF it was 0.4 Ω.
Fig. 5. CV for (a) Co-PYDC MOF and (b) Cu-PYDC MOF (c) comparison of the CV for Co-PYDC and Cu-PYDC MOFs at scan rate of 3 mV s−1 (d) specific capacity comparison for Co-PYDC and Cu-PYDC MOFs w.r.t. scan rate.
Fig. 6. GCD at different current densities for (a) Co-PYDC MOF (b) Cu-PYDC MOF (c) comparison of GCD for Co-PYDC and Cu-PYDC MOFs at a current density of 0.7 A g−1 (d) specific capacity comparison for Co-PYDC and Cu-PYDC MOFs w.r.t. current densities.
Fig. 7. Nyquist plots for Co-PYDC and Cu-PYDC-MOFs, respectively.
4. Battery-supercapacitor hybrid assembly
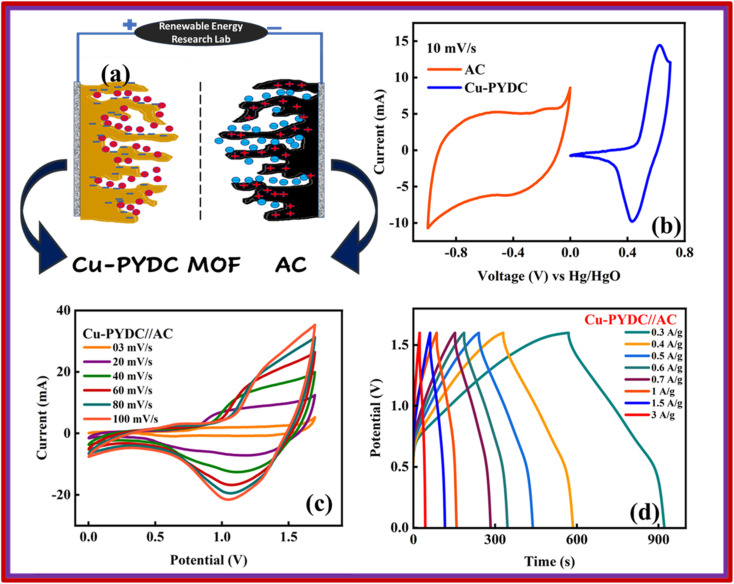
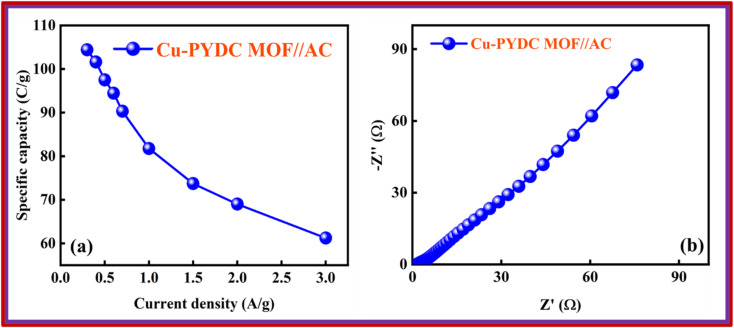
The best-performing MOF during all the electrochemical analysis in an electrode setup was then utilized in the two-electrode setup to fabricate the battery-supercapacitor hybrid assembly by combining AC as the negative electrode and Cu-PYDC MOF as the positive electrode, as illustrated in Fig. 8a. Before the device fabrication, the CV was performed on Cu-PYDC MOF at a scan rate of 10 mV s−1, and the results were compared to AC, as shown in Fig. 8b. AC was operated with a potential voltage spanning from (0 to −1) V. While Cu-PYDC MOF was operated at an operational voltage from 0 to 0.7 V. The CV plot from 3 mV s−1 to 100 mV s−1 is shown in Fig. 8c. The graph depicts the rectangular region (AC) and the characteristic redox peaks (Cu-PYDC MOF) indicative of a hybrid nature. The CV further reveals the device's ability to maintain the curve symmetry even at higher scan rates, showcasing its better rate performance. The fabricated device exhibited reliable and stable performance within the working potential range of (0 to 1.7) V. In addition to the discernible humps and rectangular shape, the CV plot serves as a depiction of the existence of both capacitive and charge transfer reactions. The GCD curves for battery supercapacitor hybrid are demonstrated in Fig. 8d. The hybrid device shows a non-linear nature incorporating both faradaic and non-faradaic phenomena. Fig. 9a shows the Qs of 105 C g−1at 0.3 A g−1, and the trend at higher current density was calculated using the GCD curves. Capacity retention at the high current density of 3 A g−1 shows the better electrochemical performance of the hybrid device.
Fig. 8. (a) Systematic illustration of the fabricated devices for Cu-PYDC MOF//AC (b) CV comparison of AC and Cu-PYDC MOF at 10 mV s−1 (c) CV of Cu-PYDC MOF//AC from 3 mV s−1 to 100 mV s−1 (d) GCD curve of Cu-PYDC MOF//AC at different current densities.
Fig. 9. (a) Specific capacity vs. current density for Cu-PYDC MOF//AC (b) Nyquist plot for the Cu-PYDC MOF//AC.
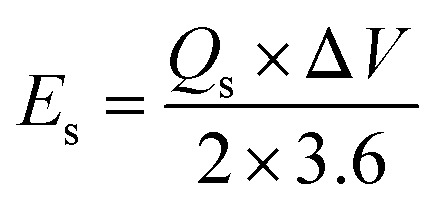
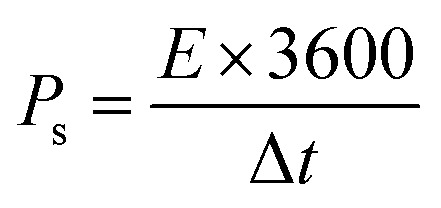
The conductivity of the device was thoroughly examined through EIS measurements.25 The Nyquist plot was employed as a comprehensive technique for determining the ESR values.26 The obtained results revealed that the device exhibited a small ESR value of 1.7 Ω, as shown in Fig. 9b. The specific energy and specific capacity of the battery supercapacitor hybrid were calculated as:
 |
3 |
 |
4 |
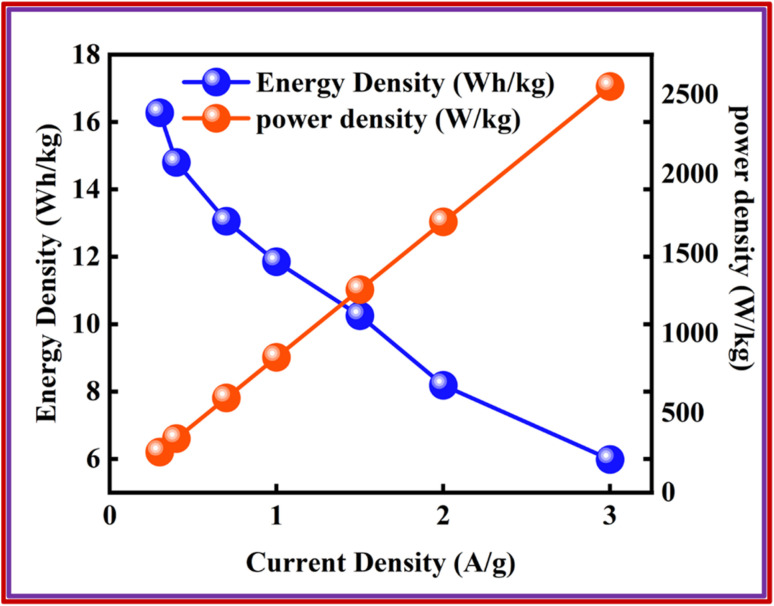
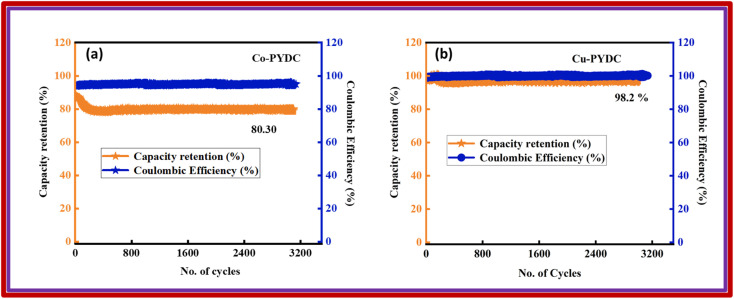
Here, ‘Es’ signified specific energy (W h kg−1), and ‘Ps’ specified specific power (W kg−1). The Ps and Es of the device were also calculated at distinct current densities.23 The device exhibited an Es of 17 W h kg−1, while Ps was 2550 W kg−1, as depicted in Fig. 10, thus showing a better response of the fabricated device. Despite the less favorable other parameters, the stability of the devices fabricated utilizing Co-PYDC and Cu-PYDC was assessed through a two-electrode assembly, subjecting them to 3000 continuous GCD cycles to evaluate their real-world performance. Fig. 11a and b distinctly illustrates that Cu-PYDC exhibits remarkable stability, retaining up to 98.2% of its capacity over consecutive cyclic charge–discharge cycles. This demonstrates that Cu-PYDC has exceptional endurance as an electrode material.
Fig. 10. Energy and power density of Cu-PYDC MOF//AC device.
Fig. 11. Capacity retention and coulombic efficiency plots with respect to the number of cycles for (a) Co-PYDC MOF//AC and (b) Cu-PYDC MOF//AC.
The charge storage chemistry infers both capacitive and charge transfer reactions, therefore, the current I(ν) produced due to both non-faradaic INF and faradaic reactions IF, is;
| I(ν) = INF + IF = k1ν + k2ν1/2 | 5 |
Here ν is the potential sweep rate while k2 and k1 are regression parameters, respectively. The k1ν characterizes capacitive behavior, while k2ν1/2 corresponds to diffusion-controlled processes.27
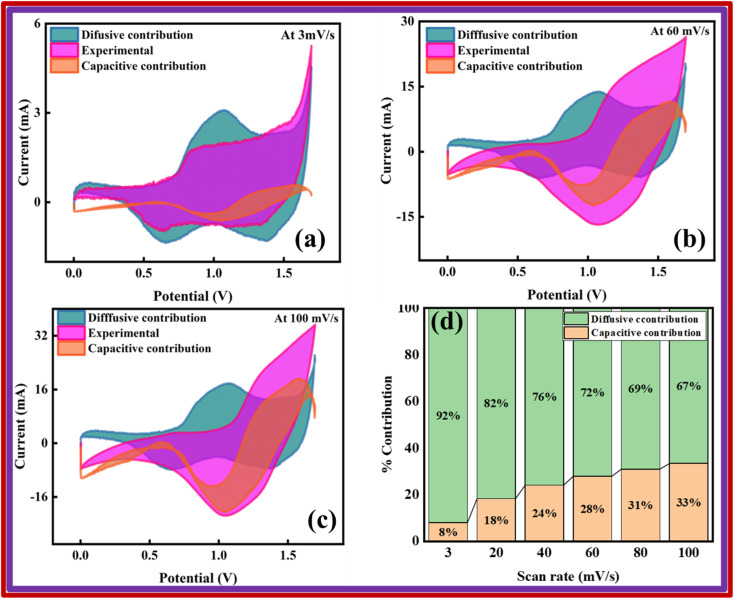
Also, Fig. 12a–c illustrates how much the capacitive and diffusive mechanisms take part in the total charge storage ability of the device at different scan rates (3, 60, and 100 mV s−1). At a scan rate of 3 mV s−1, the analysis revealed that the device displayed a capacitive behavior of 8%. As the scan rate increases, the capacitive contribution is further enhanced due to the fast kinetics of electrolyte ions, which does not provide them enough time to efficiently interact with the active material. At 60 mV s−1, a 28% capacitive contribution was observed, while the maximum capacitive contribution of 33% was observed at a scan rate of 100 mV s−1. The percentage of the capacitive and diffusive contributions is depicted in Fig. 11d. Furthermore, the analysis indicates that the diffusion-controlled contribution is dominated by the Cu-PYDC MOF electrode.28
Fig. 12. Capacitive and diffusive comparison for Cu-PYDC MOF//AC at a scan rate of (a) 3 mV s−1 (b) 60 mV s−1 (c) 100 mV s−1 (d) percentage of capacitive and diffusive contributions for Cu-PYDC MOF//AC.
5. Conclusion
In this study, pyridine 3,5-dicarboxylate (PYDC) based copper and cobalt MOFs were analyzed. Co-PYDC and Cu-PYDC MOF's initial characterization involved analytical methods, i.e., XRD and SEM. While electrochemical analysis was performed using a three-electrode assembly. Considering the better performance of Cu-PYDC MOF, a battery-supercapacitor hybrid device was assembled using Cu-PYDC MOF as the positive electrode and AC as the negative electrode material. The fabricated device demonstrated a Qs of 105 C g−1. The device also showed Es of 17 W h kg−1 and Ps of 2550 W kg−1. The results highlight the potential of PYDC-based MOFs as a promising electrode material for advanced ESDs.
Conflicts of interest
There are no conflict to declare.
Supplementary Material
Acknowledgments
This work was funded by the Researchers Supporting Project number (RSP2024R448), King Saud University, Riyadh, Saudi Arabia.
References
- Li Y. Zhu K. Jiang Y. Chen L. Zhang H. Li H. Yang S. Fuel Process. Technol. 2023;239:107558. [Google Scholar]
- Paitandi R. P. Wan Y. Aftab W. Zhong R. Zou R. Adv. Funct. Mater. 2023;33:2203224. [Google Scholar]
- Bhat S. A. Kumar V. Kumar S. Atabani A. Badruddin I. A. Chae K.-J. Fuel. 2023;337:127125. [Google Scholar]
- Iqbal M. Z. Aziz U. Abbasi U. Siddique S. Aftab S. Wabaidur S. M. Mater. Chem. Phys. 2023;301:127545. [Google Scholar]
- Iqbal M. Z. Khan M. W. Siddique S. Aftab S. Wabaidur S. M. J. Energy Storage. 2023;66:107333. [Google Scholar]
- Cong C. Ma H. Small. 2023:2207547. doi: 10.1002/smll.202207547. [DOI] [PubMed] [Google Scholar]
- Iqbal M. Z. Khan M. W. Shaheen M. Siddique S. Aftab S. Wabaidur S. M. Sharif S. Mater. Today Sustain. 2023;21:100286. [Google Scholar]
- Chameh B. Pooriraj M. Keyhan M. Moradi M. J. Mater. Sci.: Mater. Electron. 2023;34:1–13. [Google Scholar]
- Wang Z. Guo X. Dou W. Wang K. Mao F. Wu H. Sun C. J. Solid State Chem. 2020;289:121452. [Google Scholar]
- Iqbal M. Z. Aziz U. Siddique S. Aftab S. Wabaidur S. M. Mater. Sci. Semicond. Process. 2023;162:107511. [Google Scholar]
- Yan Y. Lin X. Ge J. Li X. Chem. Eng. J. 2023;468:143739. [Google Scholar]
- Zhang P. Wang M. Liu Y. Yang S. Wang F. Li Y. Chen G. Li Z. Wang G. Zhu M. J. Am. Chem. Soc. 2021;143:10168–10176. doi: 10.1021/jacs.1c03039. [DOI] [PubMed] [Google Scholar]
- Shaheen M. Iqbal M. Z. Khan M. W. Siddique S. Aftab S. Wabaidur S. M. Energy Fuels. 2023;37:4000–4009. [Google Scholar]
- Liu Y.-T. Du Y.-Q. Wu X. Zheng Z.-P. Lin X.-M. Zhu L.-C. Cai Y.-P. CrystEngComm. 2014;16:6797–6802. [Google Scholar]
- Cheansirisomboon A. Pakawatchai C. Youngme S. Dalton Trans. 2012;41:10698–10706. doi: 10.1039/c2dt31183f. [DOI] [PubMed] [Google Scholar]
- Borse R. A. Kale M. B. Hakke V. S. Pandi N. Sonawane S. H. Wang Y. Adv. Mater. Interfaces. 2023;10:2201933. [Google Scholar]
- Metherall J. Carroll R. Coles S. Hall M. Probert M. Chem. Soc. Rev. 2023:1995–2010. doi: 10.1039/d2cs00697a. [DOI] [PubMed] [Google Scholar]
- Süsse P. Acta Crystallogr. 1967;22:146–151. [Google Scholar]
- Starodubtseva A. A. Zhigalenok Y. S. Maldybaev K. M. Galeyeva A. K. Trussov I. A. Kurbatov A. P. RSC Adv. 2023;13:4880–4889. doi: 10.1039/d3ra00040k. [DOI] [PMC free article] [PubMed] [Google Scholar]
- Sun S. Huang M. Wang P. Lu M. J. Electrochem. Soc. 2019;166:A1799. [Google Scholar]
- Kumar R. Bag M. J. Phys. Chem. C. 2021;125:16946–16954. [Google Scholar]
- Xu G. Zhu C. Gao G. Small. 2022;18:2203140. doi: 10.1002/smll.202203140. [DOI] [PubMed] [Google Scholar]
- Zhao J. Zhang T. Ren J. Zhao Z. Su X. Chen W. Chen L. Chem. Commun. 2023;59:2978–2981. doi: 10.1039/d2cc07081b. [DOI] [PubMed] [Google Scholar]
- Luo Z. Liu L. Yang X. Luo X. Bi P. Fu Z. Pang A. Li W. Yi Y. ACS Appl. Mater. Interfaces. 2020;12:39098–39107. doi: 10.1021/acsami.0c09606. [DOI] [PubMed] [Google Scholar]
- Liu Y. Wang Z. Zhong Y. Tade M. Zhou W. Shao Z. Adv. Funct. Mater. 2017;27:1701229. [Google Scholar]
- Yan Y. Lin X. Xiao H. Li X. Electrochim. Acta. 2023;441:141808. [Google Scholar]
- Eskandari M. Malekfar R. Buceta D. Taboada P. Colloids Surf., A. 2020;584:124039. [Google Scholar]
- Pervez S. Iqbal M. Z. Small. 2023:2305059. doi: 10.1002/smll.202305059. [DOI] [PubMed] [Google Scholar]


