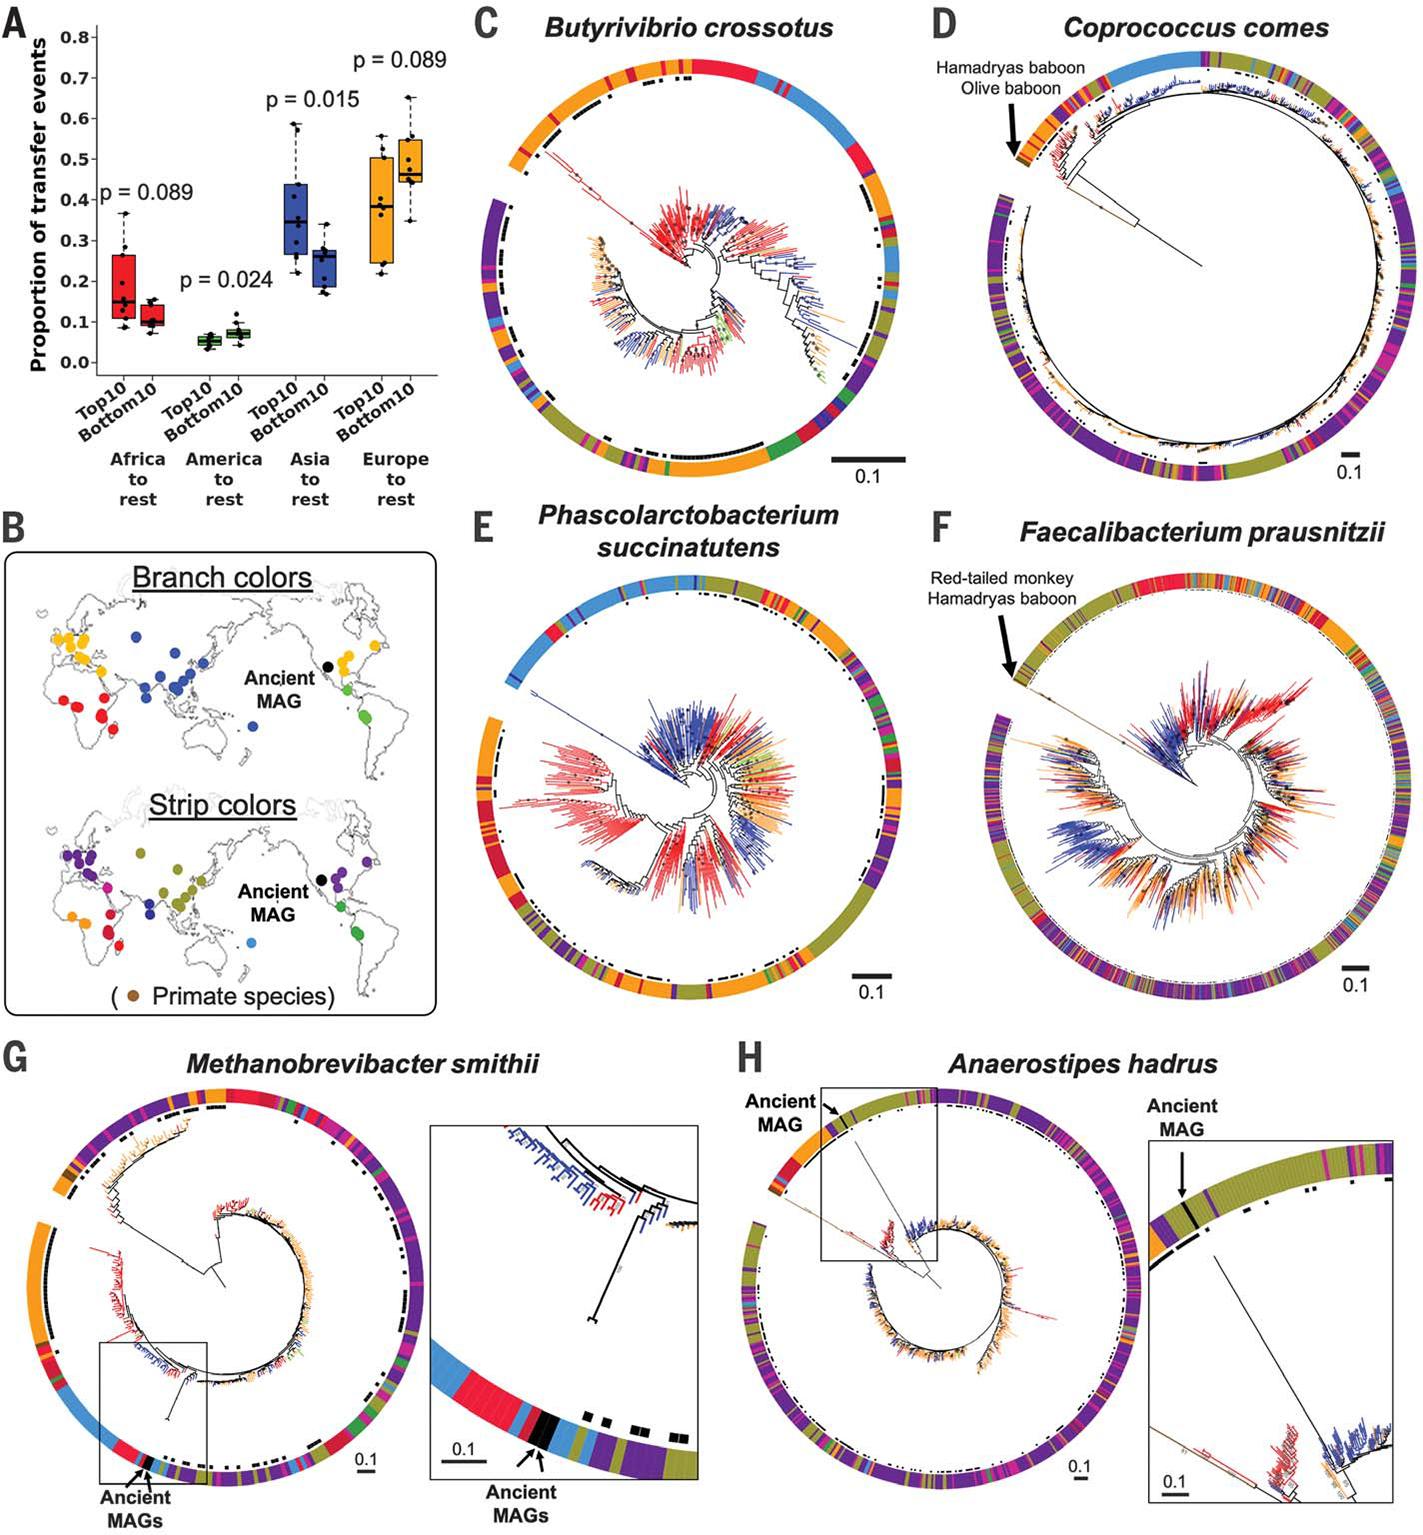
Fig. 3. Strain transfer events and microbial phylogenies including data from public metagenomes.

(A) Results from stochastic character mapping on microbial phylogenies including six countries from this study and public metagenomes. The boxplots compare the occurrence of transfer events between sampling regions between the top 10 and bottom 10 taxa identified by PACo ES. P values are based on the Wilcoxon rank sum test. (B) Sampling locations and color keys correspond to the panels that follow. The colors of the branches and outer color strip indicate the estimated host genetic structure based on sampling locations (21). Black dots next to the color strip indicate samples from the original six countries. Example phylogenies: (C) Butyrivibrio crossotus, where African strains are basal; (D) Coprococcus comes, where primate strains are basal, followed by African strains; (E) Phascolarctobacterium succinatutens, where Asian strains are basal; (F) Faecalibacterium prausnitzii, where strains from primates are basal, followed by strains from Asia. (G and H) Examples of microbial phylogenies with ancient MAGs recovered from paleofeces of Native Americans. Bootstrap values ≥50% are shown on branches. All trees were rooted at the midpoint. The scale bars show substitutions per site
