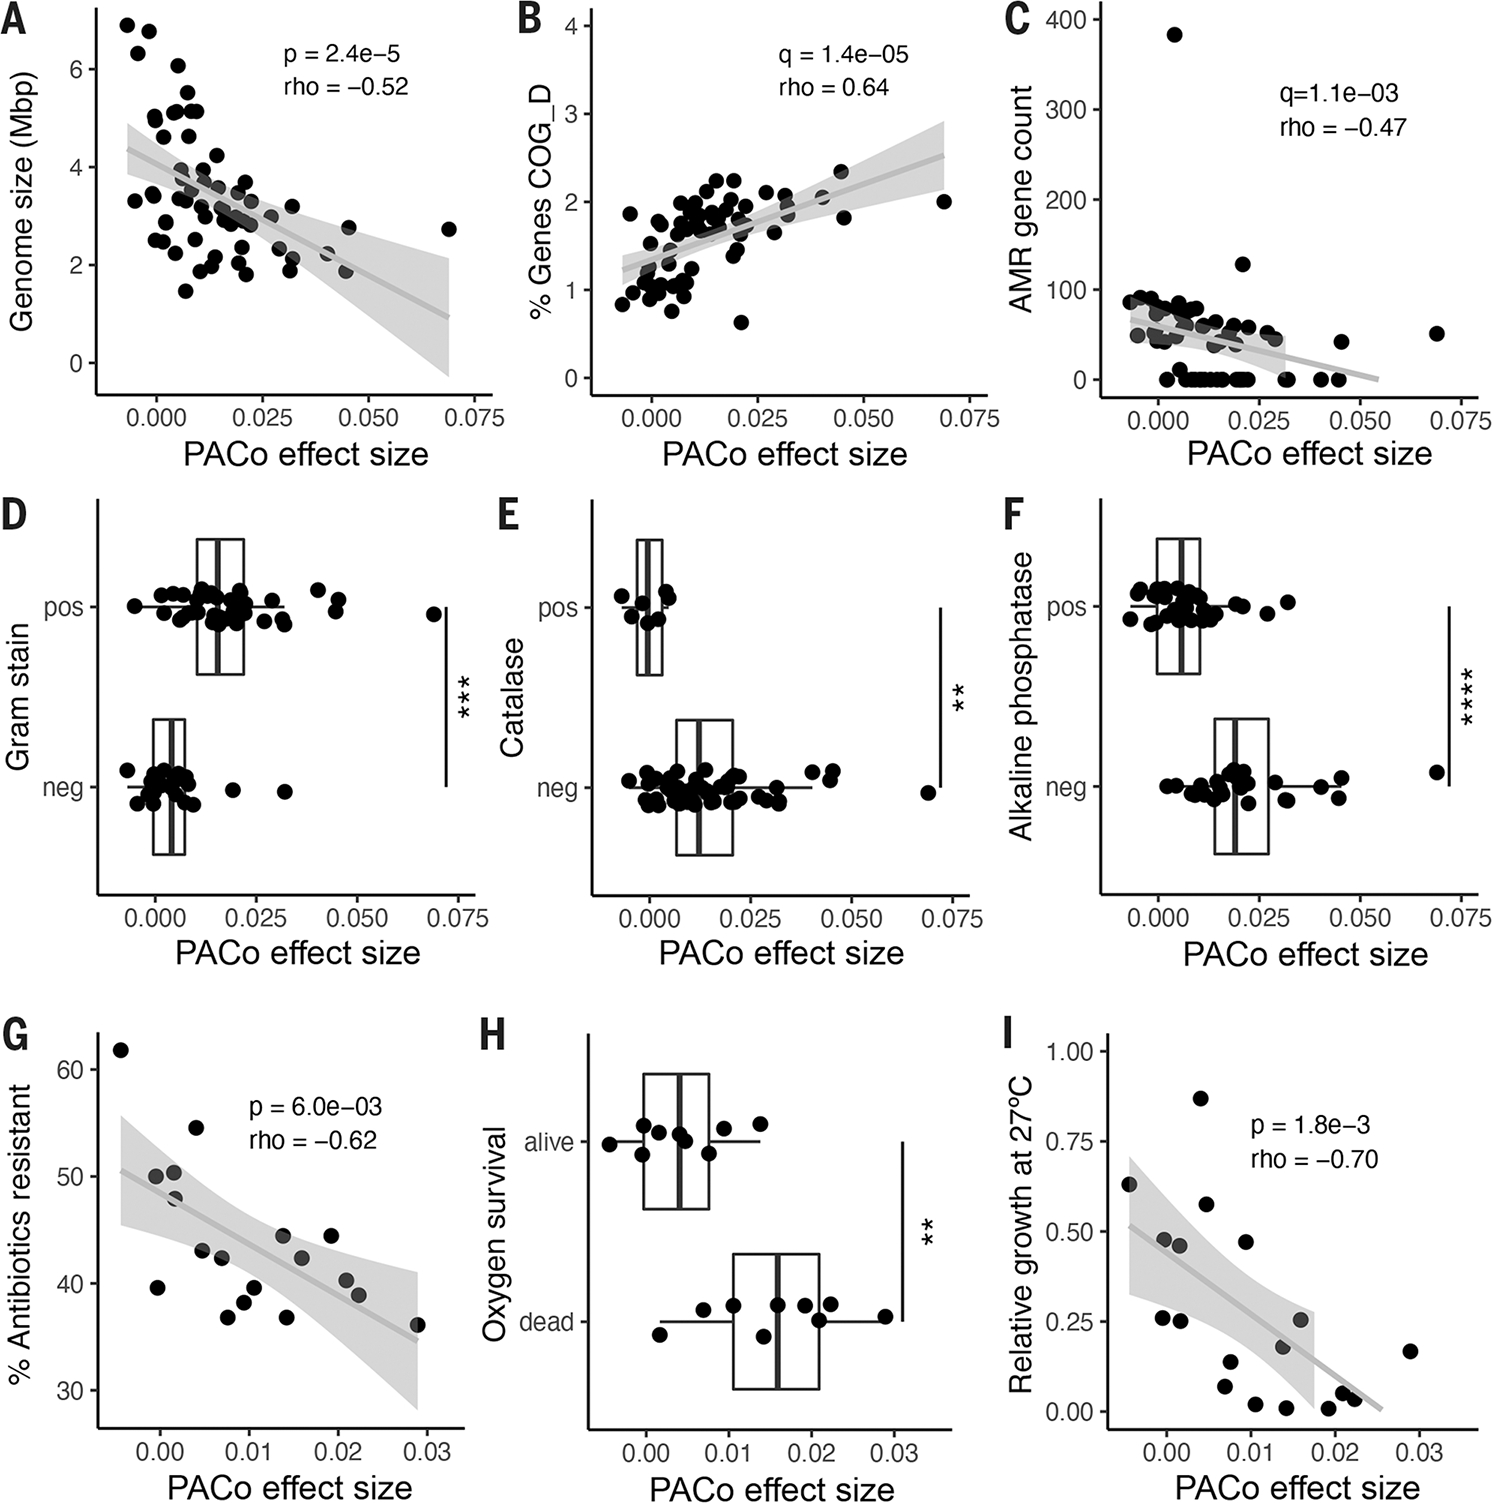
Fig. 4. Genomic and functional features correlated with codiversification.

PACo effect size correlated with: (A) Median genome size per species. (B) Percentage of total genes in the genome annotated to COG D for cell cycle and replication. (C) Number of antimicrobial resistance (AMR) markers annotated per genome. (D) Predicted Gram stain per species. (E) Predicted catalase activity per species. (F) Predicted alkaline phosphatase activity. (G) Percentage of antibiotics to which the species was resistant in vitro in a panel of 144 common antimicrobials. (H) Survival in vitro after 48 hours of O2 exposure for a subset of culturable species. (I) Relative growth of each species in vitro at 27°C compared with 37°C. (A) to (F): n = 59 species; (G) to (I): n = 18 species. Statistical significance was determined by Spearman’s correlation [(A) to (C), (G), and (I)] or by Wilcoxon rank sum test [(D) to (F) and (H)]. Exploratory analyses were corrected using FDR across all gene categories and predicted traits [q value; (B) to (F)]. pos, positive for the given trait; neg, negative for the given trait. **P < 0.01, ***P < 0.001, ****P < 0.0001. Exact P values are reported in table S18.
