

Abstract
Phase I trials inform on the initial safety profile of a new molecule and impact whether further development is pursued or not. Understanding the effect of non‐pharmacological factors on the variability of routine safety parameters could improve decision making in these early clinical trials, helping to separate signals related to the new molecule from background “noise.” To understand the impact of non‐pharmacological factors on routine safety parameters, we evaluated pooled safety data from over 1000 healthy participants treated with placebo in phase I trials between 2009 and 2018. The phase I participants were predominantly men, less than or equal to 50 years, White, and non‐Hispanic; and approximately an equal proportion had body mass index in the normal and overweight/obese range. Following administration of placebo, vital signs, electrocardiogram, and laboratory parameters remained near predose baseline values. Large changes from baseline were observed for many safety parameters, but these occurred in a relatively small number of participants. At least one adverse event (AE) occurred in 49.7% of participants receiving placebo in single ascending dose (SAD) studies and in 72.4% of participants receiving placebo in multiple ascending dose (MAD) studies, with headache being the most commonly reported AE (18.7% in SAD and 28.3% in MAD studies). Overall, these analyses are consistent with non‐pharmacological factors having a small impact on routine safety parameters in a phase I trial. The provided supplemental data may be used to contextualize the magnitude and frequency of abnormal safety values and AEs observed in phase I trials.
Study Highlights.
WHAT IS THE CURRENT KNOWLEDGE ON THE TOPIC?
The primary objective of early phase I clinical studies is often to define the safety profile of a new molecular entity following single and multiple dosing against a placebo control, using routine safety assessments. However, small sample sizes at each dose level can pose a challenge with interpreting out‐of‐range signals during ongoing data review of a blinded study.
WHAT QUESTION DID THIS STUDY ADDRESS?
This pooled analysis from 84 phase I studies evaluated variability and out‐of‐range outliers in common parameters used to evaluate the safety of a compound in early clinical development (i.e., vital signs, electrocardiogram, and safety laboratories) due to non‐pharmacologic factors, such as interparticipant differences and background variability, as well as evaluating the incidence of adverse events in the placebo control group.
WHAT DOES THIS STUDY ADD TO OUR KNOWLEDGE?
This study adds to, and expands on, the existing literature on the characterization of variability in routine safety parameters based on pooled data from placebo‐treated participants in phase I studies.
HOW MIGHT THIS CHANGE CLINICAL PHARMACOLOGY OR TRANSLATIONAL SCIENCE?
The results of this analysis can be leveraged to contextualize emerging findings in ongoing, blinded phase I studies as potentially non‐pharmacologic variability to assist study teams in the evaluation of the safety profile of new molecular entities in early clinical development.
INTRODUCTION
Phase I trials are the first clinical evaluations of an investigational new molecule. These studies, often conducted in healthy participants, 1 , 2 , 3 , 4 typically focus on the evaluation of an initial safety profile, which then informs on critical decisions for whether the molecule should continue clinical development or not. 5 Decisions for further investment in a molecule at this stage in development can be challenging, as the molecule's safety profile is based on experience in a relatively small number of participants and over relatively short durations of treatment. 6 However, inherent variability in commonly measured safety parameters (vital signs, electrocardiogram [ECG], or laboratory parameters) is known to exist due to interparticipant factors, such as gender, age, body mass index (BMI), or intraparticipant factors that may impact sampling conditions over time (e.g., diurnal variation and fed/fasted state). 7 , 8 , 9 Furthermore, because safety parameters are often repeatedly sampled over the duration of a study, the likelihood of variation over time leading to out‐of‐range values may increase in longer duration studies. Unanticipated variability in these non‐pharmacologic factors could confound the interpretation of the results within a trial and may lead to lack of confidence in the safety profile of the molecule and the desire for further investment.
By analyzing pooled data across multiple phase I studies in healthy participants treated with placebo, the contribution of these non‐pharmacologic factors to the variability in the safety dataset (i.e., the background “noise”) can be characterized given the larger sample size. Similar analyses of pooled placebo data from phase I studies have been published by other pharmaceutical companies in the literature. 10 , 11 , 12 To further understand the non‐pharmacologic variability in the safety profile of phase I studies, and to confirm and expand upon other published analyses, we analyzed the results of 45 single ascending dose (SAD), 24 multiple ascending dose (MAD), and 15 combined SAD/MAD studies initiated by Merck & Co., Inc., Rahway, NJ, USA, between 2009 and 2018. We selected randomized, blinded studies that enrolled healthy participants and summarized the baseline (pretreatment) characteristics of all participants in these studies, regardless of treatment allocation, and post‐treatment safety evaluations in participants treated with placebo only. Evaluated safety end points included adverse events (AEs) reported by the study participants, vital signs (heart rate [HR], systolic blood pressure [SBP], diastolic blood pressure [DBP]), common chemistry and hematology laboratory assessments, and ECG measures.
METHODS
Selection of studies for inclusion in analyses
Healthy participant data, including otherwise healthy overweight or obese participant data, from phase I SAD, MAD, or combination SAD/MAD studies that initiated between 2009 and 2018, were managed by Merck & Co., Inc., Rahway, NJ, USA, and had completed with a locked database, were selected (Table S1). All study intervention modalities and routes of administration were included; however, SAD and/or MAD studies (or study parts) containing patients were excluded. Studies that were fully outsourced to a clinical research organization and oncology studies were excluded. Participant data from SAD and/or MAD studies that did not include a placebo comparator arm were included in the predose baseline analysis but were excluded from the post‐placebo administration dataset. The placebo drug product administered in the placebo treatment arms is defined as per the individual protocols, however, all placebos are absent the active investigational drug. The extent to which the inactive ingredients/excipients compare between the placebo and the active drug product may differ between individual protocols/drug products.
All participants provided written informed consent to participate in the studies. The protocols were approved by the institutional review boards or independent ethics committees of the respective study centers. All studies were conducted in accordance with the guidelines on Good Clinical Practice and ethical standards for human experimentation established by the Declaration of Helsinki.
Statistical methods
All analyses were performed using the statistical software SAS (version 9.4; SAS Institute Inc). Because this investigation was not designed to test a specific hypothesis, the sample size was not determined based on statistical power calculations.
Baseline evaluation using “all participants randomized” population
Baseline (pretreatment) data of the complete dataset of healthy participants across the selected studies (2890 total participants across 84 studies), regardless of treatment allocation, were included in this dataset. The safety data parameters analyzed at baseline included the vital signs parameters of HR, SBP, and DBP; ECG parameters of PR, QRS, QT, and Fridericia's‐corrected QT intervals (QTcF); and standard hematology and chemistry laboratory parameters. In all studies, baseline values were defined as the value obtained closest to the initial dose of study intervention. The median value was used for baseline parameters with greater than or equal to three measurements. If fewer than three measurements existed for a baseline parameter, the single value obtained closest to dosing was included in the analyses.
Descriptive statistics were provided for each vital sign, ECG and laboratory parameter: number of studies (N), n (number of participants with non‐missing data), arithmetic mean (AM), standard deviation (SD), arithmetic percent coefficient of variation (calculated as 100*SD/AM), median, minimum, maximum, and percentiles (5%,10%, 25%, 75%, and 95%) were reported. Geometric mean and geometric percent coefficient of variation were only provided for the laboratory parameters that did not include a value of 0. For vital signs (HR, SBP, and DBP), summary statistics were computed for each parameter by position (resting vs. standing). Additionally, the orthostatic vital signs end points were summarized by first subtracting the median resting position values from the corresponding median standing position values. For the laboratory safety dataset, standard chemistry and hematology parameters were included as available in the individual datasets. All safety parameters were further summarized by gender (male vs. female) and by age (≤50 years vs. >50 years).
The proportion of outlier values for key safety parameters that may impact phase I study eligibility, and which met the following clinical thresholds at predose baseline were tabulated: QTcF greater than 500 ms, resting vital signs (SBP > 160 mmHg and < 90 mmHg, DBP > 90 mmHg and < 60 mmHg, and HR > 100 bpm and < 40 bpm), orthostatic decreases in SBP and DBP greater than 20 and 40 mmHg, respectively, and orthostatic HR increases greater than 30 and greater than 60 bpm.
Post‐placebo evaluation using “all participants treated” population
To characterize the distribution of routine safety parameters over time in healthy participants randomized to placebo, ECG, vital signs, and routine safety laboratory parameters obtained following administration of placebo in the fasted state in SAD and MAD studies, or combination SAD/MAD studies, were analyzed (1070 total participants across 82 studies). If an SAD study administered placebo in the fasted state in repeat treatment periods, only the data obtained from the first administration of placebo were included in the analysis.
Separately for each of the ECG and vital signs parameters, the measurements were categorized into the following time intervals: predose baseline to less than or equal to 4 h, greater than 4 to less than or equal to 8 h, greater than 8 to less than or equal to 12 h, greater than 12 to less than or equal to 16 h, and greater than 16 to less than or equal to 24 h. The value associated with the timepoint closest to the later bound of each time interval was included in the analysis. For each interval, the number of participants with non‐missing data, AM, SD, median, and range were tabulated. Additionally, summary statistics for change from predose values for each time interval were calculated.
For each of the laboratory parameters, summary statistics, as described above, were provided for baseline and 24‐h postdose values, with day 1 data only pooled across SAD studies and MAD studies. Additionally, for the MAD studies, summary statistics for baseline and 24‐h post last placebo dose were also provided.
The proportion of the participants that exceeded predetermined thresholds for key safety parameters that may be of clinical concern during safety monitoring of phase I clinical trials following placebo administration were also tabulated: QTcF greater than 500 ms, change from baseline in QTcF (>30 ms and > 60 ms), resting vital signs (SBP > 160 mmHg and SBP < 90 mmHg, DBP > 90 mmHg and DBP < 60 mmHg, and HR > 100 bpm and HR < 40 bpm), orthostatic decreases in SBP and DBP greater than 20 mmHg and 40 mmHg, respectively, from matching resting values, and orthostatic HR increases greater than 30 bpm and greater than 60 bpm from matching resting values. For this post‐treatment outlier analysis, a participant is counted only once for each parameter with values exceeding the threshold.
AE data from healthy participants administered with placebo in SAD and MAD studies were analyzed separately. The summary tables included all reported AEs regardless of causality as assessed by the investigator (whether regarded “definitely,” “probably,” “possibly,” “probably not,” or “definitely not” related). The most common AEs are defined as those occurring with an incidence of greater than 2%.
RESULTS
Selected SAD/MAD studies
A total of 84 studies were included in the predose baseline evaluation (45 SAD studies, 24 MAD studies, and 15 combined SAD/MAD combination studies. Of those, two studies did not have a placebo control arm and were therefore excluded from the post‐placebo evaluation resulting in a total of 82 studies in this dataset (45 SAD studies, 24 MAD studies, and 13 SAD/MAD combination studies). Table S2 provides a summary of the SAD/MAD clinical studies included in the baseline evaluation and post‐placebo datasets categorized by modality and therapeutic area, respectively. The majority of the clinical studies included in both datasets evaluated the safety and tolerability of small molecules (~83%), with the remaining studies (~17%) evaluating peptide or biologic compounds. The distribution of studies by therapeutic area was diverse; with greater than 50% of studies evaluating new molecular entities targeted for neuroscience or antiviral indications.
Results for the “all randomized participants' population” – Baseline evaluation
Demographic characteristics
Table 1 presents the baseline characteristics for the entire healthy participant population (all participants, pre‐randomization, and regardless of treatment allocation). The baseline analyses included 2890 individuals, with approximately equal numbers participating in SAD (1562 [54%]) or MAD (1328 [46%]) studies. As expected, based on typical eligibility requirements for phase I studies, male participants (90.5%) and participants less than or equal to 50 years of age (86.8%) were the vast majority of the population. White race (91.0%) and non‐Hispanic ethnicity (94.6%) were also most common, reflective of the studies primarily being conducted in the United States and Europe. Of note, participants with a BMI in the range of 25 to 30 mg/kg2 and greater than 30 mg/kg2 account for ~50% of the population due to the inclusion of studies with otherwise healthy overweight and obese participants.
TABLE 1.
Baseline demographic characteristics in healthy participants (“all participants randomized” population).
| SAD (No. of studies = 60) | MAD (No. of studies = 39) | Total (No. of studies = 84) | ||||
|---|---|---|---|---|---|---|
| n (%) | n (%) | n (%) | ||||
| Subjects in population | 1562 | 1328 |
2890 |
|||
| Gender | ||||||
| Female | 104 (6.7) | 171 (12.9) | 275 (9.5) | |||
| Male | 1458 (93.3) | 1157 (87.1) | 2615 (90.5) | |||
| Age (years) | ||||||
| ≤ 50 | 1401 (89.7) | 1108 (83.4) | 2509 (86.8) | |||
| > 50 | 161 (10.3) | 220 (16.6) | 381 (13.2) | |||
| Mean |
36 |
37 | 37 | |||
| SD |
11 |
12 | 12 | |||
| Median | 35 |
36 |
35 |
|||
| Range | 18 to 63 |
18 to 77 |
18 to 77 |
|||
| Race | ||||||
| American Indian or Alaska Native | 3 (0.2) | 2 (0.2) | 5 (0.2) | |||
| Asian | 24 (1.5) | 41 (3.1) | 65 (2.2) | |||
| Black or African American | 86 (5.5) | 68 (5.1) | 154 (5.3) | |||
| Native Hawaiian or Other Pacific Islander | 4 (0.3) |
0 (0.0) |
4 (0.1) | |||
| White | 1426 (91.3) | 1204 (90.7) | 2630 (91.0) | |||
| Multiple | 19 (1.2) | 12 (0.9) | 31 (1.1) | |||
| Unknown | 0(0.0) | 1 (0.1) | 1 (0.0) | |||
| Ethnicity | ||||||
| Hispanic or Latino | 102 (6.5) | 44 (3.3) | 146 (5.1) | |||
| Not Hispanic or Latino | 1458 (93.3) | 1277 (96.2) | 2735 (94.6) | |||
| Not reported | 1 (0.1) | 5 (0.4) | 6 (0.2) | |||
| Unknown | 1 (0.1) | 2 (0.2) | 3 (0.1) | |||
| Weight (kg) | ||||||
| <70 | 295 (18.9) | 304 (22.9) | 599 (20.7) | |||
| 70–100 | 1201 (76.9) | 953 (71.8) | 2154 (74.5) | |||
| >100 | 65 (4.2) | 62 (4.7) | 127 (4.4) | |||
| Missing | 1 (0.1) | 9 (0.7) | 10 (0.3) | |||
| Mean | 80 |
79.2 |
79.6 |
|||
| SD |
11.1 |
12.5 |
11.7 |
|||
| Median |
79.6 |
78.4 |
79.1 |
|||
| Range | 49.9 to 117.4 |
41.0 to 135.9 |
41.0 to 135.9 |
|||
| BMI (kg/m2) | ||||||
| < 18 | 4 (0.3) | 4 (0.3) | 8 (0.3) | |||
| 18 – <25 |
751 (48.1) |
681 (51.3) | 1432 (49.6) | |||
| 25–30 | 708 (45.3) | 522 (39.3) |
1230 (42.6) |
|||
| > 30 | 98 (6.3) | 112 (8.4) | 210 (7.3) | |||
| Missing | 1 (0.1) | 9 (0.7) | 10 (0.3) | |||
| Mean | 25.3 | 25.3 |
25.3 |
|||
| SD | 3.0 | 3.5 |
3.2 |
|||
| Median | 25.2 | 24.9 |
25.0 |
|||
| Range | 17.4 to 35.3 | 16.5 to 38.2 | 16.5 to 38.2 | |||
Note: Total = SAD + MAD (Studies with both SAD and MAD study parts are only counted once in the calculation of total number of studies).
Abbreviations: BMI, body mass index; MAD, multiple ascending dose; n, number of participants in each category; SAD, single ascending dose; SD, standard deviation.
Predose baseline – Vital signs, ECG, and laboratory parameters
Baseline resting vital signs are presented in Figure S1 and summarized in Tables S3 and S4. Although slight differences were observed between men and women and between participants less than or equal to 50 years and greater than 50 years, the values were generally similar across the gender and age groups. Similar baseline values across participant groups were also observed for ECG parameters (PR, QRS, QT, and QTcF; Figure S2, Tables S5 and S6) and routine laboratory values (Figure S3, Tables S7 and S8). Although a range of baseline values was observed for each of these vital signs (Table S3), ECG (Table S5), and laboratory parameters (Table S7), the 5% and 95% values fell within a narrow range, and extreme values were uncommon even below the 5% or above the 95% distribution. Furthermore, the proportion of participants that had one or more values at baseline that exceeded a predefined threshold of clinical interest in key safety parameters (QTcF, resting and orthostatic SBP, DBP, and HR) was less than or equal to 1% for most parameters assessed across all SAD/MAD studies, with the exception of resting DBP less than 60 mmHg (6%) and orthostatic HR increase (upon standing) greater than 30 bpm (5%; Table S9). This was likely a reflection of the healthy population who participated in these studies and eligibility criteria that would have excluded participants with clinically meaningful high or low values. Given the similarity in baseline values across gender and age, postdose analyses are presented with all participants grouped together.
Results for the “all participants treated” population – Post‐placebo evaluation
Demographic characteristics
Postdose analyses included the 1070 participants who were randomized to receive placebo in SAD (n = 787) and/or MAD studies (n = 283; Table S10). In general, the demographic characteristics of the healthy participants randomized to placebo followed similar trends as the total population at baseline. Approximately equal proportions of participants were included in the analysis with BMI in the overweight/obese range as compared to those with normal BMI.
Post‐placebo administration – Vital signs, ECG, and laboratory parameters
As monitoring of safety parameters was more frequent immediately following dosing, the available sample size for each measurement was generally higher at the earlier timepoints. Over the 24 h following day 1 dosing in both SAD and MAD studies, the mean HR, SBP, and DBP remained near predose baseline values (Figure 1, Tables S11 and S12), although some individual participants did have relatively large changes in these values (HR changes up to ±40 bpm, SBP changes up to ±40 mmHg, and DBP changes up to ±20 mmHg). A similar pattern was observed for the ECG parameters PR, QRS, QT, and QTcF (Figure 2, Tables S13 and S14). Comparing the mean values across discrete time intervals over the 24‐h postdose period on day 1 for both SAD and MAD studies, there was no strong evidence for the presence of circadian variability in vital signs or ECG parameters (Tables S11 and S13). Similarly, there was no meaningful difference in mean values in the 24‐h postdose period after the last day of dosing compared to the first day of dosing of placebo in the MAD studies (Tables S15 and S16).
FIGURE 1.
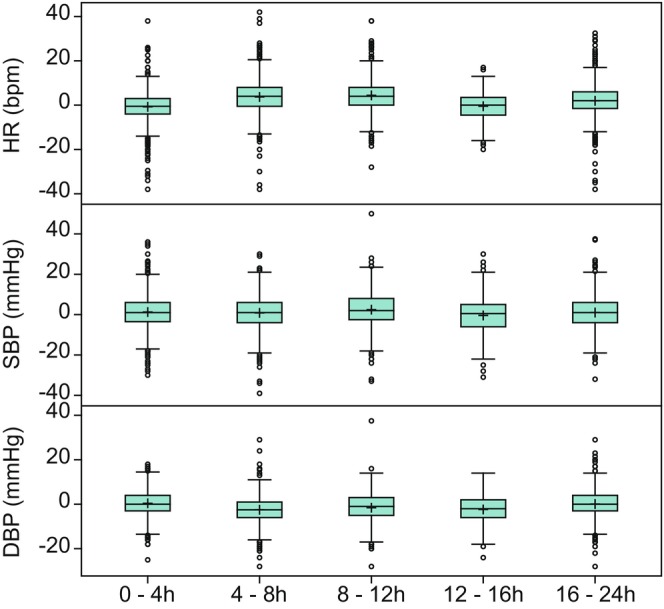
Change from predose baseline in vital signs over time following placebo administration on day 1 in SAD and MAD studies. DBP, diastolic blood pressure; HR, heart rate; MAD, multiple ascending dose; SAD, single ascending dose; SBP, systolic blood pressure. Top edge of the box represents 75% percentile (Q3). Bottom edge of the box represents 25% percentile (Q1). Interquartile Range (IQR) is Q3–Q1. + within the box represents the arithmetic mean. The horizontal line within the box represents median (50% percentile). The lower whisker represents minimum observation above the 1.5 (IQR) from Q1. The upper whisker represents maximum observation below the 1.5 (IQR) from Q3. Open circles represent observations that are more extreme than 1.5 (IQR) from Q1 or Q3.
FIGURE 2.
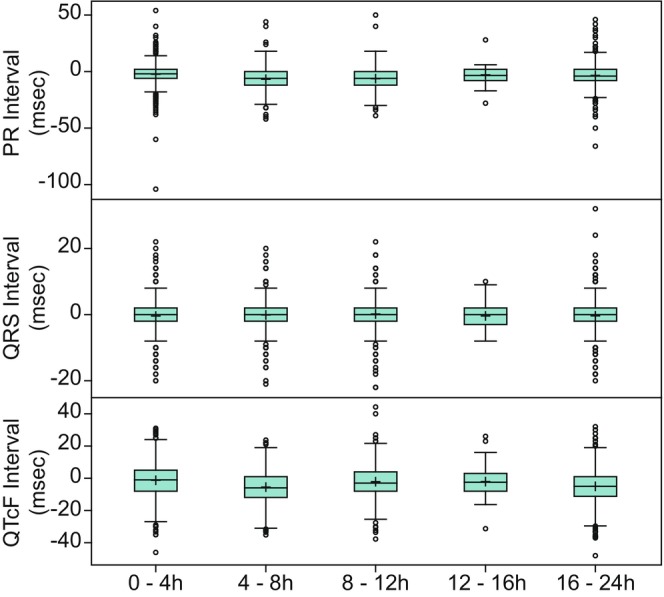
Change from predose baseline in ECG parameters over time following placebo administration on day 1 in SAD and MAD studies. ECG, electrocardiogram; MAD, multiple ascending dose; QTcF, Fridericia's‐corrected QT intervals; SAD, single ascending dose. Top edge of the box represents 75% percentile (Q3). Bottom edge of the box represents 25% percentile (Q1). Interquartile Range (IQR) is Q3–Q1 + within the box represents the arithmetic mean. The horizontal line within the box represents median (50% percentile). The lower whisker represents minimum observation above the 1.5 (IQR) from Q1. The upper whisker represents maximum observation below the 1.5 (IQR) from Q3. Open circles represent observations that are more extreme than 1.5 (IQR) from Q1 or Q3.
Postdose chemistry and hematology parameters were examined relative to baseline at 24 h following the final dose (Tables S17 and S18). Change from baseline for key laboratories for the monitoring of hepatic (aspartate aminotransferase and alanine aminotransferase), renal (creatinine) and hematological (hemoglobin, hematocrit, platelets, and leukocytes) toxicities are presented in Figure 3. As was observed with vital signs and ECG parameters, the mean postdose values remained close to baseline. Outlier values (>1.5 interquartile range) were uncommon but were observed for most of the laboratory parameters.
FIGURE 3.
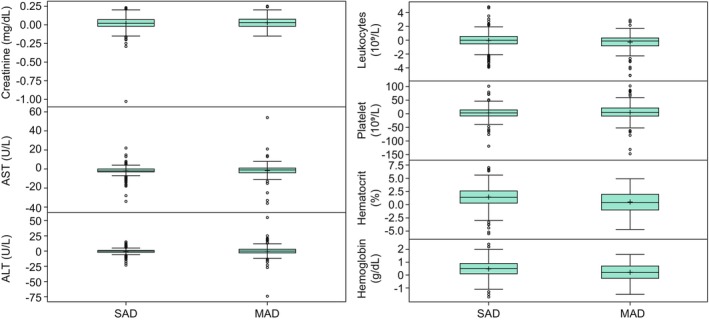
Change from day 1 predose and 24‐h post last dose for chemistry and hematology parameters. ALT, alanine aminotransferase; AST, aspartate aminotransferase; MAD, multiple ascending dose; SAD, single ascending dose. For Creatinine, change from Day 1 predose was 103.04 mg/dL for one participant in an SAD study. For leukocytes, change from Day 1 predose was 7503.45 10⁹/L for one participant and was 5833.01 10⁹/L for another participant in SAD studies. These values are suspected to be data entry errors and were removed from the plots for visualization purposes. Top edge of the box represents 75% percentile (Q3). Bottom edge of the box represents 25% percentile (Q1). Interquartile Range (IQR) is Q3–Q1. + within the box represents the arithmetic mean. The horizontal line within the box represents median (50% percentile). The lower whisker represents minimum observation above the 1.5 (IQR) from Q1. The upper whisker represents maximum observation below the 1.5 (IQR) from Q3. Open circles represent observations that are more extreme than 1.5 (IQR) from Q1 or Q3.
The proportion of participants that had one or more values that met a predefined threshold of clinical interest in key safety parameters (QTcF, resting and orthostatic SBP, DBP, and HR) following placebo administration are presented in Table 2. Similar to the predose values, the percentage of participants with one or more assessments meeting or exceeding these predefined thresholds was low (≤6%) for most parameters assessed across all SAD/MAD studies, with the exception of resting SBP less than 90 mmHg (21%), resting DBP less than 60 mmHg (43%) and orthostatic HR increase (upon standing) greater than 30 bpm (20%), which were notably higher following placebo administration compared to the comparable proportions at predose baseline of 1%, 6%, and 5%, respectively.
TABLE 2.
Proportion of outliers for key safety parameters in healthy participants following placebo treatment, based on clinical thresholds.
| SAD | MAD | Total | |
|---|---|---|---|
| Number of studies | 58 | 37 | 82 |
| Threshold | n/N (%) | n/N (%) | n/N (%) |
| QTcF ≥ 500 ms | 0/787 (0) | 0/283 (0) | 0/1070 (0) |
| QTcF change from baseline increase ≥30 ms | 8/787 (1) | 8/283 (3) | 16/1070 (1) |
| QTcF change from baseline increase ≥60 ms | 0/787 (0) | 0/283 (0) | 0/1070 (0) |
| Resting SBP > 160 mmHg | 2/787 (0) | 7/283 (2) | 9/1070 (1) |
| Resting SBP < 90 mmHg | 149/787 (19) | 73/283 (26) | 222/1070 (21) |
| Resting DBP > 90 mmHg | 38/787 (5) | 22/283 (8) | 60/1070 (6) |
| Resting DBP < 60 mmHg | 311/787 (40) | 147/283 (52) | 458/1070 (43) |
| Resting HR > 100 bpm | 4/787 (1) | 5/283 (2) | 9/1070 (1) |
| Resting HR < 40 bpm | 166/787 (21) | 80/283 (28) | 246/1070 (23) |
| Orthostatic SBP decrease >20 mmHg | 24/603 (4) | 23/215 (11) | 47/818 (6) |
| Orthostatic SBP decrease >40 mmHg | 2/603 (0) | 0/215 (0) | 2/818 (0) |
| Orthostatic DBP decrease >10 mmHg | 8/603 (1) | 12/215 (6) | 20/818 (2) |
| Orthostatic DBP decrease >20 mmHg | 2/603 (0) | 1/215 (0) | 3/818 (0) |
| Orthostatic HR increase >30 bpm | 106/603 (18) | 55/215 (26) | 161/818 (20) |
| Orthostatic HR increase >60 bpm | 1/603 (0) | 2/215 (1) | 3/818 (0) |
Note: Total = SAD + MAD. (Studies with both SAD and MAD study parts are only counted once in the calculation of total number of studies).
Resting includes the positions of recumbent, semi‐recumbent and sitting.
Abbreviations: DBP, diastolic blood pressure; HR, heart rate; MAD, multiple ascending dose; n, number of participants meeting the criteria; N, number of participants with non‐missing assessments post‐placebo; QTcF, Fridericia‐corrected QT interval; SAD, single ascending dose; SBP, systolic blood pressure.
Adverse events
At least one AE occurred in 49.7% of participants receiving placebo in SAD studies (Table S19) and in 72.4% of participants receiving placebo in MAD studies (Table S20). In the SAD studies, 201 different AE terms across 19 system organ classes (SOC), occurred among the 787 participants. In the MAD studies, 154 different AE terms across 16 SOC occurred among the 283 participants. Nearly all of the AEs reported in SAD or MAD studies following placebo administration were mild (grade 1) or moderate (grade 2) in intensity (Tables S21, S22, S23 and S24). Across all studies, five participants reported at total of five AEs that were classified as severe, which included vomiting, cartilage injury, tibia fracture, diarrhea, and increased blood creatine phosphokinase (n = 1 each).
The frequency of all AEs reported in the SAD and MAD studies are presented in Tables S19 and S20, respectively. Most AEs occurred in less than or equal to 2% of participants (97% of the AEs in SAD studies and 91% of AEs in MAD studies), therefore this threshold was chosen to represent the most common AEs that may be reported in a blinded clinical study setting in placebo treatment arms. AEs that occurred in greater than 2% of participants are displayed in Figure 4a (SAD) and Figure 4b (MAD). Only six AE terms in the SAD studies and only 14 AE terms in the MAD studies occurred in greater than 2% of participants. Headache was the most common AE in both SAD (18.7%) and MAD studies (28.3%) with 18% to 21% of the reported headaches (i.e., 3% of placebo‐treated participants in SAD studies and 6% in MAD studies) reported headaches of moderate intensity, with the remainder of the reported headaches being of mild intensity (Tables S22 and S24). All the AEs occurring in greater than 2% of participants in the SAD study also occurred in greater than 2% of participants in the MAD studies, which included nasopharyngitis (5% in SAD and 10.6% in MAD), oropharyngeal pain (3.3% in SAD and 3.9% in MAD), diarrhea (2.9% in SAD and 11% in MAD), nausea (2.9% in SAD and 4.2% in MAD), and fatigue (2.2% in SAD and 3.9% in MAD). The increase in frequency in these AE terms in the MAD studies relative to the SAD studies is likely due to the longer duration of participation for a given participant in an MAD study, thereby increasing the probability of experiencing one of these common AEs.
FIGURE 4.
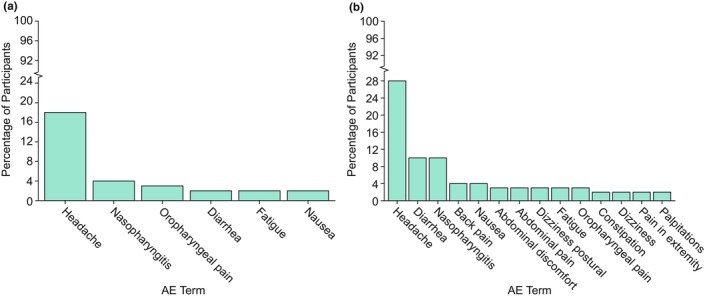
AEs occurring in greater than 2% of participants in (a) SAD and (b) MAD studies. AE, adverse event; MAD, multiple ascending dose; SAD, single ascending dose. Frequency, (number of participants reporting AE/total number of participants) x 100. Number of participants included in the analysis = 787. Adverse events were coded using the Medical Dictionary for Regulatory Activities (MedDRA) Version in effect at the time of individual study completion. If a participant experienced multiple adverse events with the same preferred term, the participant was counted only once for that preferred term.
DISCUSSION
Including placebo‐treated participants in phase I studies can help inform on changes or abnormal values attributable to intervention. However, dosing panels tend to include a relatively small number of participants per dosing level (8–12 participants), of whom 50% or fewer typically receive placebo. 6 Therefore, information provided from placebo‐treated participants in a single phase I study may be insufficient to clearly separate effect of drug from variation for a given safety finding. Furthermore, those performing clinical review of ongoing phase I studies are typically blinded to the participant's treatment group (placebo vs. drug) during a trial and are unable to leverage differences between frequency of findings or magnitudes of change in placebo and drug‐treated participants to inform on study decisions. In this setting, a robust characterization of variability in safety parameters, including central tendency and distribution, among healthy participants may be a highly useful dataset for clinical decision making during phase I development. Describing a typical range of changes and values among placebo‐treated healthy participants helps to contextualize observed parameters during a phase I study as within expected variability or not, even if the treatment of the participant is unknown.
This pooled analysis examined the vital signs, ECG, safety laboratory, and AE findings from placebo‐treated participants in a subset of phase I studies. Participant characteristics and baseline measurements prior to placebo administration were consistent with expectations for a healthy adult population and for phase I studies conducted primarily in the United States and Europe. Following dosing with placebo, mean values for the respective safety parameters remained near baseline; however, a small number of participants did experience relatively large increases or decreases in these measurements. Therefore, implementation of stopping rules related to extreme changes in phase I protocols seem generally appropriate, given that these occurrences are uncommon in placebo‐treated participants.
Variability in safety parameters due to differences between participants (such as gender, age, or BMI), or differences in sampling conditions over time (such as diurnal variation, or fed/fasted state), may confound the interpretation of safety parameters. In the present analysis, predose baseline values for vital signs, ECG, and safety laboratory parameters were similar for men and women and for participants less than or equal to 50 years and greater than 50 years of age. Furthermore, the time relative to dosing in the first 24 h for vital signs and ECGs did not seem to influence the trend in these measurements, indicating no effect of diurnal variation on these parameters. This is in contrast to the results from a longitudinal analysis of pooled placebo data from more than 1000 participants which used robust modeling techniques to quantitatively characterize the variability and impact of demographic characteristics, time, and circadian rhythms on cardiovascular measures. 12 As placebo was administered in the fasted state in all studies included in this analysis, the effect of food on the variability of the safety parameters could not be evaluated. Given these findings, it should be considered that observed trends in these measurements in an ongoing clinical study may be more likely attributable to intervention‐related effects rather than the time of day or the age or gender of the participants.
AEs were reported in about half of placebo‐treated participants in SAD studies and in about two‐thirds of placebo‐treated participants in MAD studies, yet only a small subset of AEs occurred in greater than 2% of placebo‐treated participants. The majority of the reported AEs were mild (grade 1) in intensity, with fewer moderate AEs (grade 2), and only a select few that were classified as severe (grade 3). Of the AEs that were classified as severe, most would likely not have been attributed to active treatment in a blinded study, such as tibia fracture or cartilage injury. However, a few of the reported severe AEs may confound the interpretation of the safety profile of the active treatment during a blinded trial, such as severe increased blood creatine phosphokinase and severe gastrointestinal complaints (i.e., diarrhea and vomiting).
Based on these results, certain mild to moderate AEs should be expected to occur commonly in phase I trials, irrespective of treatment intervention: headache, nausea, nasopharyngitis, oropharyngeal pain, diarrhea, and fatigue, with headache being the most commonly reported AE consistent with the results of other similar analyses. 10 , 11 , 13 Furthermore, headaches of moderate intensity may be expected to occur in 3% to 6% of participants on placebo, which equates to approximately one‐fifth of all reported headache AEs. Whether these more commonly occurring AEs were due to random occurrence or non‐treatment aspects of study participation is unknown. However, the increased incidence of headache in these phase I studies may be attributed to study‐specific dietary restrictions (i.e., fasting requirements, modified water intake, and reduced caffeine intake) or effects of the domiciling environment leading to reduced quality of sleep from frequent overnight study assessments, altered lighting, or disruptions from co‐domiciled participants. When other types of AEs occur with increased incidence in a blinded clinical study beyond these commonly reported AEs observed in this pooled placebo analysis, there should be increased suspicion that these are potentially related to the study intervention. The present analysis was not intended to compare responses in placebo‐ and active‐treated individuals but to examine findings in placebo‐treated individuals and identify signals that could be considered background in blinded phase I clinical trials, especially given that the different mechanisms of actions to which active participants were exposed would confound interpretation of these data. However, this supplementary investigation may be of interest for a future evaluation.
The findings in this set of analyses are generally consistent with observations from other similar pooled analyses of phase I data involving placebo treatment arms, with the majority of the results falling within normal reference ranges at baseline and post‐placebo treatment, as expected for a healthy participant population. 10 , 11 , 12 , 13 , 14 , 15 In a pooled analysis of 25 SAD/MAD studies inclusive of 355 healthy participants, 10 changes in QTcF from baseline of magnitude greater than 30 milliseconds occurred in 27 participants (7.6%) and two participants (0.6%) experienced a change from baseline of greater than 60 ms, which are slightly higher but relatively consistent with the 3% and 0%, respectively, reported in our study. Together, these data suggest that changes in QTcF in healthy participants rarely exceed 60 ms compared to baseline;therefore trends of this magnitude should be carefully evaluated when monitoring blinded clinical study data. In two additional pooled analyses of placebo data in SAD and MAD studies, 11 , 13 headache was noted to be the most common AE (12.9% in SAD studies and 14.8% in MAD studies) which is slightly lower than the reported incidences of 18.7% and 28.3% for SAD and MAD studies, respectively, in our analysis. However, all of the commonly reported AEs identified in our pooled analysis (threshold > 2%) overlapped with the most commonly reported AEs listed in these analyses (cutoff > 1%), with the exception of abdominal discomfort, abdominal pain, and pain in the extremities. Additionally, the overall similar distribution for AE intensity of mild (86%–92%), moderate (7.8%–12.7%), and severe (1%–1.6%) 11 , 13 AEs was consistent with our observations. Any notable differences in our analyses versus these other similar analyses could be attributed to potential differences in participant demographics, route of administration, geographic differences in where the studies were conducted, or sample size considerations between the varying analyses.
This study does have limitations. The vast majority of participants in these pooled analyses were male, less than 50 years of age, White, and non‐Hispanic. Therefore, extrapolation to populations not well‐represented in this dataset, including other races/ethnicities in other countries, may be limited. There is, however, representation across a range of BMI and age, as well as inclusion of enough female participants to assess any potential for gender, BMI or age‐specific differences. Overall, there was no clear trend in this analysis for these factors indicating that these results could be useful for interpreting data from other healthy participant populations participating in clinical studies. Given the close monitoring and domiciling periods included in the phase I studies, these results may not apply to placebo treatment in later stage development studies.
This pooled analysis focused on the variability of key safety parameters under fasted conditions only, and restricted evaluation of laboratory parameters to within 24 h following placebo administration as dietary restrictions are often relaxed once participants are no longer domiciled. It is known that food may affect these physiological and laboratory parameters, 14 , 16 , 17 , 18 , 19 such as changes in ECG and laboratory parameters including transaminases, potentially caused by factors other than active treatment, which can be problematic for understanding the true safety profile of the new drug. Thus, it is acknowledged that evaluations to understand normal variance under fed conditions and at additional timepoints up to the post‐study visit would be of value in subsequent investigations.
In conclusion, this study adds to and expands on the existing literature on safety monitoring in placebo‐treated participants in phase I studies. The findings here can be leveraged to contextualize emerging findings in ongoing, blinded phase I studies and to flag experiences that are not typically observed in participants treated with placebo.
AUTHOR CONTRIBUTIONS
As per ICMJE rules, all authors are responsible for the work described in this paper. G.A.W. and K.E.D. wrote the manuscript. G.A.W., K.E.D., L.M., and S.A.S. designed the research. G.A.W., K.E.D., R.L., and L.M. performed the research. R.L., L.M., and A.K. analyzed the data. All authors provided final approval of the version to be published and agree to be accountable for all aspects of the work in ensuring that questions related to the accuracy or integrity of any part of the work are appropriately investigated and resolved.
FUNDING INFORMATION
Funding for the studies in this report was provided by Merck Sharp & Dohme LLC, a subsidiary of Merck & Co., Inc., Rahway, NJ, USA.
CONFLICT OF INTEREST STATEMENT
K.E.D., R.L., L.M., A.K., S.A.S, and G.A.W. are employees of Merck Sharp & Dohme LLC, a subsidiary of Merck & Co., Inc., Rahway, NJ, USA, and may own stock/stock options in Merck & Co., Inc., Rahway, NJ, USA.
Supporting information
Data S1
ACKNOWLEDGMENTS
The authors wish to thank the study participants and study staff. We also thank Deborah Panebianco for contributions to the research design; Sameer Bamnote (employee of Cytel, Waltham, MA), Young Zhuge, and Ming Xu for contributions to data analysis; and Jennifer Rotonda and Michele McColgan for editorial and administrative assistance. D. Panebianco, Y. Zhuge, M. Xu, J. Rotonda, and M. McColgan are or were employees of Merck Sharp & Dohme LLC, a subsidiary of Merck & Co., Inc., Rahway, NJ, USA.
Duncan KE, Li R, Maganti L, Kumar A, Stoch SA, Walford GA. Pooled analysis of routine safety parameters observed in healthy participants at baseline and following placebo administration in early phase clinical studies. Clin Transl Sci. 2024;17:e13715. doi: 10.1111/cts.13715
DATA AVAILABILITY STATEMENT
The data sharing policy, including restrictions, of Merck Sharp & Dohme LLC, a subsidiary of Merck & Co., Inc., Rahway, NJ, USA is available at http://engagezone.msd.com/ds_documentation.php. Requests for access to the clinical study data can be submitted through the EngageZone site or via email to dataaccess@merck.com.
REFERENCES
- 1. Sibille M. Selection of healthy volunteers for phase I studies. Fundam Clin Pharmacol. 1990;4(Suppl 2):167s‐176s. [DOI] [PubMed] [Google Scholar]
- 2. Duncan CJ, Rowland R, Lillie PJ, et al. Incidental diagnosis in healthy clinical trial subjects. Clin Transl Sci. 2012;5(4):348‐350. [DOI] [PMC free article] [PubMed] [Google Scholar]
- 3. Pasqualetti G, Gori G, Blandizzi C, Del Tacca M. Healthy volunteers and early phases of clinical experimentation. Eur J Clin Pharmacol. 2010;66:647‐653. [DOI] [PubMed] [Google Scholar]
- 4. Karakunnel JJ, Bui N, Palaniappan L, et al. Reviewing the role of healthy volunteer studies in drug development. J Transl Med. 2018;16:336. [DOI] [PMC free article] [PubMed] [Google Scholar]
- 5. Atkinson AJ Jr. Introduction to clinical pharmacology. In: Atkinson AJ Jr, Huang S‐M, Lertora JJL, Markey SP, eds. Principles of Clinical Pharmacology. 3rd ed. Elsevier Science and Technology; 2012:1‐9. [Google Scholar]
- 6. Shen J, Swift B, Mamelok R, Pine S, Sinclair J, Attar M. Design and conduct considerations for first‐in‐human trials. Clin Transl Sci. 2019;12:6‐19. [DOI] [PMC free article] [PubMed] [Google Scholar]
- 7. Phillips P. Pitfalls in interpreting laboratory results. Aust Prescr. 2009;32:43‐46. [Google Scholar]
- 8. Shaffer F, Ginsberg JP. An overview of heart rate variability metrics and norms. Front Public Health. 2017;5:258. [DOI] [PMC free article] [PubMed] [Google Scholar]
- 9. James GD. Understanding blood pressure variation and variability: biological importance and clinical significance. In: Islam MS, ed. Advances in Experimental Medicine and Biology: Advances in Internal Medicine. Springer International Publishing; 2017:3‐20. [DOI] [PubMed] [Google Scholar]
- 10. Young TC, Srinivasan S, Vetter ML, et al. A systematic review and pooled analysis of select safety parameters among normal healthy volunteers taking placebo in phase 1 clinical trials. J Clin Pharmacol. 2017;57:1079‐1087. [DOI] [PMC free article] [PubMed] [Google Scholar]
- 11. Jung D, Braun IV, Wensing G. Safety of healthy subjects in first‐in‐human multiple‐dose studies: a pooled analysis. Int J Clin Pharmacol Ther. 2021;59:1‐7. [DOI] [PMC free article] [PubMed] [Google Scholar]
- 12. Minocha M, Li H, Chiu Y‐L, Carter D, Othman AA. Models of variability and circadian rhythm in heart rate, blood pressure, and QT interval for healthy subjects who received placebo in phase I trials. Clin Transl Sci. 2019;12:470‐480. [DOI] [PMC free article] [PubMed] [Google Scholar]
- 13. Jung D, Boettcher M‐F, Wensing G. How safe are our studies? Analysis of adverse events in Bayer first‐in‐human trials from 2006 to 2016. Int J Clin Pharmacol Ther. 2020;58:10‐20. [DOI] [PubMed] [Google Scholar]
- 14. Rosenzweig P, Miget N, Brohier S. Transaminase elevation on placebo during phase I trials: prevalence and significance. Br J Clin Pharmacol. 1999;48:19‐23. [DOI] [PMC free article] [PubMed] [Google Scholar]
- 15. Rosenzweig P, Brohier S, Zipfel A. The placebo effect in healthy volunteers: influence of experimental conditions on the adverse events profile during phase I studies. Clin Pharmacol Ther. 1993;54:578‐583. [DOI] [PubMed] [Google Scholar]
- 16. Täubel J, Ferber G, van Langenhoven L, et al. The cardiovascular effects of a meal; J‐Tpeak‐Tend assessment and further insights into the physiological effects. J Clin Pharmacol. 2019;59:799‐810. [DOI] [PMC free article] [PubMed] [Google Scholar]
- 17. Cirincione B, Sager PT, Mager DE. Influence of meals and glycemic changes on QT interval dynamics. J Clin Pharmacol. 2017;57:966‐976. [DOI] [PMC free article] [PubMed] [Google Scholar]
- 18. Purkins L, Love ER, Eve MD, et al. The influence of diet upon liver function tests and serum lipids in healthy male volunteers resident in a phase 1 unit. Br J Clin Pharmacol. 2003;57:199‐208. [DOI] [PMC free article] [PubMed] [Google Scholar]
- 19. Lim AK. Abnormal liver function tests associated with severe rhabdomyolysis. World J Gastroenterol. 2020;26:1020‐1028. [DOI] [PMC free article] [PubMed] [Google Scholar]
Associated Data
This section collects any data citations, data availability statements, or supplementary materials included in this article.
Supplementary Materials
Data S1
Data Availability Statement
The data sharing policy, including restrictions, of Merck Sharp & Dohme LLC, a subsidiary of Merck & Co., Inc., Rahway, NJ, USA is available at http://engagezone.msd.com/ds_documentation.php. Requests for access to the clinical study data can be submitted through the EngageZone site or via email to dataaccess@merck.com.