

Abstract
Parental histones, the carriers of posttranslational modifications, are deposited evenly onto the replicating DNA of sister chromatids in a process dependent on the Mcm2 subunit of DNA helicase and the Pole3 subunit of leading-strand DNA polymerase. The biological significance of parental histone propagation remains unclear. Here we show that Mcm2-mutated or Pole3-deleted mouse embryonic stem cells (ESCs) display aberrant histone landscapes and impaired neural differentiation. Mutation of the Mcm2 histone-binding domain causes defects in pre-implantation development and embryonic lethality. ESCs with biased parental histone transfer exhibit increased epigenetic heterogeneity, showing altered histone variant H3.3 and H3K27me3 patterning at genomic sites regulating differentiation genes. Our results indicate that the lagging strand pattern of H3.3 leads to the redistribution of H3K27me3 in Mcm2–2A ESCs. We demonstrate that symmetric parental histone deposition to sister chromatids contributes to cellular differentiation and development.
Eukaryotic chromosomes are composed of distinct chromatin domains that can either facilitate or impede gene expression. It has been proposed that specific histone posttranslational modifications (PTMs) within these chromatin domains are associated with the formation of specific chromatin structures and transcription activity1,2. Histone PTM landscapes are highly cell-type-specific and can be transferred stably from a parental cell to daughter cells3–5. During DNA replication, parental histones and their PTMs are reassembled behind the replication fork onto the newly replicated daughter DNA6. Newly synthesized histones are then incorporated to restore histone levels in daughter cells. Nascent chromatin contains approximately equal amounts of parental and newly synthesized histones4,7–9. Consequently, PTMs are diluted by half compared with levels in parental chromatin4,10. To maintain chromatin states through cell division, parental histones with repressive PTMs, such as H3K9me3 and H3K27me3, are recycled to their original genomic locations10–12 and act as templates to spread these repressive marks to neighboring nucleosomes13. This process of faithfully transferring and restoring histone PTMs based on parental histone allocation is central to maintaining cellular identity through cell division. However, during differentiation for cellular specialization, a completely different gene expression program must be established and maintained. Whether parental histone allocation is regulated to allow programmed gene expression changes during this process is still largely unknown.
Recent studies have revealed that replisome proteins orchestrate the passage of parental histones to newly synthesized DNA7–9,14. Mcm2, a subunit of Mcm2–7 replicative helicase, preferentially binds parental histones H3H4 and facilitates their transfer to the replication lagging strand7,8. Further studies have revealed that the DNA replication adapter protein Ctf4 and DNA polymerase α (Pol α), which form the Mcm2–Ctf4–Polα axis within the replisome, are also involved in the histone transfer process7,14. On the other hand, Pole3 and Pole4, two subunits of leading-strand DNA polymerase, interact with H3H4 and promote the transfer of parental histones to leading strands9,14. Mutations in the histone-binding domains of Mcm2 or Polα, or deletion of Pole3 or Pole4 that abolish histone chaperone activity, result in parental histones being deposited predominantly on the replication leading or lagging strand, respectively7,8,14. Hence, the Mcm2–Ctf4–Polα axis and Pole3/Pole4 function at the DNA replication fork to safeguard the symmetric allocation of parental histones, along with their preserved PTMs, onto the replication strands of sister chromatids.
To explore the potential role of parental histone allocation in the process of cell differentiation, we genetically perturbed the symmetric parental histone PTM inheritance in mouse ESCs by abolishing chaperone function of Mcm2 (introducing point mutations in the histone-binding domain, Mcm2–2A), Pole3 (knockout, Pole3 KO) or both (Mcm2–2A mutation and Pole3 knockout, Mcm2–2A Pole3 KO)7,8,14. We found that the mutant ESCs could not fully differentiate along the neural lineage. Combining single-cell transcriptomics and epigenomics with lineage tracing of Mcm2–2A cells, we showed that the impaired neural differentiation was caused by a global redistribution of histone PTMs, especially H3K27me3, which altered the activation of neural lineage genes. These findings reveal that parental histone allocation contributes to establishing chromatin states during cell differentiation, through altering ESC differentiation potential.
Results
Asymmetric parental histone inheritance alters H3K27me3 landscapes
To understand whether parental histone allocation plays a role in ESC differentiation, we utilized CRISPR–Cas9-mediated genome editing technology to introduce homozygous Mcm2 point mutations (Mcm2–2A: Y81A/Y90A), Pole3 knockout (Pole3 KO) or both (Mcm2–2A Pole3 KO) in ESCs (Supplementary Fig. 1a–c). Previous studies from our laboratories and others have shown that this mutant or deletion renders cells incapable of transferring parental histones to leading or lagging strands at the DNA replication fork, with minimal impact on cell cycle progression8,14 (Supplementary Fig. 2a).
Given that parental histones play an important role in the transfer of PTM information, we asked whether global histone modification profiles are altered in Mcm2–2A ESCs. Using CUT&Tag15, we profiled the global distributions of the histone marks H3K27me3, H3K4me3 and H3K9me3, which are important in maintaining both stem and somatic cell state and controlling cell differentiation16,17 (Supplementary Fig. 2b). Whereas the relative global abundance of each histone mark, assessed by western blot, was similar between Mcm2–2A-expressing and wildtype (WT) ESCs (Supplementary Fig. 2c), the global distributions for all three histone marks were altered significantly in Mcm2–2A-expressing cells, including in promoters, gene bodies and intergenic regions (Supplementary Fig. 2d,e). Principal component analysis (PCA) showed that H3K27me3 profiles were altered to a greater extent than the other PTMs in Mcm2–2A ESCs compared with WT (Fig. 1a).
Fig. 1 |. Mcm2–2A mutation alters the H3K27me3 landscape of ESCs.
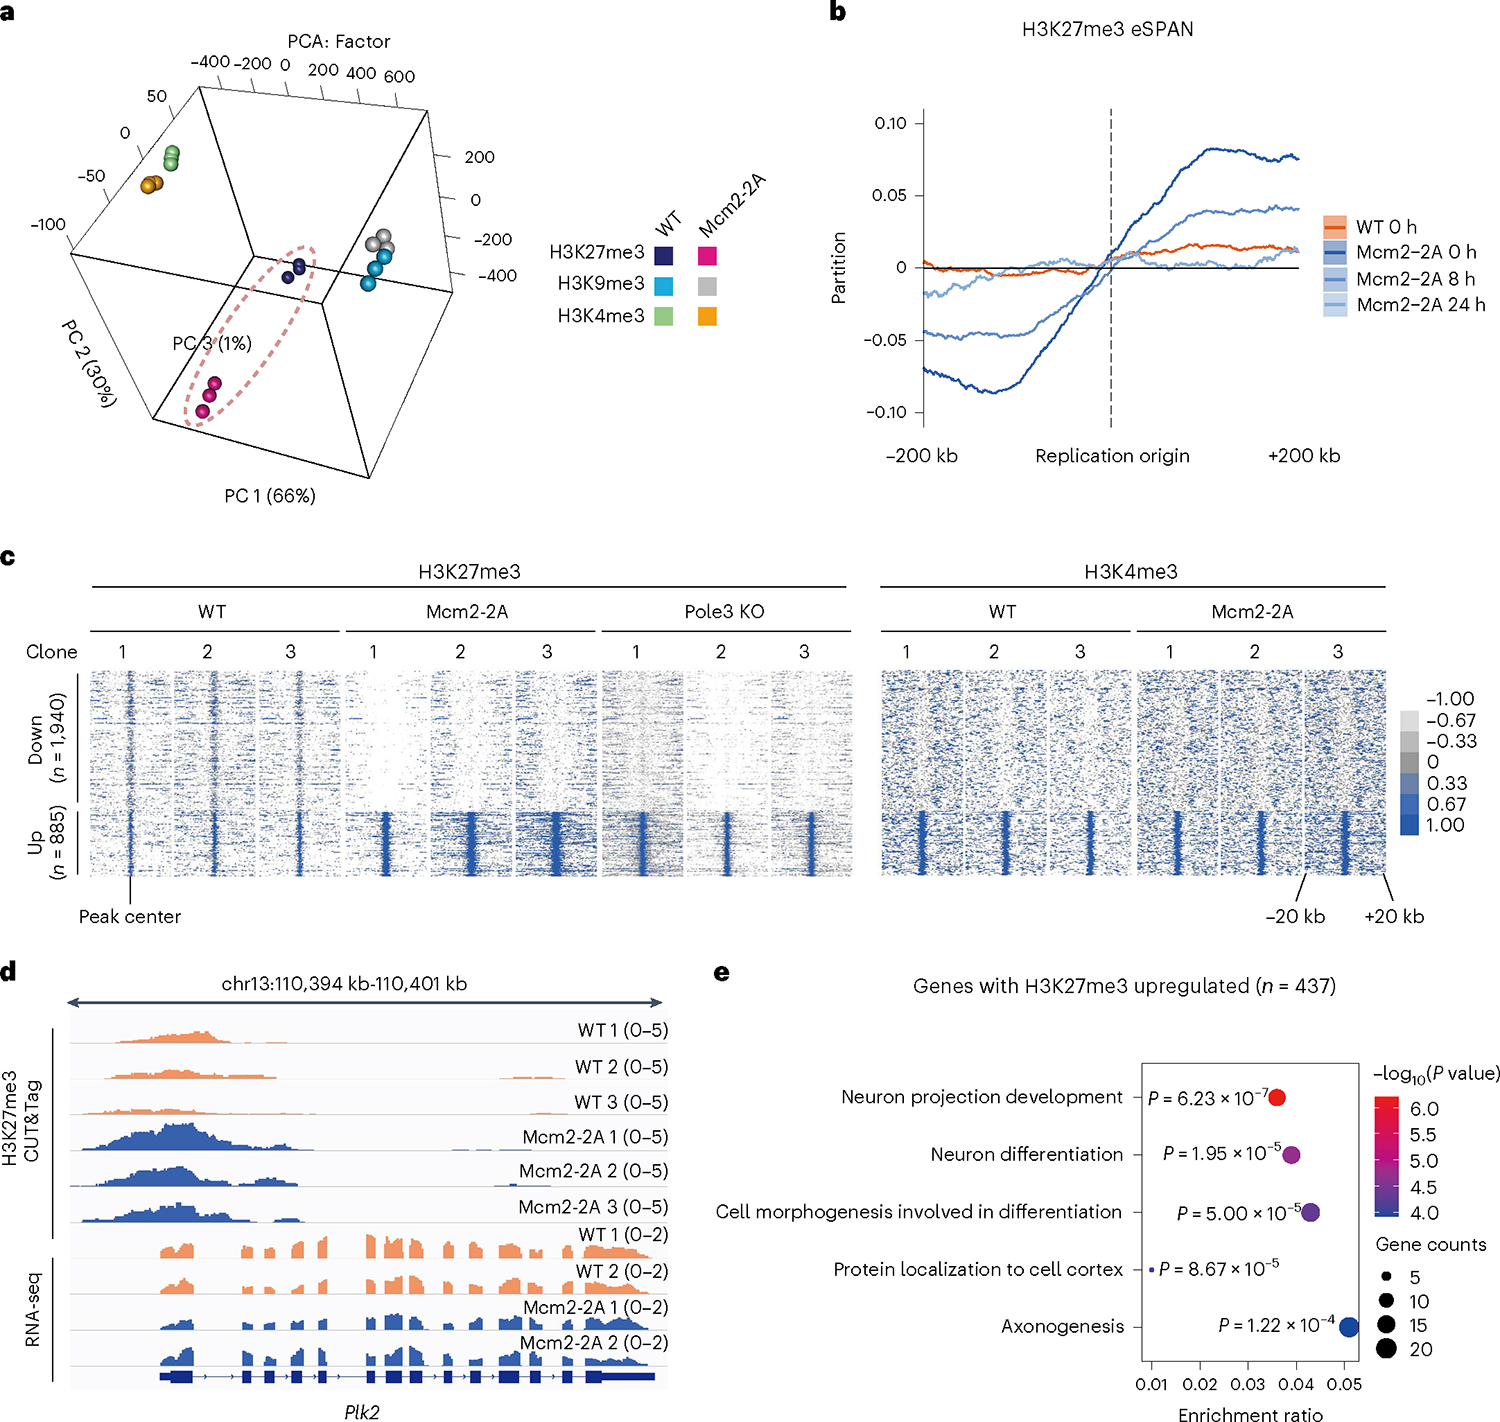
a, PCA of H3K27me3, H3K4me3 and H3K9me3 CUT&Tag profiles in WT (n = 3) and Mcm2–2A (n = 3) ESC clonal lines. H3K27me3 profiles are outlined in dashed ellipse. b, Average bias of H3K27me3 eSPAN (n = 2,417 origins) in WT and Mcm2–2A ESCs at 0, 8 and 24 h. c, Heatmaps of up- and downregulated H3K27me3 signal (left) and H3K4me3 signal (right) at TSSs (± 20 kb) in Mcm2–2A (n = 3), Pole3 KO (n = 3) versus WT (n = 3) ESC clonal lines. d, H3K27me3 CUT&Tag (up) and RNA-seq (down) tracks for Plk2 in WT and Mcm2–2A ESCs; n = 3 (CUT&Tag) or n = 2 (RNA-seq) independent clonal lines. e, Enriched GO terms (P < 0.01) for H3K27me3 signals upregulated in Mcm2–2A versus WT ESCs. P values from the one-sided hypergeometric test are shown.
Because histone methylation marks are transferred with parental histones, whereas newly synthesized histones are methylated later during DNA replication, we could track parental histone transfer patterns with H3K27me3 enrichment and sequencing of protein-associated nascent DNA (eSPAN)18. To detect the DNA strand-specific transfer of parental H3K27me3 and monitor the new H3K27me3 restoration process in Mcm2–2A mutants, we collected samples 0, 8 and 24 h after 5-bromodeoxyuridine (BrdU) labeling for eSPAN analysis. We confirmed the biased allocation of H3K27me3 on the replication leading strand in Mcm2–2A ESCs (Fig. 1b). Furthermore, the delayed restoration of H3K27me3 indicates that the asymmetric H3K27me3 pattern on sister chromatids is inherited, generating twin daughter cells with different chromatin structure.
H3K27me3 signals could be grouped by up- and downregulated regions in Mcm2–2A, or Pole3 KO versus WT ESCs. H3K4me3 signals were not altered across the same loci (Fig. 1c and Supplementary Fig. 3a,b). The degree of H3K27me3 changes anticorrelates to the amount of pre-existing H3K27me3 (Supplementary Fig. 3c). It has been proposed that H3K27me3 maintains repression of genes within transcriptionally silent domains16,17. However, we did not observe significant differences in expression of genes with elevated H3K27me3 levels around their transcriptional start sites (TSSs; ± 2 kb) in Mcm2–2A ESCs (Supplementary Fig. 3d) (for example, Plk2; Fig. 1d). We also found that the upregulated H3K27me3 signals largely overlapped with bivalent promoters (TSS; ± 2 kb), with very few downregulated H3K27me3 or altered H3K4me3 at these sites (TSS; ± 2 kb) (Supplementary Fig. 4a). Moreover, the loss of H3K27me3 is not correlated with the gain of H3K4me3, and the expression level of the related genes does not change accordingly (Supplementary Fig. 4b,c). Therefore, H3K27me3 differences seem decoupled from gene expression and the changes in H3K4me3. Genes associated with upregulated H3K27me3 signals were enriched for gene ontology (GO) terms related to neurodevelopment, including neuron projection development, neuron differentiation and axonogenesis (Fig. 1e), whereas genes associated with downregulated H3K27me3 signals were enriched for GO terms related to kinase B signaling and inflammatory response (Supplementary Fig. 5a). In contrast, genes associated with up- or downregulated H3K4me3 or H3K9me3 signals were enriched for GO terms related to signaling transduction, diverse cell differentiation, immune-related process and thermogenesis, respectively (Supplementary Fig. 5b–e). Thus, our results indicate that Mcm2–2A mutation results in the aberrant spread and redistribution of H3K27me3 around neurodevelopment genes, without dramatically altering associated gene expression (Supplementary Note 1 and Supplementary Figs. 6 and 7).
Parental histone segregation acts on neural and embryonic development
To understand whether symmetric parental histone allocation plays a role in ESC differentiation, we differentiated WT, Mcm2–2A, Pole3 KO and Mcm2–2A Pole3 KO ESC clones into neural progenitor cells (NPCs) (Fig. 2a). Since previous studies indicate that alterations in histone PTMs are involved in human neurodevelopmental disorders17, we hypothesized that Mcm2–2A mutations would have a more severe impact on NPCs than ESCs. Consistent with our hypothesis, we found that, although the relative global abundance of each histone mark was similar between Mcm2–2A and WT NPCs (Supplementary Fig. 8a), when differentiated along the neural lineage, Mcm2–2A NPCs formed fewer cell aggregates when grown in suspension (Supplementary Fig. 8b).
Fig. 2 |. Mcm2–2A mutation impairs ESC differentiation and mouse development.
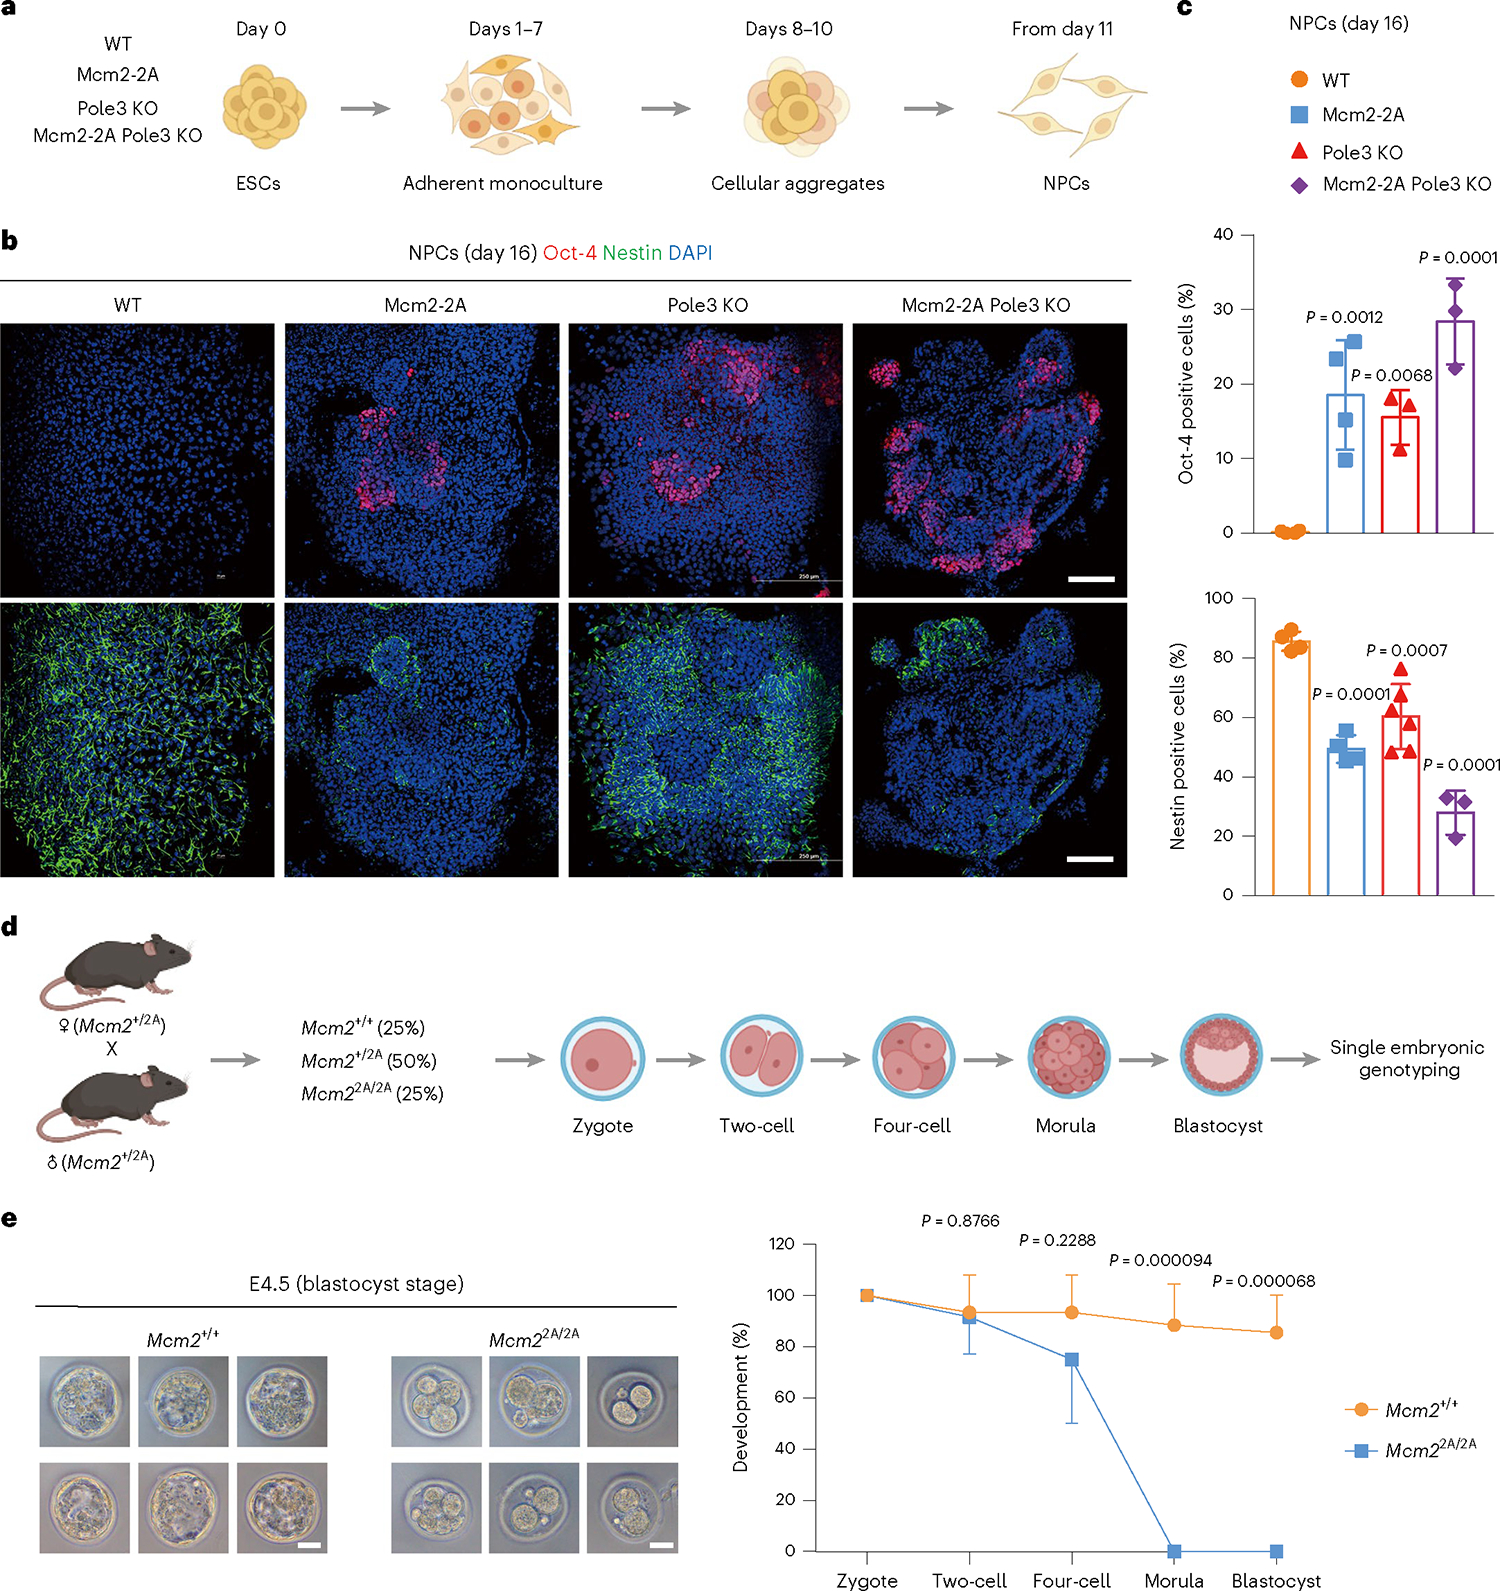
a, Experimental design. WT, Mcm2–2A, Pole3 KO and Mcm2–2A Pole3 KO ESCs were cultured in serum-free adherent monoculture for 7 days to induce NPC differentiation. Then, progenitor cells were grown in suspension as cellular aggregates for 3 days. Aggregates were then harvested and replated for mature NPC differentiation. b, Merged immunofluorescence images of NPCs on day 16, stained with antibodies against neural lineage marker Nestin, pluripotent cell marker Oct-4 and DAPI. Scale bars, 100 μm. c, Percentages of Oct-4+ or Nestin+ cells of differentiation in day 16 NPCs. Each point represents the mean percentage ± s.d. of an independent clone line, WT (n = 4), Mcm2–2A (n = 4), Pole3 KO (n = 3) or Mcm2–2A Pole3 KO (n = 3). An unpaired two-sided Student’s t-test was used to calculate statistical significance. Similar phenotypes were observed in at least three independent differentiation experiments. d, Experimental design. Mcm2+/+, Mcm2+/2A and Mcm22A/2A embryos were generated by crossing heterozygous Mcm2+/2A males and females. Embryos of both sexes were cultured from zygote to blastocyst and processed for single embryonic genotyping. e, Representative bright-field images of embryonic development at blastocyst stage. Scale bars, 30 μm (left). Developmental progression of homozygote Mcm22A/2A and WT early embryos (right). Data are presented as mean percentage ± s.d. of WT (n = 5 superovulated females, n = 16 embryos) and Mcm2–2A (n = 3 superovulated females, n = 7 embryos). An unpaired two-sided Student’s t-test was used to calculate statistical significance.
To characterize the phenotype of Mcm2–2A, Pole3 KO and Mcm22A Pole3 KO NPCs, we stained the cells with the neural lineage marker Nestin and pluripotent cell marker Oct-4 (also known as Pou5f1). There were fewer Nestin-positive and more Oct-4-positive cells in Mcm2–2A, Pole3 KO and Mcm2–2A Pole3 KO cultures compared with the WT NPC cultures (Supplementary Fig. 8c,d). Even at a late neural differentiation time point (day 16), most Mcm2–2A, Pole3 KO and Mcm2–2A Pole3 KO cells had not fully differentiated into Nestin-positive NPCs. Instead, we observed a heterogeneous population of non-neural and neuron-like cells that lacked structural bipolarity (Fig. 2b). Levels of the mature NPC marker Nestin were significantly lower in Mcm2–2A, Pole3 KO and Mcm2–2A Pole3 KO cells (Fig. 2c), suggesting that these cells were either not NPCs or were immature NPCs that failed to undergo proper neurodifferentiation.
Next, we performed RNA sequencing (RNA-seq) to assess transcriptome differences between Mcm2–2A and WT cells after inducing neural differentiation. Downregulated genes in Mcm2–2A cells were enriched in the process of neural differentiation, whereas upregulated genes were associated with ectodermal, mesodermal and endodermal development (Supplementary Fig. 8e).
To characterize the direct phenotype of parental histone segregation defects, we established ESCs expressing auxin-based inducible degradation Mcm2-AID-EGFP or HA19,20. We found that a gradual accumulation of improper histone modification inheritance, induced by Mcm2–2A across several cell generations, leads to NPC differentiation defects (Supplementary Note 2 and Supplementary Fig. 9).
After observing the neural differentiation defect phenotype of Mcm2–2A cells, we postulated that Mcm2–2A mutation may severely affect mouse growth and development. To test this hypothesis, we generated heterozygous Mcm2–2A mice. We further found that homozygous Mcm2–2A mutation caused impaired pre-implantation development, starting at the four-cell stage, and reducing the efficiency of morula development (Fig. 2d,e, Supplementary Note 3 and Supplementary Tables 1–5). These results suggest that homozygous Mcm2–2A mutation status is embryonic lethal in mice, without affecting the sex ratio (Supplementary Fig. 10c and Supplementary Table 6).
In summary, our findings suggest that the proper parental histone allocation is important for cell differentiation along the neural lineage and mouse embryonic development.
Mcm2–2A cells show epigenetic and transcriptomic heterogeneities
To investigate whether the initial differences in histone modification that we observed could influence ESC fate, we combined lineage tracing and single-cell messenger RNA sequencing (scRNA-seq) to simultaneously analyze transcriptome and lineage information at single-cell resolution (Fig. 3a). ESCs were transduced with the lineage and RNA recovery (LARRY) lentiviral barcoding library21 and then differentiated along the neural lineage. Portions of the cells from day 0 (ESCs) and day 7 (NPCs) were analyzed by 10x Genomics scRNA-seq, and the remaining cells were replated to enable clonal expansion and lineage tracing. Using t-distributed stochastic neighbor embedding (t-SNE), cells resolved into six clusters based on their distinct transcriptome profiles (Fig. 3b–d and Supplementary Fig. 11a–d). To annotate these clusters, we projected well-defined ESC markers (Pou5f1, Nanog, Sox2 and Klf5) and NPC markers (Pax6, Fabp7, Nestin, Sox1, Hes5 and Epha7) onto the t-SNE plot and found that ESCs were assigned mainly to cluster 1 and NPCs to cluster 2 (Fig. 3e,f and Supplementary Fig. 11e–l). In accord with this annotation, WT cells were projected primarily to cluster 2 upon neurodifferentiation, whereas most Mcm2–2A cells were mapped to an entirely distinct group (cluster 3) upon neurodifferentiation (Fig. 3b–d). These results indicate that Mcm2–2A cells failed to undergo proper neurodifferentiation.
Fig. 3 |. Single-cell lineage and transcriptome sequencing maps distinct fate of NPCs differentiated from WT versus Mcm2–2A ESCs.
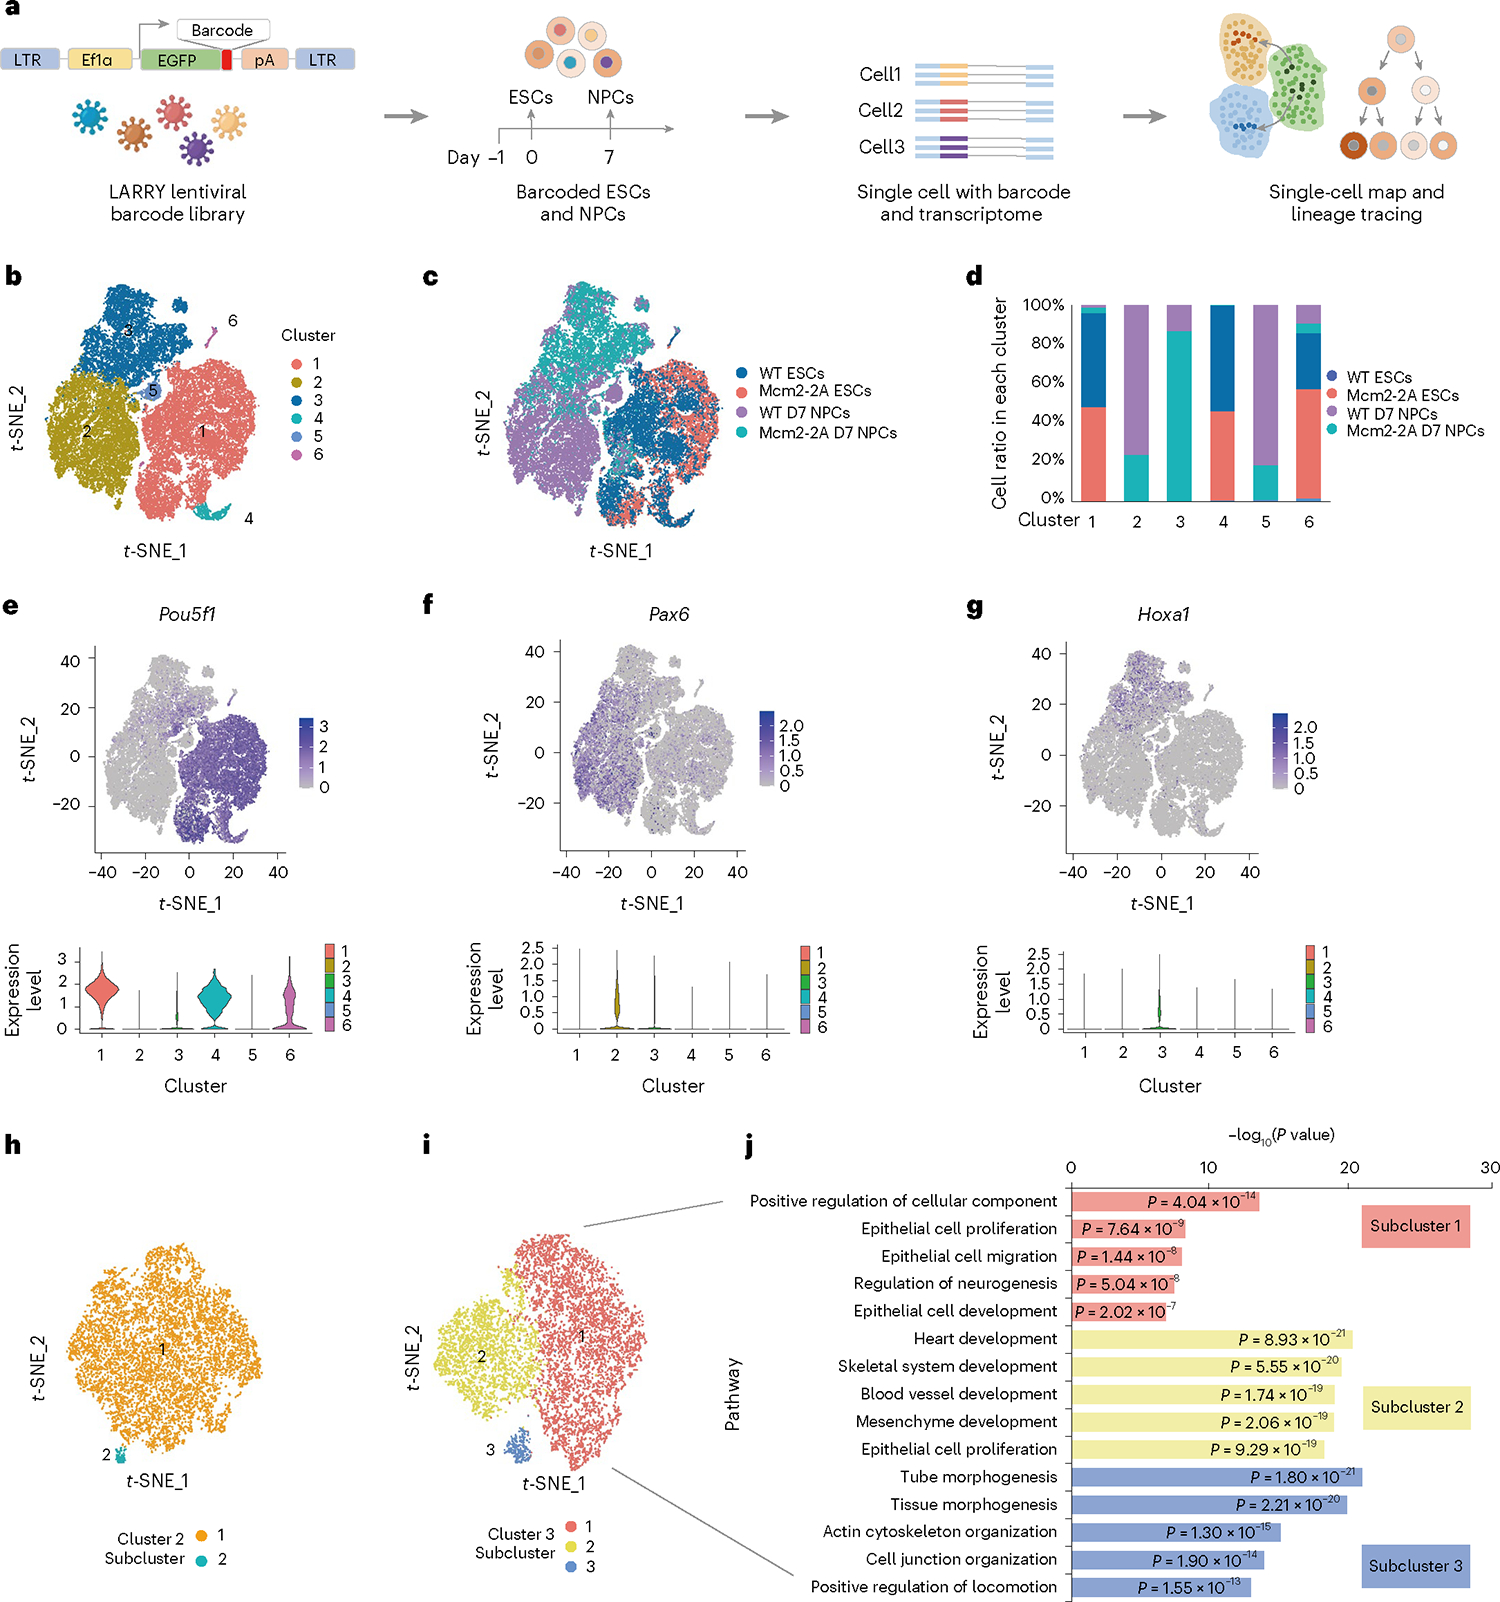
a, Experimental design for studying the differentiation dynamics of NPCs with the LARRY lentiviral barcoding library. The LARRY lentiviral construct delivers an expressed and heritable barcode that is detectable using scRNA-seq. WT and Mcm2–2A ESCs with the LARRY barcoding library were differentiated into NPCs. We then analyzed the single-cell transcriptome to map cell fate bias using 10x Genomics scRNA-seq at day 0 (ESCs) and day 7 (NPCs). ESCs and their differentiation outcomes were linked by their LARRY barcodes. b, Visualization of scRNA-seq data. Projection of WT (day 0, n = 8,871 cells; day 7, n = 11,213 cells) and Mcm2–2A (day 0, n = 9,471 cells; day 7, n = 12,887 cells) ESC and NPC single cells onto a t-SNE plot. Six clusters were identified. c, Same data as in b, this time showing how WT and Mcm2–2A cells from day 0 and day 7 cluster. d, Integrative analysis showing the ratios of WT and Mcm2–2A ESCs and NPCs in each cluster. e–g, Cluster annotation using key marker genes identified ESCs (Pou5f1) (e), NPCs (Pax6) (f) and other differentiated cell types in cluster 3 (Hoxa1) (g). Violin plots show expression of a given gene for clusters 1–6. h,i, Subclusters among cells from cluster 2 (only WT cells, h) and cluster 3 (only Mcm2–2A cells, i). j, Enriched GO terms (log2 fold-change < −0.25 or >0.25, P value < 0.05) for genes upregulated in the three Mcm2–2A NPC subclusters from i. P values from the one-sided hypergeometric test are shown.
We further analyzed the genes specific to cluster 3, which comprised most Mcm2–2A cells. Consistent with our bulk RNA-seq analysis (Supplementary Fig. 8e), upregulated genes in cluster 3 versus cluster 2 were enriched in processes outside of the neural lineage, such as embryonic organ, muscle tissue, mesenchyme and epithelial cell development (Supplementary Fig. 11m). Downregulated genes were related to axonogenesis, nervous system development and neural progenitor cell proliferation (Supplementary Fig. 11n). Projection of the embryonic-organ-development-related genes Hoxa1, Foxc2, Rdh10, Twist1 and Lhx1 and the muscle-tissue- or mesenchyme-cell-development-related genes Twist1, Foxc2, Rdh10 and Gata6 to cluster 3 validated our analysis (Fig. 3g and Supplementary Fig. 12a–e). Orthogonal pseudotemporal ordering analysis confirmed the distinct differentiational trajectories of the two cell types, showing more Mcm2–2A than WT cells located in the middle of their trajectories, at a transitional state (Supplementary Fig. 12f–h).
To gain more insight into the differentiated Mcm2–2A cells, we obtained subcluster information from cluster 2 (primarily WT NPCs) and cluster 3 (primarily Mcm2–2A NPCs). In cluster 2, most WT NPCs localized to one subcluster (Fig. 3h) whereas, in cluster 3, differentiated Mcm2–2A cells were subdivided into three subclusters, each characterized by distinctly enriched processes, revealing transcriptomic heterogeneity (Fig. 3i,j). Specifically, Mcm2–2A cells failed to differentiate along the neural lineage and instead formed a heterogeneous population that consisted of endoderm, mesoderm and ectoderm cells. Strikingly, we found that the genes that failed to be activated during differentiation in Mcm2–2A cells overlapped with the genes with higher H3K27me3 levels at their promoters (Supplementary Fig. 12i) (for example, the neural-related gene Fgfbp3; Supplementary Fig. 12j,k). These findings indicate a link between aberrant H3K27me3 allocation at the ESC stage and aberrant transcriptomes at the differentiated NPC stage.
We hypothesized that defects in parental histone allocation might lead to cell-to-cell histone landscape heterogeneity and subsequently to transcriptomic heterogeneity. To test this hypothesis, we deployed the innovative single-cell CUT&Tag (scCUT&Tag) method to profile the heterogeneity of H3K27me3 patterning in ESCs22,23 (Fig. 4a). WT and Mcm2–2A ESCs were resolved into 11 clusters based on their distinct H3K27me3 profiles (Fig. 4b,c and Supplementary Fig. 13a,b). Meanwhile, we performed a cluster analysis with each genotype separately to better present clusters of WT or Mcm2–2A. Consistent with data from both genotypes pooled (Fig. 4c), Mcm2–2A ESCs display more clusters than the WT cells, indicating high heterogeneity of H3K27me3 (Supplementary Fig. 13c). As expected, Mcm2–2A mutation increased the pathway heterogeneity of the H3K27me3 distribution in ESCs, as evaluated by EVA statistic24 (Fig. 4d). To further examine the nature of this H3K27me3 heterogeneity, we randomly picked and expanded three independent clones from the original Mcm2–2A ESCs to perform both scCUT&Tag (Supplementary Fig. 14a–d) and bulk CUT&Tag of H3K27me3. All the independent Mcm2–2A subclones displayed similar clusters to the parental line, while the distribution of cell clusters varies among the parental clone and the three subclones, indicating that the offspring Mcm2–2A subclones inherited and maintained an improper H3K27me3 pattern from their progenitor, and also displayed heterog eneity (Supplementary Fig. 14e,f). Similar to their parental line, all three independent Mcm2–2A clones displayed higher pathway heterogeneous patterns than WT cells (Supplementary Fig. 15a), while maintaining the H3K27me3 pattern (Supplementary Fig. 15b). Consistent with our scRNA-seq analysis (Supplementary Fig. 11m,n), genes associated with H3K27me3 scCUT&Tag marker peaks for Mcm2–2A cells were enriched for GO terms outside of the neural lineage, such as head, sensory organ, blood vessel and embryonic development (Fig. 4e and Supplementary Fig. 15c). Similarly, we determined the cell-to-cell transcriptomic heterogeneity within each clone, using the LARRY barcodes specific to each clone and scRNA-seq data (Fig. 3a). We found that Mcm2–2A mutation increased transcriptomic heterogeneity in both ESCs and NPCs (Fig. 5a,b and Supplementary Fig. 16a). At sites with elevated H3K27me3 levels in Mcm2–2A cells, transcriptomic heterogeneity was more dramatic than at sites with stable H3K27me3 levels, and low or high (housekeeping) expression genes, both at the ESC stage and after differentiation (Fig. 5c and Supplementary Fig. 16b). Transcriptomic heterogeneity was found not only in neurodevelopment pathways, but also in other lineage differentiation pathways (Fig. 5d and Supplementary Fig. 16c,d). These results suggest that the higher level of heterogeneity in H3K27me3 distribution in Mcm2–2A ESCs leads to heterogeneous gene expression and aberrant differentiation.
Fig. 4 |. Mcm2–2A mutation increases histone H3K27me3 heterogeneity.
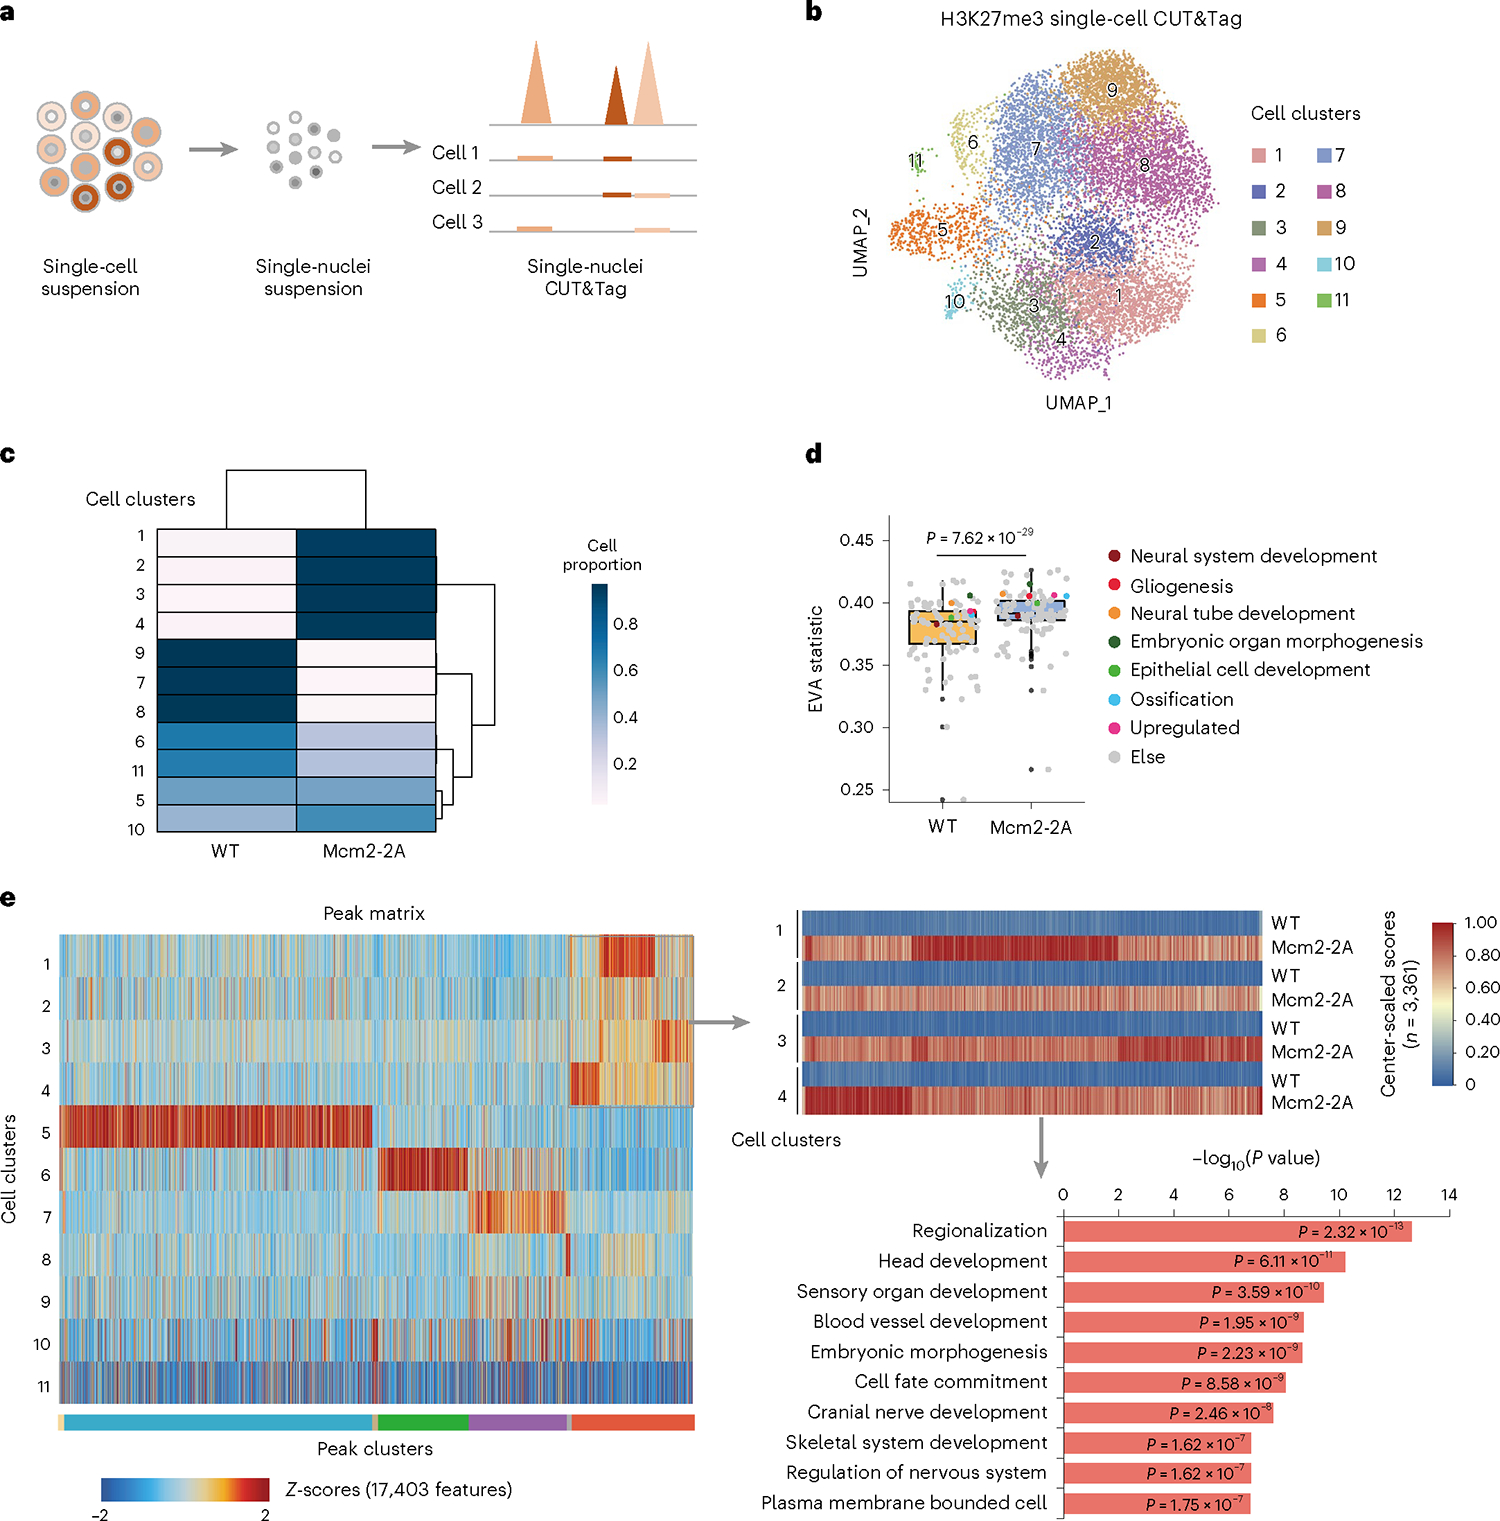
a, Experimental design for studying the heterogeneity of ESCs using scCUT&Tag. Cells were suspended into single cells, and nuclei were isolated to process CUT&Tag and the 10x Chromium scATAC-seq protocol. Gene score of H3K27me3 scCUT&Tag signal was used to analyze the pathway heterogeneity. b, Visualization of H3K27me3 scCUT&Tag data. Clusters (1–11) projected onto a uniform manifold approximation and projection (UMAP) plot from H3K27me3 scCUT&Tag data derived from Mcm2–2A (n = 4,593 cells of one Mcm2–2A mutant) and WT ESCs (n = 6,535 cells of one WT clone). c, Heatmap showing the ratio of WT to Mcm2–2A ESCs for each cell cluster, 1–11. d, Boxplot showing pathway heterogeneity (EVA statistic) of the H3K27me3 unique fragments within neurodevelopment pathways and other lineage differentiation pathways in WT and Mcm2–2A ESCs. Box plots display the median, upper and lower quartiles; whiskers show 1.5× interquartile range (IQR). A paired two-sided Student’s t-test was used to calculate statistical significance (n = 103 of gene sets). e, Heatmap showing H3K27me3 signal intensity for each cell cluster, 1–11 (left). Color bars in the rows at the bottom of the heatmap specify peak clusters. Signal intensity of peaks inside the gray box were further showed separately in WT and Mcm2–2A cells (top right) and related genes were performed GO analysis (bottom right). P values from the one-sided hypergeometric test are shown.
Fig. 5 |. Mcm2–2A mutation increases cellular transcriptional heterogeneity.
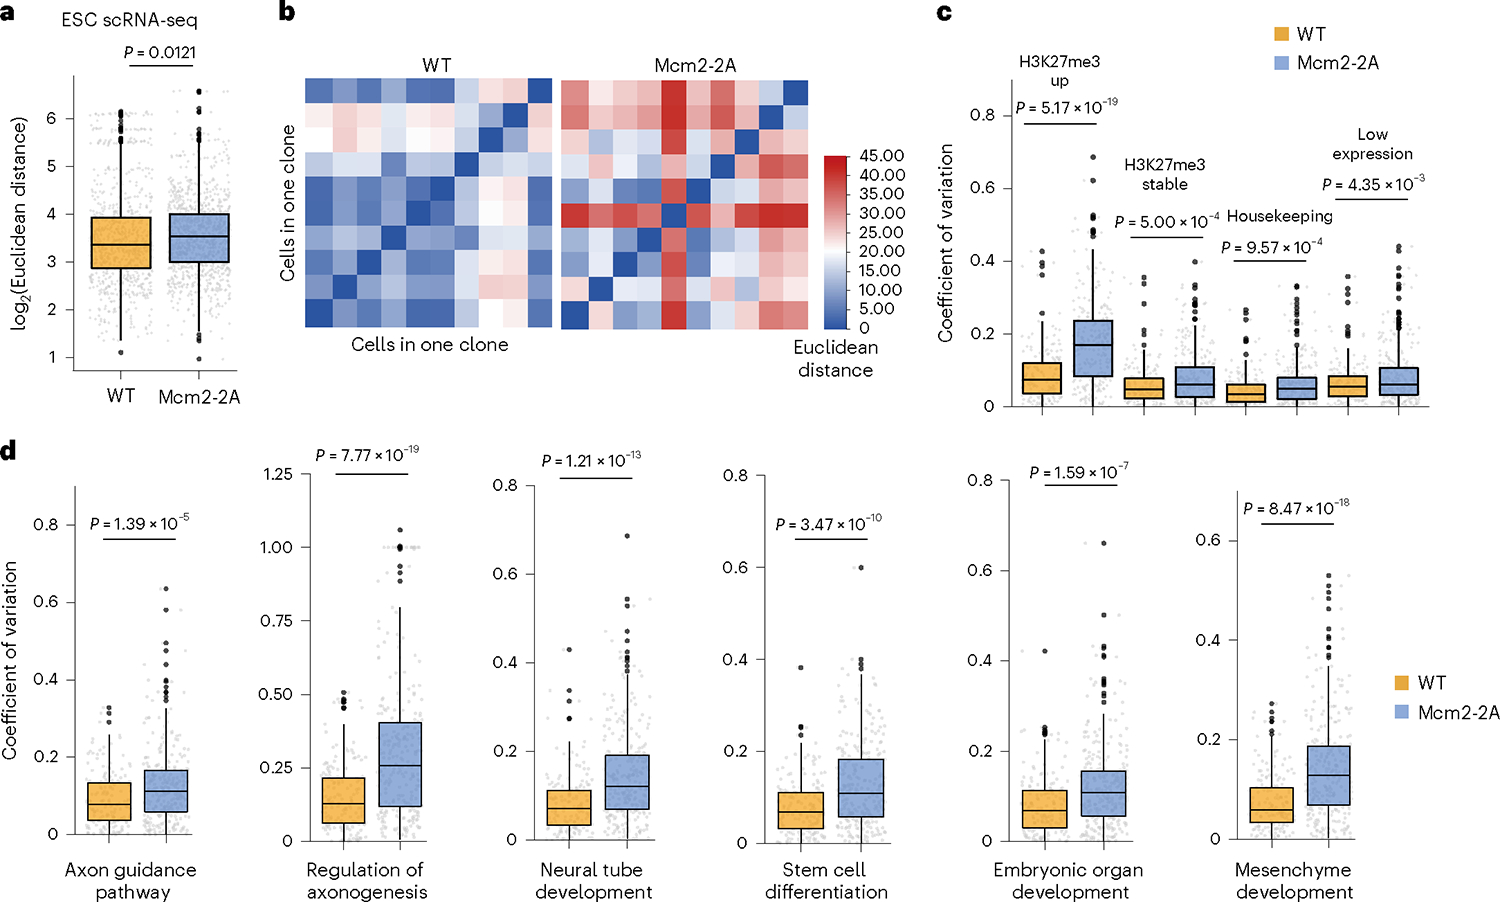
a, Boxplot showing cell-to-cell heterogeneity (Euclidean distance) of gene expression in WT and Mcm2–2A ESCs. An unpaired two-sided Student’s t-test was used to calculate statistical significance (n = 1,000 cell pairs). b, Heatmap showing the heterogeneity of gene expression in representative clones of WT and Mcm2–2A ESCs and NPCs. c, Boxplot showing heterogeneity (coefficient of variation) of expression for elevated H3K27me3 genes, stable H3K27me3 Stem cell Embryonic organ Mesenchyme differentiation development development genes, low expression genes and housekeeping genes in WT and Mcm2–2A ESCs. d, Boxplot showing heterogeneity (coefficient of variation) of gene expression within neurodevelopment and other differentiation pathways in WT and Mcm2–2A ESCs. Box plots display the median, upper and lower quartiles; whiskers show 1.5× IQR (a,c,d). WT (n = 165 lineage clones), Mcm2–2A (n = 270 lineage clones) (c,d). A two-sided Welch’s t-test was used to calculate statistical significance (c,d).
To investigate the clonal dynamics of ESC differentiation, we reconstructed the clonal relationships of each cell based on LARRY lentiviral barcodes—an approach that efficiently traces the represented DNA barcodes when integrated with scRNA-seq21. Thousands of cell lineages were constructed, stemming from ESC clones and branching into NPC descendants or ESCs themselves. We observed that Mcm2–2A cells were biased toward differentiation, in contrast to the balance between self-renewal and differentiation observed in WT ESCs (Fig. 6a). At the transcription level, Mcm2–2A ESCs showed a more differentiation-like gene expression profile (Fig. 6b). We also observed that Mcm2–2A cells tended to form superclones after differentiation, whereas most WT cells were found in smaller clones consisting of two to five cells (Fig. 6c and Supplementary Fig. 17a). Consistent with these observations, NPCs or NPC-like cells constituted most cells in the Mcm2–2A clones (Fig. 6d). In addition, the transcriptional heterogeneity of either superclones or smaller clones in Mcm2–2A mutants is higher than that of WT (Supplementary Fig. 17b). These results suggest that Mcm2–2A mutation makes ESCs biased towards differentiation and facilitates the selection of superclones in the presence of differentiation factors (Fig. 6e and Supplementary Fig. 17c).
Fig. 6 |. Mcm2–2A mutation forms superclones.
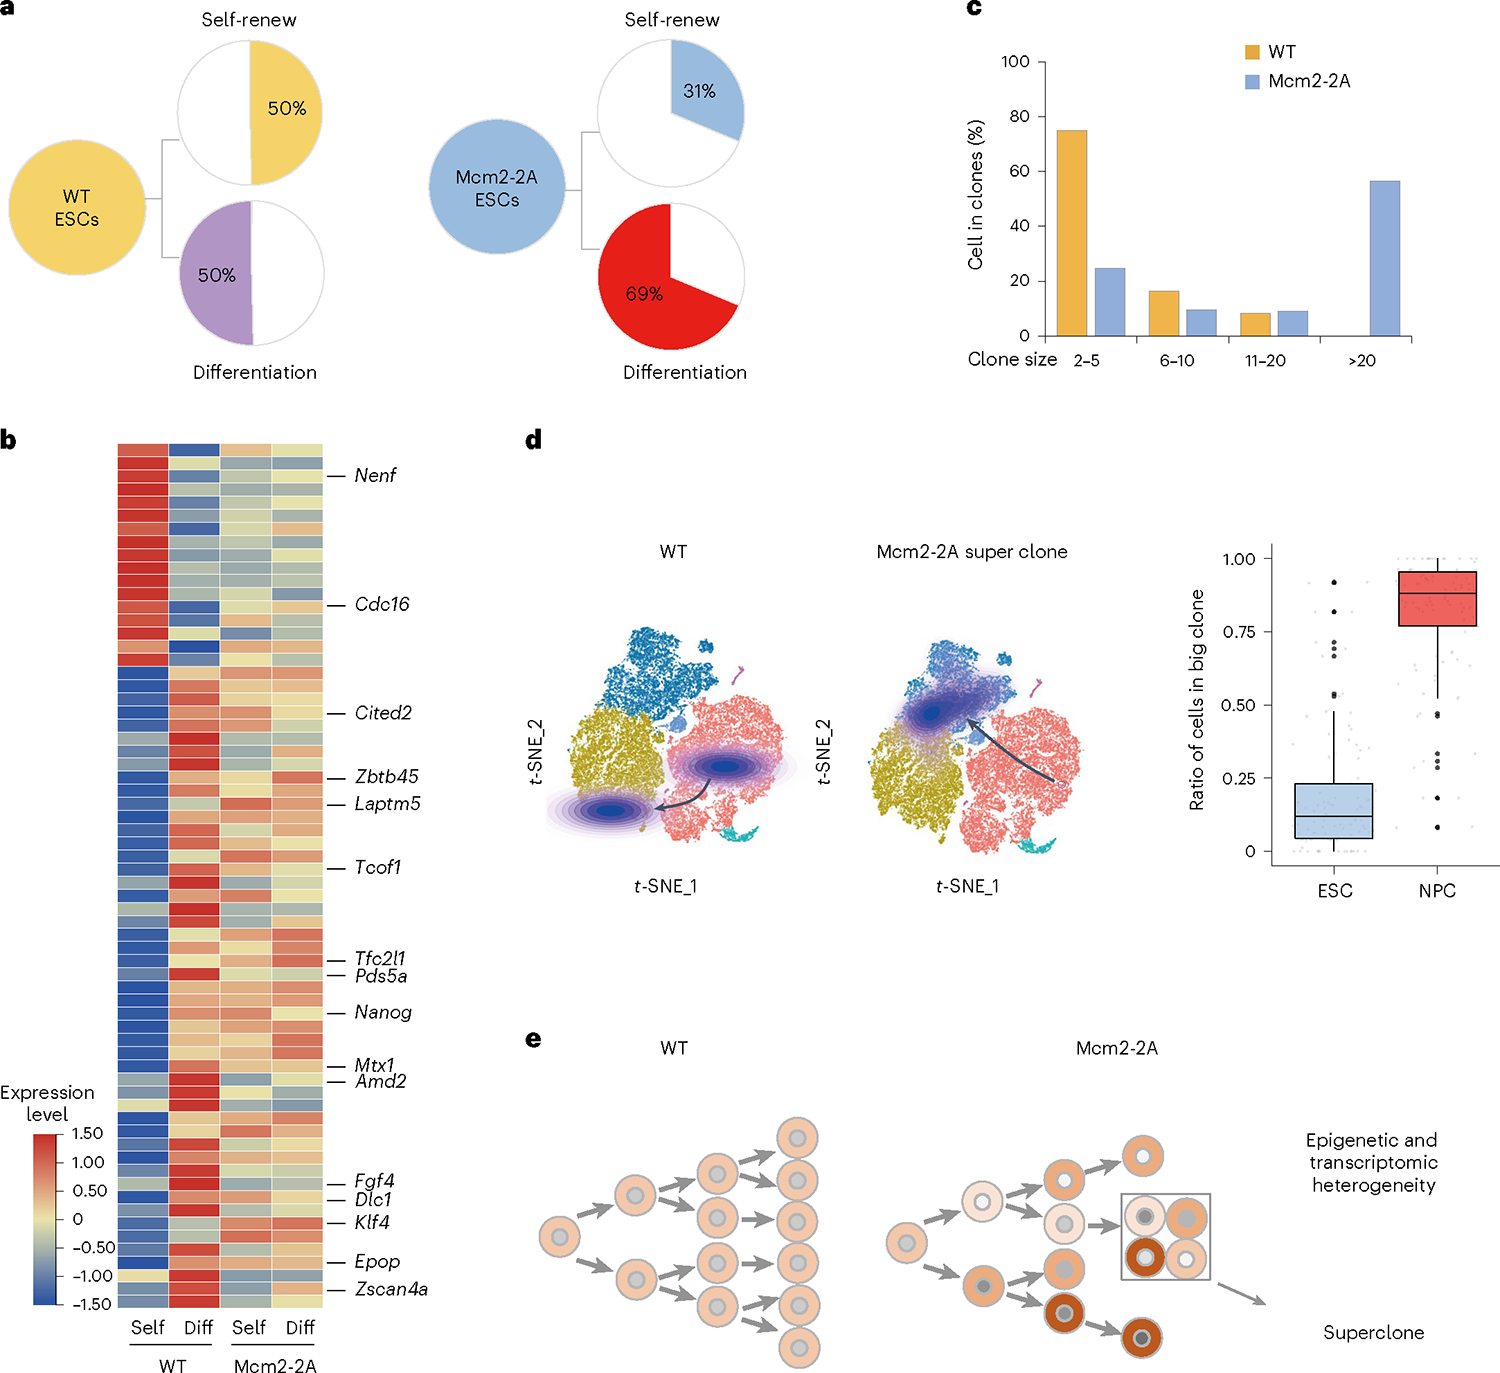
a, Lineage trees of WT and Mcm2–2A clones with the same barcodes, showing proportion of ESCs contributing to self-renewal (Self) or differentiation (Diff) during the differentiation of NPCs. b, Heatmap of differential gene expression between the self-renew and differentiation cells of WT versus Mcm2–2A ESCs in a. c, Percentage of WT and Mcm2–2A cells found in clones of 2–5, 6–10, 11–20 or more than 20 cells. d, Contour plots showing the cell density of representative clone lineages projected onto t-SNE plots for WT (left) and Mcm2–2A cells. A representative Mcm2–2A superclone was shown (middle). Boxplot showing proportion of ESCs versus NPCs of cell clones containing more than ten cells in Mcm2–2A clones (n = 99 big clones). Box plots display the median, upper and lower quartiles; whiskers show 1.5× IQR (right). e, Model of Mcm2 in heterogeneity and superclone. Mcm2–2A mutation leads to a biased allocation of parental histone resulting in epigenetic and transcriptomic heterogeneity, and subsequently superclone.
Parental histone segregation maintains nucleosome positioning
To explore whether parental histone allocation affects the position of nucleosomes and transcription factors (TFs), we performed MINCE-seq25 and Repli-ATAC-seq26 to profile the steady-state and immature position of nucleosomes and TFs. We found that the defects of NPC differentiation of Mcm2–2A ESCs are caused by aberrant parental histone segregation and probably not due to the changes of nucleosome positioning and the accessibility of TFs at newly replicated and mature chromatin. However, we cannot exclude the potential impacts of the minor changes of nucleosome positioning and other TFs following Mcm2–2A mutation (Supplementary Note 4 and Supplementary Figs. 18–25).
Asymmetric parental histone inheritance alters H3.3 landscapes
In mouse ESCs, the histone H3 variant H3.3 is required to properly establish H3K27me3 patterning at the promoters of developmentally regulated bivalent genes27, which led us to examine whether H3.3 is involved in the aberrant H3K27me3 distribution. Histone H3.3 exhibited a lagging strand bias in Mcm2–2A and a strong leading bias in Pole3 knockout ESCs, compared with the minor leading-strand bias in WT ESCs. Time-course eSPAN analysis showed that these biases were restored within 8 h (Fig. 7a). Analysis of published datasets showed that the H3K27me3 upregulated regions were enriched with H3.3, Hira and PRC1/2 complexes (Fig. 7b and Supplementary Fig. 26a–c). Our own H3.3 CUT&Tag analysis also showed higher levels of H3.3 signal at these regions compared with WT ESCs (Fig. 7c,d). To further demonstrate a functional role for H3.3 in this process, we also performed H3.3 eSPAN and H3K27me3 CUT&Tag in the presence of Hira knockout (Fig. 7e,f and Supplementary Fig. 27). We found that inhibition of Hira on top of Mcm2 mutation decreases the H3.3 bias, and importantly lessens the upregulation of H3K27me3 compared with Mcm2 mutation alone cells. As a control, Hira KO ESCs did not show any obvious H3.3 bias or change of H3K27me3 at the same sites (Fig. 7e,f). These results support a functional role of Hira-dependent H3.3 enrichment, at least partially, in the upregulation of H3K27me3 in cells that are defective in parental histone transfer.
Fig. 7 |. H3.3 coordinates with H3K27me3 to impair Mcm2–2A ESC differentiation.
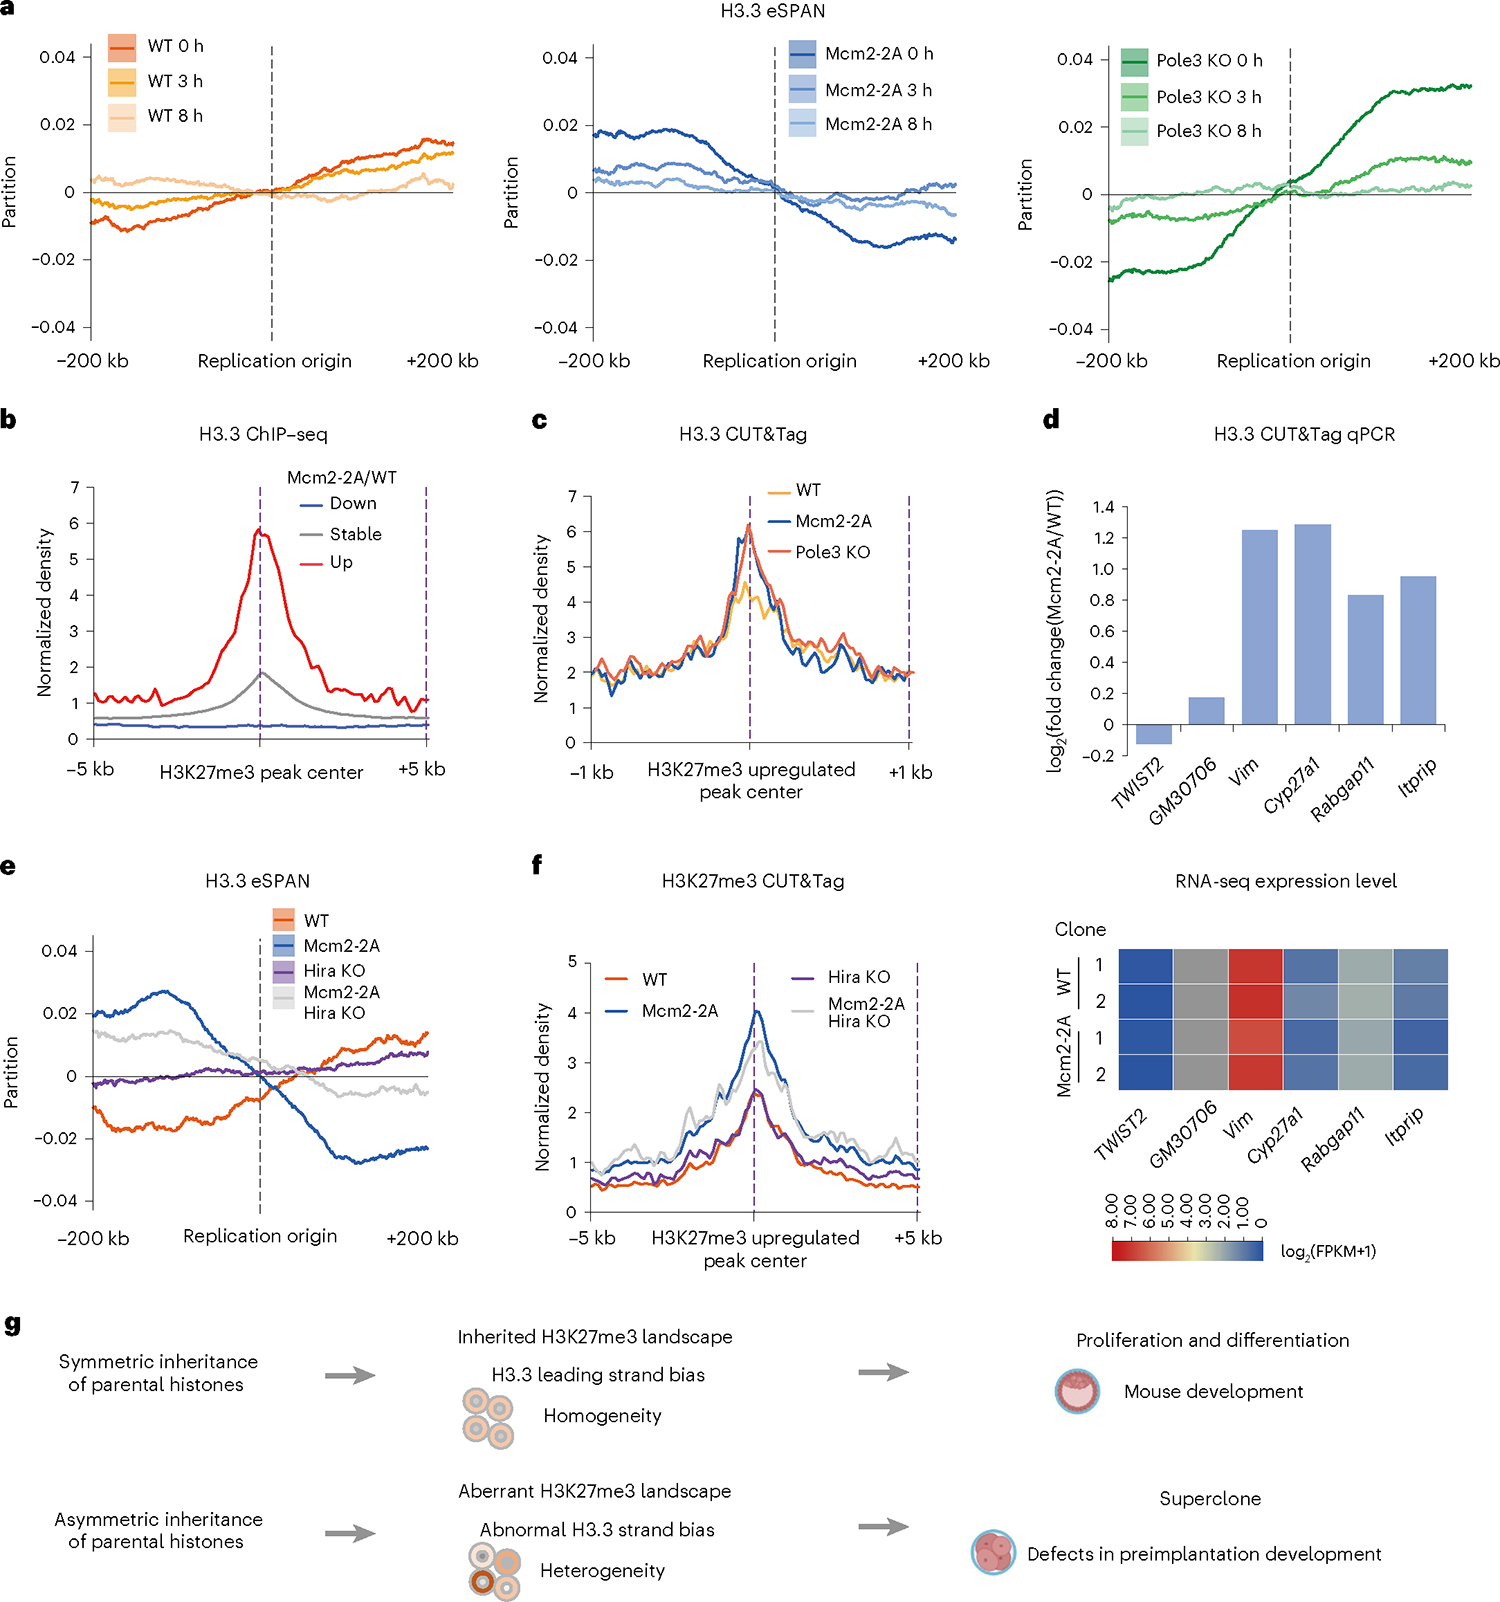
a, Average bias of H3.3 eSPAN (n = 2,417 origins) in WT (left), Mcm2–2A (middle) and Pole3 KO (right) ESCs at 0, 3 and 8 h after BrdU labeling for eSPAN analysis. b, Averaged H3.3 ChIP-seq signal at upregulated, stable and downregulated H3K27me3 CUT&Tag peaks (±5 kb). Data from ENCODE. c, Averaged H3.3 CUT&Tag signal in Mcm2–2A, Pole3 KO and WT ESCs at upregulated H3K27me3 CUT&Tag peaks in Mcm2–2A ESCs (±1 kb); n = 2 independent clone lines in each group. d, CUT&Tag qPCR analysis (up) of H3.3 at upregulated H3K27me3 and H3.3 peaks. TWIST2 and GM30706 sites were used as negative controls. Heatmap (bottom) showing the corresponding gene expressions (quantified by Fragments Per Kilobase of exon model per Million mapped fragments, FPKM). e, Average bias of H3.3 eSPAN (n = 2,417 origins) in WT, Mcm2–2A, Hira KO and Hira KO Mcm2–2A ESCs. f, Averaged profiles of H3K27me3 CUT&Tag signals in WT, Mcm2–2A, Hira KO and Hira KO Mcm2–2A ESCs at upregulated H3K27me3 peaks in Mcm2–2A ESCs (±5 kb). g, Model of Mcm2 in cellular differentiation and development. Parental histone allocation plays a crucial role in H3K27me3 and H3.3 maintenance, which contributes to proper differentiation and development following developmental signals. Mcm2–2A mutation leads to a biased allocation of H3K27me3 on the replication leading strand and a relatively increased H3.3 level on the lagging strand. The unbalanced nucleosome allocation causes epigenetic and transcriptomic heterogeneity, and aberrant gene transcription. Such changes result in impairment of ESC differentiation and mouse development.
Discussion
In this study, we found that symmetrical parental histone allocation during DNA replication contributes to mammalian cell fate choice during differentiation mainly by regulating the restoration of the H3K27me3 landscape during cell division. H3K27me3-marked chromatin has been shown to be inherited faithfully across multiple cell generations10–12. Therefore, we hypothesized that defects in parental histone allocation could lead to severe alterations in H3K27me3 distribution across multiple cell divisions. Consistent with this idea, we found dramatic changes in the H3K27me3 landscape when parental histone deposition on the leading strand was disrupted because of Mcm2–2A mutation. Importantly, we showed that many important development-related genes were in regions with elevated H3K27me3 levels in mutant cells, and those genes failed to respond to differentiation signals. As a consequence, Mcm2–2A or Pole3 deletion ESCs showed a strong differentiation-defective phenotype (Fig. 7g).
Next, we asked how development-related genes were targeted by H3K27me3 in Mcm2–2A cells. Previous studies using quantitative ChOR-seq time-course analyses showed that H3K27me3 restoration kinetics are locus-specific and that the PRC2 complex functions in efficient H3K27me3 local restoration and spread10. The replication-independent histone variant H3.3 does not co-occupy with the repressive histone marks H3K27me3 (ref. 28), except at H3K4me3- and H3K27me3-marked bivalent genes of ESCs27. H3.3, together with its chaperone Hira, is also required for recruiting PRC2, to properly establish H3K27me3 patterning at the bivalent promoters of developmentally regulated genes29. A recent study reported that parental H3.3 shows a leading-strand bias as other canonical H3 in Mcm2–2A ESCs through a Hira-independent manner30. In our study, we observed a Hira-dependent lagging strand bias of the total H3.3 that included newly synthesized and parental ones in Mcm2–2A ESCs. These results suggest that massive newly synthesized H3.3 incorporates into the lagging strand in Mcm2–2A ESCs. In this study, we observed higher occupancy levels of PRC2 components, H3.3 and Hira at upregulated H3K27me3 sites. This result suggests that replication-independent nucleosome assembly pathways play a role in targeting developmentally regulated genes at which local H3K27me3 patterning has been disturbed by aberrant parental histone allocation following DNA replication (Fig. 6e).
Previous studies reported that H3K27me3 restoration kinetics are locus-specific, with high PRC2 occupancy promoting the most efficient H3K27me3 restoration and border regions restoring more slowly10. The pre-existing high level of H3K27me3 contributed to the efficient restoration through a ‘read and write’ mechanism. However, the H3K27me3 pattern can be accurately reestablished de novo, which is dependent on the PRC2 core subunit Suz12 (ref. 31). The ‘read and write’ mechanism indicates that asymmetric parental histone transfer may dramatically affect the global H3K27me3 pattern. However, our study indicates that the effect of aberrant parental histone transfer on the genome-wide H3K27me3 is uneven. We also observed the anticorrelation between the pre-existing H3K27me3 level and the degree of Mcm2–2A-related H3K27me3 changes (Supplementary Fig. 3c). We speculate that genomic regions with high H3K27me3 are dependent not only on the ‘read and write’ mechanism but also on other factors, for example, specific DNA sequences might contribute to the maintenance of H3K27me3 patterns. However, at H3K27me3-low regions, the restoration of H3K27me3 may depend on the ‘read and write’ mechanism, which may be more dependent on parental recycled H3K27me3, and can be specifically affected by Mcm2–2A mutations.
During the development of a multicellular organism, asymmetric cell division is required to establish and maintain the different gene expression programs of diverse cell lineages. Parental histone allocation during cell division would establish new transcriptional programs to determinate the fate of daughter cells. Asymmetric parental histone allocation has been reported in Drosophila germline stem cells32–34. During germline stem cell differentiation, male germline stem cells divide asymmetrically to produce a self-renewing germline stem cell that retains parental histones and a differentiated daughter gonialblast that acquires newly synthesized histones. Disrupting asymmetric parental histone allocation in Drosophila germline stem cells leads to both early germline tumors and germline stem cell loss32–34. However, asymmetrical parental histone partition in other organisms, including mammals, has not been reported.
In our study, we found that perturbing parental histone allocation via Mcm2–2A mutation could create an asymmetrical parental histone pattern at the DNA replication fork. The resulting twin daughter cells probably inherit sister chromatids with different H3K27me3 landscapes. This local asymmetric histone partitioning impaired mouse ESC differentiation, in some sense mimicking the observations in Drosophila. By contrast, disrupting parental histone allocation in Schizosaccharomyces pombe is reported to have only minor effects on heterochromatin stability35. The discrepancy is probably due to the lack of an H3K27me3 repression system in S. pombe, which does not have a cell differentiation process. Further research is required to answer whether asymmetrical parental histone allocation is a shared key mechanism for mammalian development and how asymmetrical parental histone partitioning regulates cell fate (Supplementary Note 5).
Epigenomic control programs including histone modifications are critical for establishing chromatin states and cell-type-specific gene expression patterns. Therefore, divergent histone modification profiles contribute to gene expression heterogeneity within a cell population. In our study, we utilized scCUT&Tag and scRNA-seq with lineage barcoding to trace the epigenomics and transcriptomics of Mcm2–2A clones throughout the entire differentiation process. We found that Mcm2–2A mutation increases cellular heterogeneity in terms of both H3K27me3 distribution and the transcriptome. In particular, genes differentially expressed between Mcm2–2A versus WT cells were essential for establishing triploblastic lineages. These results indicate that perturbing parental histone allocation potentializes cells toward differentiation, with only a small portion of mutant cells retaining pluripotency. As a result, most mutant cells probably cannot properly respond to differentiation signals.
Although the Mcm2–2A mutation affects the symmetric parental histone segregation, a bias of histone modification does not fully compromise epigenetic inheritability. The alteration of histone modification profiles in Mcm2–2A mutation ESCs is a gradual process that requires several cell generations. The detailed mechanism of maintenance and higher heterogeneity of histone modification throughout generations in Mcm2–2A ESCs needs further investigation (Supplementary Notes 6–8).
In a recent published paper, the authors proposed that Mcm2 localizes at actively transcribed regions to regulate gene transcription in a replication-independent manner36. The Mcm2–2A mutation reduces the interaction with histones at bivalent chromatin domains, which leads to global changes in gene expression, chromatin accessibility and histone modifications, and ultimately contributes to the differentiation defects observed in ESCs36. Additionally, the study found that Pole3, another DNA replication component, exhibits a similar phenotype in single knockout ESCs as Mcm2–2A single mutant ESCs after differentiation. While our model proposes that Mcm2 or Pole3 functions in a replication-dependent manner to regulate parental histone segregation in ESC development, we acknowledge that alternative mechanisms may also play a role (Supplementary Note 9).
In higher organisms, cell differentiation, like neural development, is a highly ordered process that requires both the differentiation of neural stem cells into specific cell lineages and the maintenance and propagation of neural progenitor populations. Factors that drive the development of ESCs to various neural cell types have been well defined, and epigenetic changes have been demonstrated to be critical to those processes37. However, it is not well understood how proper epigenetic inheritance contributes to this process. Our results demonstrate that disrupting accurate allocation of parental histones during cell differentiation leads to impaired neural differentiation, providing direct evidence that proper epigenetic inheritance is indispensable for neural development.
In summary, our data suggest that parental histone allocation regulates mouse cell differentiation and development through the key epigenetic repressive mark H3K27me3. These findings demonstrate a direct link between DNA replication-coupled histone allocation and cell differentiation.
Online content
Any methods, additional references, Nature Portfolio reporting summaries, source data, extended data, supplementary information, acknowledgements, peer review information; details of author contributions and competing interests; and statements of data and code availability are available at https://doi.org/10.1038/s41588-023-01477-w.
Methods
This research complies with all relevant ethical regulations. The Shenzhen Institute of Advanced Technology of the Chinese Academy of Sciences approved these protocols.
Animals and ethics statement
Mcm2+/2A mice were generated by Biocytogen and housed at the Shenzhen Institute of Advanced Technology in accordance with the applicable portions of the Animal Welfare Act and the guidelines for the Care and Use of Laboratory Animals. Also, the use of animals for experiments reported herein was approved by Institutional Animal Care and Use Committee (IACUC) at Shenzhen Institute of Advanced Technology, Chinese Academy of Sciences (Protocol no. SIAT-IACUC-200327-HCS-WQ-A1094–01). All mice were maintained in a C57BL/6J background. Details of the strain, sex, genetic background, number and age of mice for each experiment, when applicable, are specified in the respective figure legends and accompanying Supplementary information. DNA isolated from tail biopsies was used for genotyping by PCR (Supplementary Table 1) and Sanger sequencing to confirm the desired gene mutation or knockout. Genotypes of mouse were detailed in Supplementary Tables 2–7.
Cell culture
Mouse E14TG2a ESCs (a kind gift from B. Zhu’s laboratory, Institute of Biophysics, Chinese Academy of Sciences, Beijing, China) were cultured on gelatin-coated dishes in DMEM/F-12 (Gibco) supplemented with 15% (v/v) fetal bovine serum (Gibco), 1% penicillin/streptomycin (Gibco), 1 mM sodium pyruvate (Gibco), 2 mM GlutaMAX (Gibco), 1% MEM nonessential amino acids (Gibco), 55 μM β-mercaptoethanol (Sigma-Aldrich) and 10 ng ml−1 mouse leukemia inhibitory factor (Millipore) in a 37 °C incubator with a humidified, 5% CO2 atmosphere. Cells were passaged using trypsin-EDTA (Gibco) and tested routinely for mycoplasma contamination. Mouse ESCs were authenticated by transcriptional profiling. The transcriptome of our mESCs is highly similar to that of published E14TG2a datasets on ENCODE (GSE66582)38.
Gene editing
Mcm2–2A mutation was performed as described8. Briefly, tyrosine residues 81 and 90 of Mcm2 were mutated to alanine residues using CRISPR–Cas9 guided gene editing following the standard protocol39. Oligonucleotides targeting Mcm2–2A were synthesized and inserted into the pX459 vector (Addgene catalog no. 48139). Mouse ESCs were cotransfected with pX459 plasmids and target oligonucleotide donors using electroporation (Celetrix). After 24 h, ESCs were selected using 2 μg ml−1 puromycin for 2 days and replated as single cells. Single-cell clones were picked after 5–10 days and expanded for genotyping. Pole3 and Hira knockout was performed as Mcm2–2A mutation without oligonucleotide donor and the others were detailed in Supplementary Table 8. Genetic mutations were confirmed with Sanger sequencing.
Neuronal progenitor cell differentiation
ESCs were differentiated into NPCs as described40. ESCs were grown on gelatin-coated dishes in N2B27 medium with a 1:1 mixture of DMEM/F-12 (Gibco) and neurobasal media (Gibco) supplemented with 2 mM GlutaMAX (Gibco), 100 μM β-mercaptoethanol (Sigma-Aldrich) and 1× N-2 and 0.5× B-27 supplements (Gibco). After 7 days, ESCs were replated in suspension, using nonadherent plates, to promote the formation of cellular aggregates over an additional 3 days. Cellular aggregates were harvested and plated on gelatin-coated dishes in N2B27 medium supplemented with 10 ng ml−1 epidermal growth factor and fibroblast growth factor. The aggregates attached, and NPCs grew out of the attached aggregates on differentiation day 11. Medium was changed every 2 days without exposing NPC cultures to air, and cells were passaged using Accutase (Sigma-Aldrich). Cells were washed twice in PBS plus 2% FBS and then stained with antibodies (Supplementary Table 9). Flow cytometry was performed on a FACSCelesta flow cytometer (BD Bioscience) and data were processed using BD FACSDiva (v.8.0.1.1) and FlowJo (v.10.8.1) software packages. The gating strategy is shown in Supplementary Fig. 28.
Immunofluorescence and image analysis
Immunofluorescence was performed using cells grown on gelatin-coated cover glasses. Cells were fixed in 4% paraformaldehyde for 30 min at 37 °C and permeabilized in 0.1% Triton X-100 for 20 min. Cells were then blocked in 5% BSA (w/v) in PBS (10 mM sodium phosphate, 0.15 M NaCl, pH 7.4 at 22 °C). Thereafter, samples were incubated with specific primary antibodies and the corresponding secondary antibodies (Supplementary Table 9) and then costained with 4′,6-diamidino-2-phenylindole (DAPI) (Sigma) to visualize cell nuclei. Slides were mounted in antifade reagent (Beyotime Biotechnology). Images were acquired and examined using a fluorescence microscope system (Invitrogen, Life Technologies). Image overlays were performed using Adobe Photoshop CS4. Immunofluorescence data shown herein include representative micrographs from a single experiment. Each experiment included three replicates that yielded similar results. Antibodies used for various experiments reported here were obtained commercially. Research Resource Identifier (RRID) numbers for all antibodies are listed in Supplementary Table 9.
Mouse embryo culture and genotyping
Six- to eight-week-old female mice were superovulated by injection of pregnant mare serum gonadotropin (PMSG, 10 U, Ningbo Hormone Products Co., Ltd., catalog no. D2014801) and of human chorionic gonadotropin 48 h later (hCG, 10 U, Ningbo Hormone Products Co., Ltd., catalog no. A11002180). Mouse embryos were generated by natural fertilization with mature males (ratio, 1:1). Fertilization occurred at 13–14 h after hCG injection, which was used as a reference time point for subsequent embryonic development (hours post-hCG (hp-hCG)). Embryos were cultured in KSOM medium (Millipore, catalog no. MR-106-D) covered by paraffin oil (Sigma) at 37 °C with 5% CO2 and 5% O2 air. Embryos were processed for further analyses at 48 hp-hCG (two-cell), 58 hp-hCG (four-cell), 82 hp-hCG (morula) and 110 hp-hCG (blastocysts). To extract genomic DNAs for subsequent single early embryonic genotyping, embryos were lysed with 5 μl of DirectPCR lysis reagent (Cell) (Viagen Biotech) containing proteinase K (final concentration, 0.1 mg ml−1; Viagen Biotech). Two rounds of PCR were performed for genotyping using PrimSTAR polymerase (Takara Bio Inc.) (primer sequences in Supplementary Table 1). The second round of PCR with nested primers was performed with 0.5 μl first round PCR product as template and Sanger sequencing was performed with the second primers to detect Mcm2–2A mutation.
CUT&Tag
CUT&Tag was performed as described15,41. Cells (1–2 × 10⁵) were washed twice in 1 ml wash buffer (20 mM HEPES pH 7.5, 150 mM NaCl, 0.5 mM spermidine, 1× protease inhibitor cocktail) at room temperature. Concanavalin-coated magnetic beads (Bangs Laboratories) were washed twice with 1 ml binding buffer (20 mM HEPES pH 7.9, 10 mM KCl, 1 mM CaCl2, 1 mM MnCl2). Cells were resuspended in 1 ml wash buffer and incubated with 10 μl prewashed concanavalin-coated magnetic beads at room temperature for 15 min. Beads (bound to cells) were incubated in antibody buffer (wash buffer, 0.08% digitonin for ESCs/0.05% digitonin for other cells, 2 mM EDTA, 0.1% BSA, 1:100 dilution of the appropriate primary antibody in Supplementary Table 2) on a rotating platform overnight at 4 °C. After washing once with 1 ml dig-wash buffer (wash buffer, 0.08% digitonin for ESCs/0.05% digitonin for other cells) and nutating with 100 μl dig-300 buffer (20 mM HEPES pH 7.5, 300 mM NaCl, 0.5 mM spermidine, 1× protease inhibitor cocktail, 0.01% digitonin), the secondary antibody-bound pAG-Tn5 complex (mixture of 1 μg appropriate secondary antibody (Supplementary Table 9) and pAG-Tn5 adapter complex (Novoprotein, M058-YH01) at 1:2 molar ratio, with the mixture equilibrated at room temperature for 1 h before use) was added and the mixture was incubated at room temperature for 1 h. Beads were washed three times with 1 ml dig-300 buffer and resuspended in tagmentation buffer (dig-300 buffer, 10 mM MgCl2) at 37 °C for 1 h. Beads were washed once with 1 ml TAPS wash buffer (10 mM TAPS, pH 7.5, 0.4 mM EDTA) and incubated in 250 μl dig-300 buffer containing 15 mM EDTA, 0.1% SDS and 100 μg ml−1 proteinase K at 37 °C for 1 h, with shaking at 900 r.p.m. CUT&Tag DNA was extracted with phenol-chloroform-isoamyl alcohol and purified again using the DNA Clean & Concentrator-5 Kit (Zymo Research), with final elution in 20 μl volume. CUT&Tag DNA was incubated with RNase A (1:400 dilution) at 37 °C for 10 min.
To amplify libraries, 10 μl CUT&Tag DNA was mixed with 1 μl uniquely barcoded i5 primer, 1 μl uniquely barcoded i7 primer (using a different barcode for each sample) and 12 μl NEBNext 2× PCR mix. Amplification was performed using the following cycling conditions with the heated lid active: 72 °C for 5 min (gap filling); 98 °C for 30 s; 14 cycles of 98 °C for 10 s and 63 °C for 10 s; final extension at 72 °C for 1 min and hold at 10 °C. Post-PCR clean-up was performed by adding an equal volume of AMPure XP beads (Beckman Coulter), and libraries were incubated with beads for 10 min at room temperature, washed twice gently in 80% ethanol, and eluted in 20 μl volume. The libraries were used for paired-end (2 × 150 bp) sequencing on an Illumina Novaseq or HiSeq X Ten platform by Annoroad Gene Technology Co. Ltd. CUT&Tag qPCR analysis was carried out on CUT&Tag library and CUT&Tag DNA (input) (primer sequences in Supplementary Table 1). Data are presented as percent of input DNA.
Enrichment and sequencing of protein-associated nascent DNA
eSPAN in mouse ESCs was performed as described14,42. Exponentially growing mouse ESCs were treated with BrdU at 50 μM for 30 min. Cells were harvested, washed and bound to concanavalin A-coated magnetic beads. Primary antibodies (Supplementary Table 2) were incubated with cells in antibody buffer (20 mM HEPES NaOH (pH 7.5), 150 mM NaCl, 0.5 mM spermidine, 2 mM EDTA, 0.1% bovine serum albumin, 0.08% digitonin and 1× proteinase inhibitor cocktail) overnight at 4 °C. Secondary antibodies and preassembled pAG-Tn5 complex (Novoprotein, catalog no. M058-YH01) were bound sequentially. Tagmentation was performed at 37 °C for 1 h with gentle shaking. Reactions were stopped by mixing in 20 mM EDTA, 0.1% SDS and proteinase K (0.1 mg ml−1) and incubating at 50 °C for 1 h or 37 °C overnight with gentle shaking. The supernatants were purified using chromatin immunoprecipitation (ChIP) DNA concentrator columns (Zymo Research, D5205). The eluents were then subjected to an oligo replacement reaction. Briefly, the DNA samples were mixed with 0.5 mM deoxynucleotide triphosphate mix, 0.5 μM mosaic end adapter B and 1× Ampligase buffer and incubated in an annealing program (50 °C, 1 min; 45 °C, 10 min; ramp to 37 °C at 0.1 °C s−1 and hold). T4 DNA polymerase and Ampligase were added to the reaction and incubated at 37 °C for 1 h. A portion of the reaction products (5–10%) was saved for CUT&Tag samples, and the rest was boiled for 5 min and immediately chilled on ice. The samples were further diluted with ice-cold BrdU IP buffer (1× PBS and 0.0625% Triton X100) and mixed with Escherichia coli transfer RNA and BrdU antibodies at 4 °C for 2 h. Prewashed protein G beads (25 μl; GE Healthcare, catalog no. 17061802) were added to each sample and the mixtures were rotated at 4 °C for 1 h. After extensive washing, beads were incubated with elution buffer (50 mM Tris-HCl (pH 8.0), 10 mM EDTA and 1% SDS) at 65 °C for 15 min. The supernatants were purified with ChIP DNA concentrator columns, and library PCR was performed using standard Illumina Nextera Dual Indexing primers. Samples were pooled and sequenced using paired-end (2 × 150 bp) sequencing on an Illumina Novaseq or HiSeq X Ten platform by Annoroad Gene Technology Co. Ltd.
Single-cell RNA library preparation and sequencing
Cell suspensions were barcoded using the 10x Chromium Single Cell platform using the Chromium Single Cell 3′ Library, Gel Bead and Multiplex Kit (10x Genomics). Approximately 20,000 cells were loaded, with the intention of capturing 10,000–20,000 single cells per reaction. Single-cell RNA libraries were prepared using the Chromium Single Cell 3′ v.3 Reagent (10x Genomics; catalog nos. PN-1000075, PN-1000073 and PN-120262) according to the manufacturer’s instructions. Each sequencing library was generated with a unique sample index. The libraries were used for paired-end (2 × 150 bp) sequencing on Illumina Novaseq 6000 platforms, performed by BerryGenomics Corporation. We profiled 42,442 cells in total, comprising 8,673 cells that passed the threshold to support clone calling, 883 clones that gave information on lineage relationships at single timepoints and 442 clones spanning multiple timepoints in culture.
scCUT&Tag library preparation and sequencing
scCUT&Tag was performed as described22. Qualified samples were processed using the 10x Chromium Single Cell ATAC-Seq kit, skipping Step 1 (transposition) and starting from Step 2.0 (generation and barcoding). The steps for preparing mastermix, loading chromium chip H and final library amplification (16 PCR cycles) were performed according to the Chromium Single Cell ATAC Library Kit manual (Chromium Next GEM Single Cell ATAC Library and Gel Bead Kit v.1.1; 10x Genomics). The libraries were used for paired-end (2 × 50 bp) sequencing on Illumina Novaseq 6000 platforms, performed by BerryGenomics Corporation.
Addition methods are described in Supplementary Note 10. Data analysis is detailed in Supplementary Note 11.
Statistics and reproducibility
All statistical tests and details (statistical tests and whether one- or two-sided, exact sample size, P values and test statistics) are specified in the respective figure legends. All experimental findings were reliably reproducible. Sample sizes were chosen based on comparable studies as standard for this field of research and the cost of the experiment. No statistical method was used to predetermine sample size. For bulk RNA-Seq, CUT&Tag, eSPAN, CUT&RUN, MNase-seq, MINCE-seq, ATAC-seq and Repli-ATAC-seq, no data were excluded from the analysis. For scRNA-seq and scCUT&Tag, cells that did not pass quality control filters (outlined in detail in Methods) were removed. For mouse experiments, no data were excluded from the analysis. The experiments were not randomized. The investigators were not blinded to allocation during experiments and outcome assessment.
Supplementary Material
Acknowledgements
We thank Q. Li (Center for Energy Metabolism and Reproduction, Shenzhen Institute of Advanced Technology, Chinese Academy of Sciences) for his suggestions and help with embryonic staining, and K. Harper of Harper Health & Science Communications, LLC, for editorial assistance. This work was supported by the following funding: National Key R&D Program of China (grant no. 2019YFA0903800 to H.G.), the Major Program of the National Natural Science Foundation of China (32090031 to H.G.), the Strategic Priority Research Program of the Chinese Academy of Sciences (XDB0480000 to H.G.), the General Program of the National Natural Science Foundation of China (32070610 to H.G.), the National Natural Science Foundation of China for Young Scholars (32000580 to Q.W., 32001043 to Y.S., 32100460 to J.Z. and 32101178 to Y.Y.), the Guangdong Province Fund for Distinguished Young Scholars (2021B1515020109 to H.G.), Guangdong Basic and Applied Basic Research Foundation (2021A1515110377 to X.K.), Shenzhen Institute of Synthetic Biology Scientific Research Program (JCHZ20200005, ZTXM20190019 to H.G.) and National Institutes of Health Grant (R01GM130588 to C.Y.).
Footnotes
Competing interests
The authors declare no competing interests.
Additional information
Supplementary information The online version contains supplementary material available at https://doi.org/10.1038/s41588-023-01477-w.
Peer review information Nature Genetics thanks the anonymous reviewers for their contribution to the peer review of this work. Peer reviewer reports are available.
Reprints and permissions information is available at www.nature.com/reprints.
Reporting summary
Further information on research design is available in the Nature Portfolio Reporting Summary linked to this article.
Code availability
We have made use of publicly available software, tools and code. The public pipeline used to calculate bias via eSPAN analysis is available with the following link: https://github.com/clouds-drift/eSPAN-bias. The published scripts used to call lineage barcodes are available with the following link: https://github.com/AllonKleinLab/LARRY. All other codes used to generate the analysis in this study have been placed in Zenodo through the following link: https://doi.org/10.5281/zenodo.7866527.
Data availability
The datasets generated during and/or analyzed during the current study are available in the Expression Omnibus data base repository (GEO). The next-generation sequencing datasets (RNA-seq, scRNA-seq, CUT&Tag, scCUT&Tag, eSPAN, CUT&RUN, MINCE-seq, ATAC-seq and Repli-ATAC-seq) have been deposited in the GEO with accession GSE185271 (https://www.ncbi.nlm.nih.gov/geo/query/acc.cgi?&acc=GSE185271). Publication ChIP-seq datasets used for comparison were downloaded from GEO (https://www.ncbi.nlm.nih.gov/geo/) under accession numbers GSM3267572 (H3.3, https://www.ncbi.nlm.nih.gov/geo/query/acc.cgi?acc=GSM3267572), GSM2345017 (H3.3, https://www.ncbi.nlm.nih.gov/geo/query/acc.cgi?acc=GSM2345017), GSM1555116 (H3.3, https://www.ncbi.nlm.nih.gov/geo/query/acc.cgi?acc=GSM1555116), GSM1207789 (Hira, https://www.ncbi.nlm.nih.gov/geo/query/acc.cgi?acc=GSM1207789), GSM4774514 (Ezh2, https://www.ncbi.nlm.nih.gov/geo/query/acc.cgi?acc=GSM4774514), GSM4774522 (Jarid2, https://www.ncbi.nlm.nih.gov/geo/query/acc.cgi?acc=GSM4774522), GSM3483858 (Suz12, https://www.ncbi.nlm.nih.gov/geo/query/acc.cgi?acc=GSM3483858), GSM3483878 (H2AK119ub1, https://www.ncbi.nlm.nih.gov/geo/query/acc.cgi?acc=GSM3483878) and GSM3483853 (Ring1B, https://www.ncbi.nlm.nih.gov/geo/query/acc.cgi?acc=GSM3483853). Several ESC marker TF peak location files according published ChIP-seq data were downloaded from ENCODE (https://www.encodeproject.org/) under accession number ENCSR392DGA (Pou5f1 of ESCs, https://www.encodeproject.org/experiments/ENCSR392DGA/). The published E14TG2a datasets were downloaded from GEO under accession number GSE66582 (https://www.ncbi.nlm.nih.gov/geo/query/acc.cgi?acc=GSE66582). Primers for genotyping and qPCR can be found in Supplementary Table 1. Summary of mouse genotypes can be found in Supplementary Tables 2–7. The gRNA and donor sequences for the CRISPR–Cas9 can be found in Supplementary Table 8. The antibody information used for CUT&Tag, scCUT&Tag, eSPAN, CUT&RUN, immuno fluorescence, fluorescent activated cell sorting and western blot can be found in Supplementary Table 9.
References
- 1.Stillman B Histone modifications: insights into their influence on gene expression. Cell 175, 6–9 (2018). [DOI] [PubMed] [Google Scholar]
- 2.Bannister AJ & Kouzarides T Regulation of chromatin by histone modifications. Cell Res. 21, 381–395 (2011). [DOI] [PMC free article] [PubMed] [Google Scholar]
- 3.Scharf AN et al. Monomethylation of lysine 20 on histone H4 facilitates chromatin maturation. Mol. Cell. Biol. 29, 57–67 (2009). [DOI] [PMC free article] [PubMed] [Google Scholar]
- 4.Alabert C et al. Two distinct modes for propagation of histone PTMs across the cell cycle. Genes Dev. 29, 585–590 (2015). [DOI] [PMC free article] [PubMed] [Google Scholar]
- 5.Xu M, Wang W, Chen S & Zhu B A model for mitotic inheritance of histone lysine methylation. EMBO Rep. 13, 60–67 (2011). [DOI] [PMC free article] [PubMed] [Google Scholar]
- 6.Stewart-Morgan KR, Petryk N & Groth A Chromatin replication and epigenetic cell memory. Nat. Cell Biol. 22, 361–371 (2020). [DOI] [PubMed] [Google Scholar]
- 7.Gan H et al. The Mcm2-Ctf4-Polalpha axis facilitates parental histone H3-H4 transfer to lagging strands. Mol. Cell 72, 140–151.e3 (2018). [DOI] [PMC free article] [PubMed] [Google Scholar]
- 8.Petryk N et al. MCM2 promotes symmetric inheritance of modified histones during DNA replication. Science 361, 1389–1392 (2018). [DOI] [PubMed] [Google Scholar]
- 9.Yu C et al. A mechanism for preventing asymmetric histone segregation onto replicating DNA strands. Science 361, 1386–1389 (2018). [DOI] [PMC free article] [PubMed] [Google Scholar]
- 10.Reverón-Gómez N et al. Accurate recycling of parental histones reproduces the histone modification landscape during DNA replication. Mol. Cell 72, 239–249.e5 (2018). [DOI] [PMC free article] [PubMed] [Google Scholar]
- 11.Escobar TM et al. Active and repressed chromatin domains exhibit distinct nucleosome segregation during DNA replication. Cell 179, 953–963.e11 (2019). [DOI] [PMC free article] [PubMed] [Google Scholar]
- 12.Schlissel G & Rine J The nucleosome core particle remembers its position through DNA replication and RNA transcription. Proc. Natl Acad. Sci. USA 116, 20605–20611 (2019). [DOI] [PMC free article] [PubMed] [Google Scholar]
- 13.Reinberg D & Vales LD Chromatin domains rich in inheritance. Science 361, 33–34 (2018). [DOI] [PubMed] [Google Scholar]
- 14.Li Z et al. DNA polymerase alpha interacts with H3-H4 and facilitates the transfer of parental histones to lagging strands. Sci. Adv. 6, eabb5820 (2020). [DOI] [PMC free article] [PubMed] [Google Scholar]
- 15.Kaya-Okur HS et al. CUT&Tag for efficient epigenomic profiling of small samples and single cells. Nat. Commun. 10, 1930 (2019). [DOI] [PMC free article] [PubMed] [Google Scholar]
- 16.Schuettengruber B, Bourbon H-M, Di Croce L & Cavalli G Genome regulation by polycomb and trithorax: 70 years and counting. Cell 171, 34–57 (2017). [DOI] [PubMed] [Google Scholar]
- 17.Morgan MAJ & Shilatifard A Reevaluating the roles of histone-modifying enzymes and their associated chromatin modifications in transcriptional regulation. Nat. Genet. 52, 1271–1281 (2020). [DOI] [PubMed] [Google Scholar]
- 18.Yu C et al. Strand-specific analysis shows protein binding at replication forks and PCNA unloading from lagging strands when forks stall. Mol. Cell 56, 551–563 (2014). [DOI] [PMC free article] [PubMed] [Google Scholar]
- 19.Li S, Prasanna X, Salo VT, Vattulainen I & Ikonen E An efficient auxin-inducible degron system with low basal degradation in human cells. Nat. Methods 16, 866–869 (2019). [DOI] [PubMed] [Google Scholar]
- 20.Ming X et al. Kinetics and mechanisms of mitotic inheritance of DNA methylation and their roles in aging-associated methylome deterioration. Cell Res. 30, 980–996 (2020). [DOI] [PMC free article] [PubMed] [Google Scholar]
- 21.Weinreb C, Rodriguez-Fraticelli A, Camargo FD & Klein AM Lineage tracing on transcriptional landscapes links state to fate during differentiation. Science 367, eaaw3381 (2020). [DOI] [PMC free article] [PubMed] [Google Scholar]
- 22.Bartosovic M, Kabbe M & Castelo-Branco G Single-cell CUT&Tag profiles histone modifications and transcription factors in complex tissues. Nat. Biotechnol. 39, 825–835 (2021). [DOI] [PMC free article] [PubMed] [Google Scholar]
- 23.Wu SJ et al. Single-cell CUT&Tag analysis of chromatin modifications in differentiation and tumor progression. Nat. Biotechnol. 39, 819–824 (2021). [DOI] [PMC free article] [PubMed] [Google Scholar]
- 24.Afsari B, Geman D & Fertig EJ Learning dysregulated pathways in cancers from differential variability analysis. Cancer Inform. 13, 61–67 (2014). [DOI] [PMC free article] [PubMed] [Google Scholar]
- 25.Ramachandran S & Henikoff S Transcriptional regulators compete with nucleosomes post-replication. Cell 165, 580–592 (2016). [DOI] [PMC free article] [PubMed] [Google Scholar]
- 26.Stewart-Morgan KR, Reveron-Gomez N & Groth A Transcription restart establishes chromatin accessibility after DNA replication. Mol. Cell 75, 284–297.e6 (2019). [DOI] [PubMed] [Google Scholar]
- 27.Banaszynski LA et al. Hira-dependent histone H3.3 deposition facilitates PRC2 recruitment at developmental loci in ES cells. Cell 155, 107–120 (2013). [DOI] [PMC free article] [PubMed] [Google Scholar]
- 28.Zhang H et al. RPA interacts with HIRA and regulates H3.3 deposition at gene regulatory elements in mammalian cells. Mol. Cell 65, 272–284 (2017). [DOI] [PMC free article] [PubMed] [Google Scholar]
- 29.Goldberg AD et al. Distinct factors control histone variant H3.3 localization at specific genomic regions. Cell 140, 678–691 (2010). [DOI] [PMC free article] [PubMed] [Google Scholar]
- 30.Xu X et al. Stable inheritance of H3.3-containing nucleosomes during mitotic cell divisions. Nat. Commun. 13, 2514 (2022). [DOI] [PMC free article] [PubMed] [Google Scholar]
- 31.Hojfeldt JW et al. Accurate H3K27 methylation can be established de novo by SUZ12-directed PRC2. Nat. Struct. Mol. Biol. 25, 225–232 (2018). [DOI] [PMC free article] [PubMed] [Google Scholar]
- 32.Xie J et al. Histone H3 threonine phosphorylation regulates asymmetric histone inheritance in the Drosophila male germline. Cell 163, 920–933 (2015). [DOI] [PMC free article] [PubMed] [Google Scholar]
- 33.Wooten M et al. Asymmetric histone inheritance via strand-specific incorporation and biased replication fork movement. Nat. Struct. Mol. Biol. 26, 732–743 (2019). [DOI] [PMC free article] [PubMed] [Google Scholar]
- 34.Tran V, Lim C, Xie J & Chen X Asymmetric division of Drosophila male germline stem cell shows asymmetric histone distribution. Science 338, 679–682 (2012). [DOI] [PMC free article] [PubMed] [Google Scholar]
- 35.Saxton DS & Rine J Epigenetic memory independent of symmetric histone inheritance. eLife 8, e51421 (2019). [DOI] [PMC free article] [PubMed] [Google Scholar]
- 36.Xu X, Hua X, Brown K, Ren X & Zhang Z Mcm2 promotes stem cell differentiation via its ability to bind H3-H4. eLife 11, e80917 (2022). [DOI] [PMC free article] [PubMed] [Google Scholar]
- 37.Atlasi Y & Stunnenberg HG The interplay of epigenetic marks during stem cell differentiation and development. Nat. Rev. Genet. 18, 643–658 (2017). [DOI] [PubMed] [Google Scholar]
- 38.Wu J et al. Stem cells and interspecies chimaeras. Nature 540, 51–59 (2016). [DOI] [PubMed] [Google Scholar]
- 39.Ran FA et al. Genome engineering using the CRISPR–Cas9 system. Nat. Protoc. 8, 2281–2308 (2013). [DOI] [PMC free article] [PubMed] [Google Scholar]
- 40.Conti L et al. Niche-independent symmetrical self-renewal of a mammalian tissue stem cell. PLoS Biol. 3, e283 (2005). [DOI] [PMC free article] [PubMed] [Google Scholar]
- 41.Carter B et al. Mapping histone modifications in low cell number and single cells using antibody-guided chromatin tagmentation (ACT-seq). Nat. Commun. 10, 3747 (2019). [DOI] [PMC free article] [PubMed] [Google Scholar]
- 42.Li Z, Hua X, Serra-Cardona A, Xu X & Zhang Z Efficient and strand-specific profiling of replicating chromatin with enrichment and sequencing of protein-associated nascent DNA in mammalian cells. Nat. Protoc. 16, 2698–2721 (2021). [DOI] [PMC free article] [PubMed] [Google Scholar]
Associated Data
This section collects any data citations, data availability statements, or supplementary materials included in this article.
Supplementary Materials
Data Availability Statement
The datasets generated during and/or analyzed during the current study are available in the Expression Omnibus data base repository (GEO). The next-generation sequencing datasets (RNA-seq, scRNA-seq, CUT&Tag, scCUT&Tag, eSPAN, CUT&RUN, MINCE-seq, ATAC-seq and Repli-ATAC-seq) have been deposited in the GEO with accession GSE185271 (https://www.ncbi.nlm.nih.gov/geo/query/acc.cgi?&acc=GSE185271). Publication ChIP-seq datasets used for comparison were downloaded from GEO (https://www.ncbi.nlm.nih.gov/geo/) under accession numbers GSM3267572 (H3.3, https://www.ncbi.nlm.nih.gov/geo/query/acc.cgi?acc=GSM3267572), GSM2345017 (H3.3, https://www.ncbi.nlm.nih.gov/geo/query/acc.cgi?acc=GSM2345017), GSM1555116 (H3.3, https://www.ncbi.nlm.nih.gov/geo/query/acc.cgi?acc=GSM1555116), GSM1207789 (Hira, https://www.ncbi.nlm.nih.gov/geo/query/acc.cgi?acc=GSM1207789), GSM4774514 (Ezh2, https://www.ncbi.nlm.nih.gov/geo/query/acc.cgi?acc=GSM4774514), GSM4774522 (Jarid2, https://www.ncbi.nlm.nih.gov/geo/query/acc.cgi?acc=GSM4774522), GSM3483858 (Suz12, https://www.ncbi.nlm.nih.gov/geo/query/acc.cgi?acc=GSM3483858), GSM3483878 (H2AK119ub1, https://www.ncbi.nlm.nih.gov/geo/query/acc.cgi?acc=GSM3483878) and GSM3483853 (Ring1B, https://www.ncbi.nlm.nih.gov/geo/query/acc.cgi?acc=GSM3483853). Several ESC marker TF peak location files according published ChIP-seq data were downloaded from ENCODE (https://www.encodeproject.org/) under accession number ENCSR392DGA (Pou5f1 of ESCs, https://www.encodeproject.org/experiments/ENCSR392DGA/). The published E14TG2a datasets were downloaded from GEO under accession number GSE66582 (https://www.ncbi.nlm.nih.gov/geo/query/acc.cgi?acc=GSE66582). Primers for genotyping and qPCR can be found in Supplementary Table 1. Summary of mouse genotypes can be found in Supplementary Tables 2–7. The gRNA and donor sequences for the CRISPR–Cas9 can be found in Supplementary Table 8. The antibody information used for CUT&Tag, scCUT&Tag, eSPAN, CUT&RUN, immuno fluorescence, fluorescent activated cell sorting and western blot can be found in Supplementary Table 9.