

Abstract
Metabolic dysfunction-associated steatotic liver disease (MASLD) affects one third of the global population. Understanding metabolic pathways involved can provide insights into disease progression and treatment. Untargeted metabolomics of livers from mice with early-stage steatosis uncovered decreased methylated metabolites, suggesting altered one-carbon metabolism. The levels of glycine, a central component of one-carbon metabolism, were lower in mice with hepatic steatosis, consistent with clinical evidence. Stable-isotope tracing demonstrated that increased serine synthesis from glycine via reverse serine hydroxymethyltransferase (SHMT) is the underlying cause for decreased glycine in steatotic livers. Consequently, limited glycine availability in steatotic livers impaired glutathione synthesis under acetaminophen-induced oxidative stress, enhancing acute hepatotoxicity. Glycine supplementation or hepatocyte-specific ablation of the mitochondrial SHMT2 isoform in mice with hepatic steatosis mitigated acetaminophen-induced hepatotoxicity by supporting de novo glutathione synthesis. Thus, early metabolic changes in MASLD that limit glycine availability sensitize mice to xenobiotics even at the reversible stage of this disease.
Keywords: MASLD, glycine, acetaminophen hepatotoxicity, glutathione, xenobiotic, one carbon metabolism, SHMT
Graphical Abstract

Blurb
Ghrayeb et al. reveal enhanced serine synthesis via reversed serine hydroxymethyltransferase 2 (SHMT2) activity in hepatic steatosis, uncovering a mechanism for the commonly observed glycine decrease in metabolic dysfunction-associated steatotic liver disease (MASLD). This restricts glutathione synthesis and causes acetaminophen hypersensitivity, which is alleviated by dietary or genetic glycine elevation.
Introduction
MASLD (formerly known as non-alcoholic fatty liver disease, NAFLD) is a leading cause of liver disease worldwide with numbers rising continuously1. While hepatic steatosis, a hallmark feature of MASLD, is reversible, it can progress to the more severe metabolic dysfunction-associated steatohepatitis (MASH) characterized by hepatocyte damage and inflammation which leads to fibrosis that can deteriorate to cirrhosis and/or hepatocellular carcinoma2. Indeed, MASLD is becoming the leading cause of liver failure and there is growing interest in disease etiology, pathogenesis, and potential therapeutic strategies1.
Metabolic changes are key to the development and exacerbation of MASLD. One of the early hallmarks of hepatic steatosis is the accumulation of lipid droplets in hepatocytes2. In addition to changes in fatty acid and carbohydrate metabolic pathways, which have been classically linked to MASLD, amino acid metabolism has emerged as a new feature in its pathogenesis3,4. Consistent changes in levels of specific amino acids in the circulation and the liver were reported in patients and pre-clinical models4. For example, considerable epidemiological evidence links lower levels of circulating glycine to MASLD, cardiometabolic diseases and metabolic syndrome3,5–7. Glycine-based therapy has been shown to improve metabolic parameters in humans and pre-clinical models8–12. However, the mechanism behind the characteristic decrease in glycine levels in MASLD remains poorly understood.
The liver is the main site of drug metabolism and one consequence of the metabolic changes under MASLD is the effect on drug toxicity13–15. While early-stage MASLD does not have clear clinical symptoms and is usually undiagnosed, the metabolic changes that occur at this reversible stage of the disease may affect drug hepatotoxicity13,16. In the current study, models of early-stage MASLD and drug hepatotoxicity combined with stable-isotope tracing, elucidated the underlying metabolic mechanisms by which circulating and hepatic glycine levels are decreased. We further examined the consequences of limited glycine availability on glutathione (GSH) biosynthesis and sensitivity to acetaminophen (APAP), a common analgesic and anti-pyretic drug, which is a leading cause of acute liver failure17,18. Hepatocyte-specific genetic mouse models demonstrated that limited glycine availability due to its enhanced conversion to serine in the mitochondria is key to elevated APAP sensitivity in early-stage MASLD.
Results
One carbon metabolism deficiency in hepatic steatosis
To understand the initial underlying metabolic changes that occur in MASLD, we analyzed the liver metabolome at an early stage of the disease where only hepatic steatosis is present. To this end, mice were fed a high-fat high-sucrose diet (Western diet, WD) or standard chow diet (CD) for 10 weeks. Mice fed the WD displayed increased body weight gain, elevated liver to body weight ratio, elevated levels of circulating liver enzymes, alanine transaminase (ALT), aspartate aminotransferase (AST), lactate dehydrogenase (LDH), and elevated cholesterol (Figure 1A–B, Figure S1A–D). Gross morphological analysis showed an increase in liver size and yellow coloration of the liver, indicating higher fat content (Figure 1C). Histological and biochemical analyses confirmed hepatic steatosis with micro- and macro-steatosis as well as enhanced neutral lipids visualized using Oil Red O staining, and elevated levels of triglycerides and cholesterol in the liver (Figure 1D, Figure S1E–F). Untargeted metabolic profiling of liver and plasma samples identified 324 compounds in the liver and 260 in the plasma. Of these, 100 metabolites in the liver and 92 metabolites in the plasma showed statistically significant changes in mice with WD-induced hepatic steatosis compared to control CD fed mice, revealing distinct metabolic profiles in each group (Figure 1E–F). Many methylated compounds in the liver and plasma were significantly lower in mice with hepatic steatosis (Figure 1G–H, Table S1 and S2, indicated in red). Pathway enrichment analysis of the significantly altered metabolites in the liver and plasma revealed that serine and glycine metabolism as well as the methylation cycle (termed methionine metabolism and betaine metabolism) were among the most significantly enriched pathways (Figure 1I–J).
Figure 1: Downregulation of one carbon metabolism in mice with hepatic steatosis.

C57BL/6 mice were fed a standard chow diet (CD) or Western diet (WD) for 10 weeks. (A–B) Liver enzymes measured in the plasma, (A) ALT and (B) AST (n=6–7 in the CD group and n=5 in the WD group). (C) Gross liver morphology. (D) H&E and Oil Red O (ORO) imaging (scale bars: 20 μm). (E–F) Principal component analysis (PCA) of 1,200 chromatographic feature intensities detected in the (E) liver (n=7 in the CD group and n=5 in the WD group) and (F) 1,081 in the plasma (n=20 in the CD group and n=12 in the WD group) colored by group. (G–H) Volcano plots showing the relative changes in metabolite levels between the experimental groups in the (G) liver (324 metabolites; n=7 in the CD group and n=5 in the WD group) and (H) plasma (260 metabolites; n=20 in the CD group and n=12 in the WD group). Metabolites with non-significant differences are represented in grey, metabolites with significant differences (−log p-value >1.3) are represented in black and methylated metabolites significantly different among CD and WD fed mice are represented in red. (I–J) Pathway enrichment analysis based on significantly altered metabolites among WD and CD fed mice in the (I) liver and (J) plasma. (K–L) Glycine levels in the (K) liver (n=7 in the CD group and n=5 in the WD group) and (L) plasma (n=20 in the CD group and n=12 in the WD group) measured using LC-MS. (M) Heat map representing the levels of downstream glycine metabolites in WD or CD fed mice. (N–O) Ratio of serine to glycine in the (N) liver (n=7 in the CD group and n=5 in the WD group) and (O) plasma (n=20 in the CD group and n=12 in the WD group). Data are mean ± SEM. Each point represents an individual mouse. P values were determined by two-tailed Student’s t-test.
One of the main factors regulating methylation processes is the availability of one carbon units which can be transferred to different substrates from folate and other methyl carriers (e.g. trimethylglycine aka betaine)19,20. The liver is known as a main site for one carbon metabolism, and alterations in lipid methylation have been reported in MASLD20–22. The interconversion of serine and glycine concomitantly with the transfer of a methyl group to/from tetrahydrofolate are key regulatory reactions in one carbon metabolism catalyzed by serine hydroxymethyltransferase (SHMT). These reactions occur both in the cytoplasm and in the mitochondria by SHMT1 and SHMT2, respectively19. Additionally, in the liver, glycine serves as a methyl donor through the glycine cleavage system which generates methyl tetrahydrofolate and CO219. Glycine also serves as a methyl acceptor for glycine N-methyl transferase (GNMT) which produces monomethylglycine (sarcosine), and GNMT ablation in mice leads to hepatic steatosis23. Indeed, glycine, sarcosine and betaine were among the significantly decreased metabolites in steatotic livers compared to control (Figure 1G–H; Tables S1 and S2). Moreover, in line with previous reports, glycine levels were significantly decreased in mice with hepatic steatosis, even at this early stage of MASLD (Figure 1K–L)12,24. To confirm that the observed decrease in glycine is due to hepatic steatosis rather than a specific diet, we utilized another dietary model where mice were fed with a high-fructose, high-fat diet. This also resulted in body weight gain, elevated levels of circulating ALT and increased liver triglyceride content leading to mild hepatic steatosis (microsteatosis) concomitant with a significant decrease in circulating glycine (Figure S1G–K). Together, these findings, based on untargeted metabolomics and two dietary mouse models, indicate lower glycine availability in early-stage MASLD.
Glycine depletion in hepatic steatosis is caused by increased serine synthesis
Although glycine depletion in MASLD has been consistently reported3,4,7,8, the underlying metabolic mechanisms remain unknown. To address this, we first focused our attention on downstream products of glycine. A consistent decrease in most glycine-derived metabolites was observed in mice with hepatic steatosis (Figure 1M, Figure S1L–T) likely due to limited glycine availability. In contrast, hepatic serine levels did not decrease while plasma serine levels were significantly elevated, resulting in an increased serine to glycine ratio in mice with hepatic steatosis (Figure 1N–O, Figure S1U–V). This suggests enhanced reverse SHMT activity as a possible mechanism for the observed glycine depletion in MASLD. To test this, we performed stable-isotope tracing in mice with or without hepatic steatosis using uniformly labeled 13C2 glycine (Figure 2A). 13C2 glycine administration elevated total plasma glycine both in CD and WD fed mice and consequently liver glycine was also elevated although it remained lower in WD fed mice (Figure 2B–C). Importantly, serine labeling pattern in the liver indicated that a considerable fraction of serine was synthesized from glycine (Figure 2D). Furthermore, an appreciable fraction of serine labeling was on all three carbons (M+3) indicative of combined glycine utilization via SHMT and the mitochondrial glycine cleavage system for de novo synthesis of serine from two glycine molecules (Figure 2D–F). Serine levels and labeling pattern in the plasma suggested a higher rate of serine synthesis from glycine in mice with hepatic steatosis (Figure 2G). Tracing of glycine-derived carbons to other downstream metabolites did not show increased contribution in mice with hepatic steatosis (Figure S2A–J). To test whether serine synthesis from glycine is the cause for decreased glycine in MASLD, a pan-SHMT inhibitor, SHIN1, targeting both the cytoplasmic SHMT1 and the mitochondrial SHMT2 was used25,26. As expected, SHIN1 treatment of mice with hepatic steatosis blocked serine synthesis from glycine and significantly lowered total levels of serine in the liver and plasma (Figure 2H–I). Importantly, SHIN1 significantly elevated glycine levels in the liver and plasma in the WD fed mice (Figure 2J–K). Of note, unlike the effect on liver glycine, SHIN1 treatment did not significantly elevate glycine levels in the kidney, a major organ for serine biosynthesis27 (Figure S2K–M). Together, these findings confirm that glycine depletion in MASLD is driven by enhanced synthesis of serine in the liver via SHMT.
Figure 2: Increased serine synthesis causes glycine depletion in hepatic steatosis.

13C2 glycine tracing in CD and WD fed mice. (A) Schematic representation of the experimental design. (B–E) Quantification of glycine and serine isotopologues in the (B, D) liver (n=7 in the CD group and n=5 in the WD group, n=5 in the CD-glycine group and n=5 in the WD-glycine group) and (C, E) plasma (n=20 in CD, n=12 in WD, n=5 in CD-glycine and n=4 in WD-glycine group). (F) Schematic representation of glycine contribution to serine synthesis via SHMT and the glycine cleavage system including the possible number of 13C2-glycine-derived carbons in each serine isotopologue. (G) The ratio of the weighted sum of serine isotopologues to labeled glycine in the plasma, calculated by multiplying each serine isotoplouge with the number of 13C2 glycine molecules needed for synthesis, as follows: ((M+1) nmol/ml X 1) + ((M+2) nmol/ml X 1) + ((M+3) nmol/ml X 2) (n=5 in the CD group and n=4 in the WD group). (H–K) Metabolic analysis of the liver and plasma 70 minutes following SHMT inhibitor administration (n=3 in the vehicle group and n=4 in the SHMT inhibitor group). (L) Immunoblotting of SHMT2 in livers from Shmt2fl/fl Alb-Cre (+) mice and Shmt2fl/fl Alb-Cre (−) littermate controls. (M) Circulating levels of glycine measured using LC-MS in Shmt2fl/fl Alb-Cre (+) mice and Shmt2fl/fl Alb-Cre (−) littermate controls (n=3). Each point represents an individual mouse. Data are mean ± SEM. P values determined by two-tailed Student’s t-test (B, G–K, M) or one-way analysis of variance (ANOVA), followed by Tukey’s test (C–E).
Subsequently, we utilized a metabolomic-based approach to explore the possible fate of glycine-derived serine. Serine condensation with palmitoyl Co-A to form sphinganine is the first step in sphingolipid metabolism (Figure S3A). Sphingolipids are known to accumulate in steatotic livers28. Total sphinganine levels were indeed elevated in steatotic livers, and sphinganine labeling pattern indicated incorporation of labeled glycine-derived serine (Figure S3B). Serine incorporation was higher in steatotic livers as well as the relative fraction of labeled sphinganine (Figure S3B–C). Moreover, inhibition of SHMT activity eliminated sphinganine labeling (Figure S3D), validating that glycine-derived serine contributes to sphingolipid production.
We next sought to confirm that the decreased glycine in hepatic steatosis is the direct outcome of metabolic changes in hepatocytes and to determine mitochondrial SHMT2 involvement. To this end, we employed a CRISPR-Cas9 approach combined with a Cre-lox recombination system to generate mice with conditional knockout of SHMT2 (Shmt2fl/fl). We further generated mice with hepatocyte-specific loss of SHMT2 by crossing the Shmt2fl/fl with Alb-Cre mice (Shmt2HKO, Figure 2L, Figure S3E–F). Shmt2HKO mice fed the WD demonstrated a marked increase in circulating glycine levels compared to Shmt2fl/fl littermate controls (Figure 2M) independent of changes in body weight gain or liver to body weight ratio (Figure S3G–H). Altogether, these data indicate that reversed activity of the SHMT2 isoform in hepatocytes drives the decrease in glycine in hepatic steatosis.
Limited glycine availability in steatotic hepatocytes enhances susceptibility to xenobiotic-mediated oxidative stress
An important consequence of lower glycine availability in metabolic diseases is impaired synthesis of GSH6,8,12,29. Synthesized from three amino acids – glutamate, cysteine, and glycine, GSH is a major cellular antioxidant (Figure S4A). Importantly, untargeted metabolomics revealed lower liver GSH levels in mice with hepatic steatosis concomitant with a decrease in glycine (Figure 1L and Figure S1N), while no changes were detected in glutamate or cysteine (Figure S4B–C). A small fraction of GSH was labeled with 13C2 glycine suggesting a relatively slow turnover compared to serine synthesis (Figure S2C). To examine the biochemical consequences of lipid accumulation on glycine and GSH metabolism in hepatocytes, we used the immortalized mouse hepatocyte cell line, AML12. The cells were incubated with palmitate or oleate. Palmitate loading is known to induce lipotoxicity characterized by oxidative and endoplasmic reticulum (ER) stress, which is considered to drive MASLD pathogenesis30. The monounsaturated fatty acid, oleate, is less toxic than the saturated fatty acid palmitate, and has been reported to protect against lipotoxicity31,32. Cells incubated with palmitate or oleate for 24 hours formed lipid droplets (Figure S4D), a characteristic of hepatic steatosis. In line with our in vivo findings, intracellular levels of glycine and GSH were significantly decreased in palmitate-loaded, but not in oleate-loaded AML12 cells (Figure 3A–B). Unlike oleate, palmitate treatment resulted in increased oxidative stress as indicated by the superoxide fluorescent indicator dihydroethidium (DHE) (Figure 3C).
Figure 3: Lipid loading decreases intracellular glycine and GSH and increases sensitivity to APAP in cultured hepatocytes.
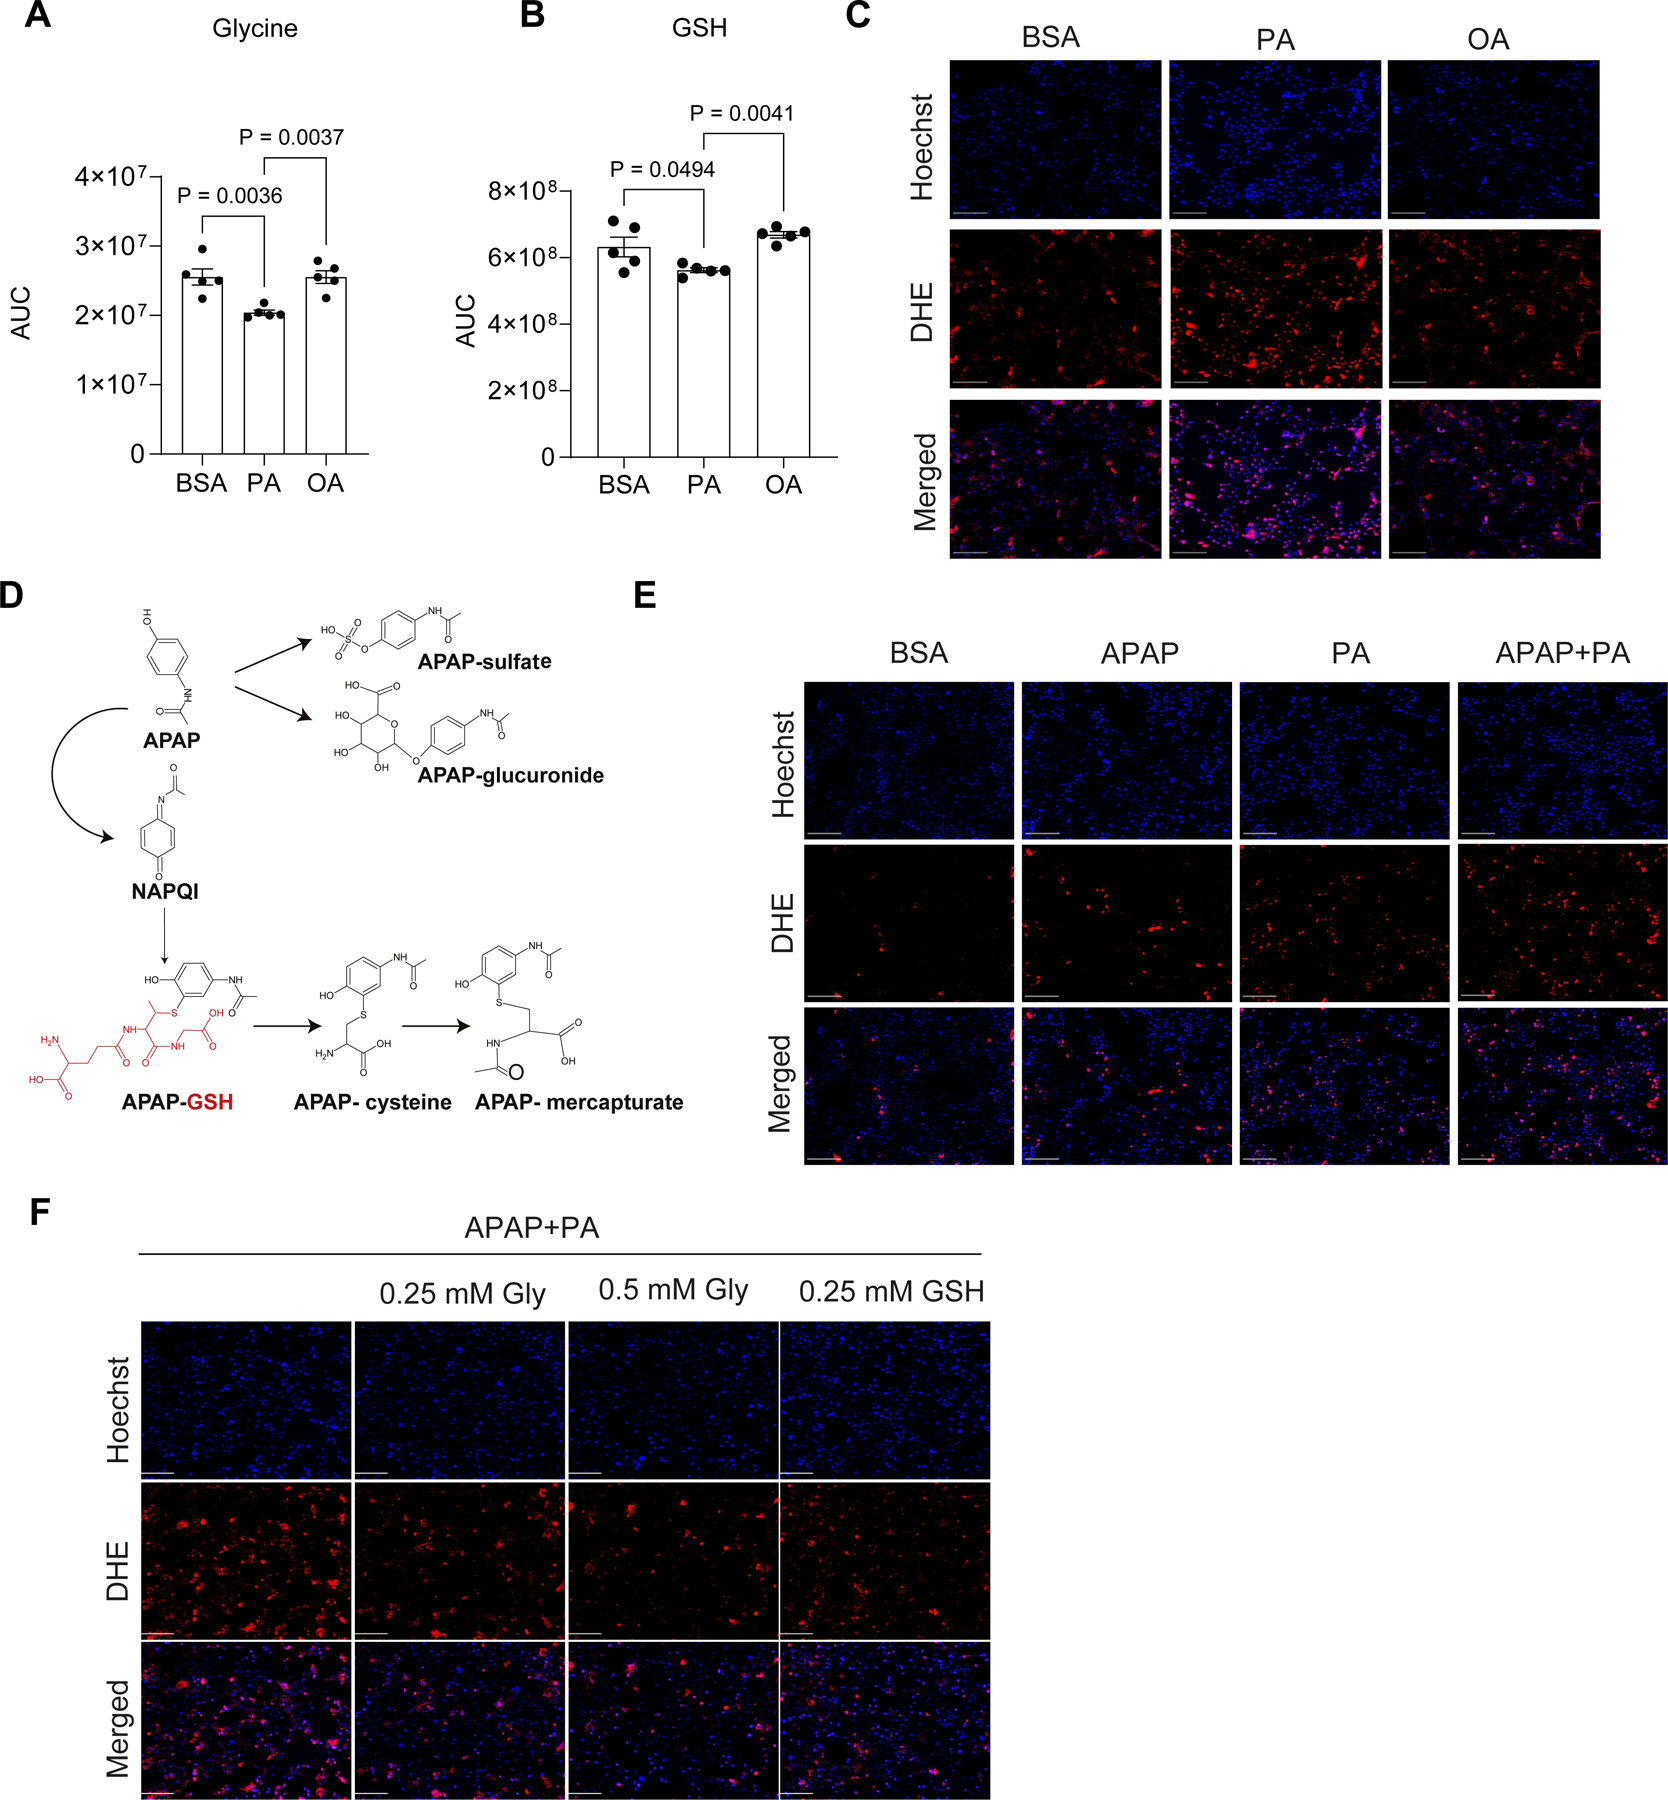
(A–C) AML12 cells were incubated with BSA, 200 μM palmitate (PA) or oleic acid (OA) for 24 hrs. (A, B) Levels of the indicated metabolites were determined by LC-MS. (C) Superoxide was visualized with dihydroethidium (DHE, red) and nuclei were stained with Hoechst (blue) in live cells (scale bar: 50 μm). (D) Schematic representation of APAP metabolism in the liver. (E) DHE (red) and Hoechst (blue) staining in live cells 12 hours following the indicated treatments (scale bar: 50 μm). (F) Superoxide was visualized with DHE (red) and nuclei were stained with Hoechst (blue) in cells incubated for 12 hours in glycine depleted medium with the indicated treatments (scale bar: 50 μm). All graphs and images are representative of three independent experiments with at least three wells in each experiment. Data are mean ± SEM. P values were determined by one-way ANOVA, followed by Tukey’s test (A–B).
Hepatic GSH is a key player in xenobiotic neutralization, thus lower GSH availability may have deleterious consequences on drug metabolism and their toxicity33,34. Acetaminophen (APAP) is a widely used analgesic and anti-pyretic drug. It is commonly prescribed and considered to be safe. Nevertheless, APAP overdose is the leading cause of acute liver failure worldwide17,18. In safe doses, APAP is converted in the liver to non-toxic compounds while a small fraction of the drug is metabolized to a reactive free radical, N-acetyl-p-benzoquinone imine (NAPQI), which is then neutralized by GSH (Figure 3D). Treatment of AML12 cells with APAP for 12 hours enhanced superoxide formation, which was increased when APAP was co-administered with palmitate (Figure 3E). Importantly, co-treatment with either glycine or GSH lowered the elevated superoxide levels induced by palmitate and APAP (Figure 3F), indicating a role for glycine availability in APAP-induced oxidative stress.
Epidemiological evidence suggests that patients with MASLD have an increased risk for APAP toxicity, but results from pre-clinical studies are inconclusive17,35–37. We therefore examined whether mice with WD-induced hepatic steatosis and lower hepatic GSH (Figure S1N) are more susceptible to APAP toxicity. First, we determined APAP metabolism and toxicity in mice fed the CD at increasing doses from 300 to 600 mg/kg. These doses are equivalent to 2–4 times the maximum single dose recommendations in humans38,39. APAP and its main downstream metabolites following sulfate or glucuronide conjugation (Figure 3D) were detected in the plasma in a dose-dependent manner (Figure S5A–C). However, catabolic products of NAPQI conjugated to GSH, namely APAP-cysteine and APAP-meracapturate, reached their maximum levels already at 300 mg/kg (Figure S5D–E). Metabolism of APAP occurs mainly in cells proximal to the central vain (zone 3) that express the cytochrome p450 enzyme, CYP2E140,41. Histological analysis at 24 hours post APAP administration demonstrated necrosis in zone 3 at all doses, however, APAP given at 450 and 600 mg/kg caused more extensive damage (ballooning degeneration) beyond zone 3 (Figure S5F). Furthermore, signs of distress were observed in APAP-treated mice receiving 450 and 600 mg/kg (not shown) while only 1 out of 9 mice treated with 300 mg/kg showed signs of distress (video S1A, Figure S5G, CD group). Therefore, we selected a dose of 300 mg/kg for APAP studies in mice with and without hepatic steatosis.
To determine the effect of hepatic steatosis on APAP toxicity, mice were fed with WD or CD for 10 weeks followed by a single dose of APAP (300 mg/kg) or saline (Figure 4A). APAP administration to mice with WD-induced hepatic steatosis resulted in extremely high levels of the circulating transaminases ALT and AST 24 hours post injection (Figure 4B–C), indicating enhanced APAP hepatotoxicity in MASLD. Examination of the liver gross morphology revealed visible hemorrhage in livers from mice fed the WD, but not the CD (Figure 4D). Histological analysis demonstrated hemorrhaging in zone 3 with a significantly higher histological score in mice with hepatic steatosis (Figure 4E–F). In sharp contrast to the results observed in CD fed mice, mice with hepatic steatosis that were treated with APAP showed visible clinical signs (Figure S5G, video S1B). Kinetics studies revealed that GSH was depleted 3 hours following APAP administration in both CD and WD fed mice (Figure 4G). Nevertheless, and in line with our in vivo and in vitro findings above, mice with hepatic steatosis showed a lower ability to recover GSH levels (Figure 4G) and demonstrated elevated oxidative stress as indicated by a higher ratio of oxidized to reduced glutathione (GSSG/GSH, Figure 4H). In accordance with enhanced oxidative stress, the expression of NRF2 target genes, heme oxygenase 1 (Hmox1) and NAD(P)H quinone dehydrogenase 1 (Nqo1), was increased in mice with hepatic steatosis that were treated with APAP (Figure 4I).
Figure 4: Mice with hepatic steatosis display decreased GSH recovery, increased oxidative stress and hepatotoxicity.

(A) Schematic representation of the experimental design. APAP (300 mg/kg) was administered intraperitoneally (I.P.) to CD and WD fed mice. (B) Plasma levels of ALT and (C) AST (n=9 in the CD group and n=6 in the WD group). (D) Gross liver morphology, (E) H&E staining (scale bars: 100 μm), and (F) histological scores of hemorrhage 24 hours following APAP injection (n=7 in the CD group and n=6 in the WD group). (G) Hepatic GSH levels determined by LC-MS at indicated time points (0 hour: n=12 in the CD group and n=7 in the WD group; 3 hours: n=11 in the CD group and n=5 in the WD group; 6 hours: n=11 in the CD group and n=7 in the WD group; 12 hours: n=5 per group). (H) GSSG/GSH ratio calculated from GSH and GSSG levels measured using LC-MS 12 hours following APAP administration (n=5 per group). (I) qPCR analysis of Nqo1 and Hmox1 expression relative to Gapdh 6 hours following APAP administration in livers from CD or WD fed mice (n=6 in the CD group and n=7 in the WD group). Data are mean ± SEM. Each point represents an individual mouse. P values were determined by two-tailed Student’s t-test (B, C, G–I).
Finally, to validate that increased APAP sensitivity is directly induced by hepatic steatosis rather than by other differences in the dietary composition of CD and WD, we compared mice fed the WD to low-fat, low-sugar control diet (LFD) which is otherwise ingredient-matched. Similar to the results observed with CD fed mice, mice fed the LFD showed the same trends when compared to mice fed WD regarding body weight gain, liver to body weight ratio, circulating ALT and AST as well as liver morphology and histology (Figure S5H–L). Following administration of APAP, a marked increase in circulating transaminases and hepatic hemorrhage was found in mice fed the WD when compared with mice fed the LFD (Figure S5M–O). Altogether, these findings indicate that hepatic steatosis, rather than nutritional limitations in the WD, enhances susceptibility to APAP hepatotoxicity.
Glycine administration rescues hepatic GSH levels and mitigates APAP toxicity in hepatic steatosis
Considering that limited glycine availability enhances susceptibility to APAP, we next sought to determine whether glycine treatment could lower APAP toxicity in hepatic steatosis. To this end, we treated mice with hepatic steatosis with 1 g/kg glycine6,8,42 immediately after APAP administration and again 3 hours later, when GSH levels are depleted and its recovery is initiated (Figure 4G, Figure 5A). Oral glycine administration significantly elevated hepatic glycine and doubled GSH in the liver 6 hours post APAP administration (Figure 5B–C). Indeed, mice treated with 13C2 glycine showed considerable labeling of GSH 6 hours after APAP administration (Figure 5D), confirming that glycine supports de novo synthesis of GSH in steatotic livers. Accordingly, glycine treatment alleviated APAP-induced oxidative stress, lipid peroxidation, and DNA damage as indicated by the lower GSSG/GSH ratio (Figure 5E), GSH conjugated to the lipid peroxide product 4-hydroxynonenal (4-HNE, Figure 5F), and the phosphorylation of histone H2A (gamma-H2A.X, Figure 5G) that occurs in genomic sites of DNA double strand breaks. Functionally, glycine administration protected from liver damage as measured by the circulating ALT and AST (Figure 5H–I). The effect of glycine was comparable to that of N-acetylcysteine (NAC), which is the standard of care for APAP overdose to support GSH synthesis through cysteine administration17 (Figure S6A–B). Of note, administrating equimolar amounts of D-alanine, an amino acid that does not contribute to GSH synthesis or other major metabolic pathways, did not significantly lower ALT and AST (Figure S6A–B). In line with these findings, glycine treatment significantly lowered APAP-induced liver hemorrhage and necrosis and improved clinical signs (Figure 5J–M, video S1C). Altogether, these results indicate that glycine treatment protects against the enhanced APAP hepatotoxicity in MASLD.
Figure 5: Glycine rescues hepatic GSH levels and mitigates APAP hepatotoxicity in hepatic steatosis.

(A) Schematic representation of the experimental design. WD fed mice were orally administrated (gavage) with 1 g/kg glycine following APAP injection (300 mg/kg). (B–C) Liver glycine and GSH levels 6 hours following APAP and glycine administration as determined by LC-MS (n=7 in the saline group and APAP groups, n=6 in the APAP+Gly group). (D) Relative levels of 13C isotopologues 6 hours following APAP and 13C2 glycine administration (n=4). (E–F) Redox stress index and 4-HNE conjugated to GSH as measured using LC-MS (n=7 in the saline and APAP groups, n=6 in the APAP+Gly group). (G) Immunoblotting for γ-H2AX in liver lysates 24 hours following APAP and glycine administration with relative quantification. β-actin was used as loading control (n=4 in the APAP group, and n=5 in the APAP+Gly group). (H–I) Liver enzymes in the plasma 24 hours following administration of APAP and glycine (n=4–5 in the saline group, n=7 in the APAP group, and n=11–15 in the APAP+Gly group). (J) Liver morphology, (K) representative H&E histology in the liver (scale bar: 200 μm), and (L) histological score of hemorrhage and necrosis 24 hours following APAP and glycine administration (n=4 in in the saline group, n=7 in the APAP group, and n=10 in the APAP+Gly group). (M) Mice were video-recorded 24 hours after APAP administration and the percent time spent mobile was determined (n=6 in the APAP group, and n=8 in the APAP+Gly group). Data are mean ± SEM. Each point represents an individual mouse. P values were determined by one-way ANOVA followed by Tukey’s test (B–C, E–F, H–I) or two-tailed Student’s t-test (L–M).
Hepatocyte-specific ablation of SHMT2 restores glycine and GSH levels and mitigates APAP toxicity in hepatic steatosis
Considering that glycine depletion in hepatic steatosis is driven by enhanced serine synthesis in hepatocytes due to reversed SHMT2 activity, we next sought to determine whether the loss of hepatocyte SHMT2 protects against APAP hepatotoxicity. To this end, we fed Shmt2HKO mice and their Shmt2fl/fl littermate controls the WD for 10 weeks followed by APAP administration (Figure 6A). Shmt2HKO mice demonstrated higher levels of liver glycine and GSH compared to control mice (Figure 6B–C), resulting in lower oxidative stress and DNA damage (Figure 6D–E). Accordingly, significantly lower levels of circulating ALT were measured in Shmt2HKO mice compared to Shmt2fl/fl littermates (Figure 6F). Morphological and histological analyses demonstrated lower liver hemorrhage and necrosis as well as improved clinical signs in Shmt2HKO mice (Figure 6G–I and video S2). These findings indicate that blocking SHMT2 in hepatocytes protects against the enhanced APAP hepatotoxicity in MASLD by increasing glycine availability to support GSH synthesis.
Figure 6: Hepatocyte-specific loss of SHMT2 mitigates APAP toxicity in hepatic steatosis.

(A) Schematic representation of the experimental design. WD fed Shmt2fl/fl and Shmt2HKO mice were administered 300 mg/kg APAP. (B–D) LC-MS analysis of the indicated metabolites 6 hours following APAP injection (n=3). (E) Immunoblotting for γ-H2AX relative to GAPDH in liver lysates 24 hours following APAP (n=4). (F) Plasma ALT 24 hours following APAP administration (n=8 Shmt2fl/fl Alb-Cre(−) and n=13 in Shmt2fl/fl Alb-Cre(+)). (G) Representative liver morphology and H&E histology (scale bar: 100um), and (H) histological score of hemorrhage and necrosis 24 hours following APAP administration n=8 Shmt2fl/fl Alb-Cre (−) and n=13 in Shmt2fl/fl Alb-Cre (+)). (I) Mice were video-recorded 24 hours after APAP administration and percent time spent mobile was assessed (n=7 Shmt2fl/fl Alb-Cre(−) and n=11 Shmt2fl/fl Alb-Cre(+)). Data are mean ± SEM. Each point represents an individual mouse. P values were determined by two-tailed Student’s t-test (B–F, H–I).
Discussion
We studied the metabolic profile of mice at the early stages of MASLD characterized by simple hepatic steatosis. While this can be a stable and even a reversible stage, it is the first step towards a more advanced liver disease2. Metabolic changes in hepatic steatosis have been extensively studied and naturally have mainly focused on central pathways that would result in lipid accumulation in hepatocytes, namely carbohydrate and fatty acid metabolism. Expectedly, our untargeted metabolomic analysis detected changes in various fatty acids and acyl-carnitines (Figure 1 and Table S1). Notably, analysis of the liver metabolome also demonstrated a decrease in methylated metabolite species in steatotic livers, indicating changes in one carbon metabolism. The liver is a main site of one carbon metabolism and this pathway, which is also connected to hepatic lipid and phospholipid homeostasis, has been implicated in the pathophysiology of MASLD20. Serine and glycine are major players in the transfer of one carbon units19. Several studies focusing on circulating metabolites have identified lower glycine as a predictive biomarker for MASH and fibrosis in patients3,4,43. Here, we show that the decrease in circulating glycine occurs early in MASLD, already at the stage of simple hepatic steatosis. Previously, we and others demonstrated the beneficial effect of glycine supplementation in MASLD, lowering steatohepatitis and liver injury8,9,44. Here, we provide an unrecognized metabolic mechanism that 1) explains the cause for the specific decrease in glycine in MASLD, 2) uncovers the implication of limited glycine availability to xenobiotic toxicity, and 3) indicates the therapeutic potential of glycine or targeting impaired glycine metabolism in the liver against xenobiotic toxicity.
Using a combination of untargeted metabolomics and stable-isotope tracing studies with pharmacological and genetic approaches (Figure 1 and 2), we uncover here that reversed activity of SHMT2 in hepatocytes drives the decrease in glycine in hepatic steatosis. Our stable-isotope tracing studies revealed that glycine is a substantial source for serine synthesis in steatotic livers. These studies further indicate that glycine is also consumed through the glycine cleavage system, meaning that two glycine molecules are utilized to produce one serine with one carbon released as CO2. In our studies, circulating serine was significantly elevated and labeled considerably with carbons originating from glycine. Moreover, pharmacological inhibition of serine synthesis using a pan-SHMT inhibitor elevated glycine levels. Loss of the mitochondrial SHMT2 isoform specifically in hepatocytes was sufficient to increase circulating glycine levels. These findings reveal that the metabolism of glycine to serine, mediated by reversed SHMT2 activity and the glycine cleavage system, is elevated in hepatic steatosis and is the underlying cause for the characteristic decrease in circulating glycine in MASLD. Of note, it has been previously suggested that the decrease in circulating glycine in cardiometabolic diseases is secondary to the elevation in branched chain amino acids (BCAAs) which is commonly reported in obesity and type 2 diabetes45. Yet, in our model of hepatic steatosis, we did not detect a consistent increase in circulating BCAAs. These findings indicate that altered glycine metabolism in hepatic steatosis could occur independently of BCAA metabolism.
The findings from our current work as well as previous reports from our group and others demonstrate a decrease in GSH in MASLD8,12. GSH is essential for xenobiotic detoxification in the liver33,34. Epidemiological and animal studies reported the association between MASLD and increased sensitivity to xenobiotics13,16. Specifically, APAP hepatotoxicity is the leading cause of acute liver failure worldwide17,18. Among the three amino acids (glutamate, cysteine, and glycine) required to synthesize GSH, only glycine is decreased in steatotic livers. While glycine decreased by about 30% in mice with hepatic steatosis, our data demonstrate that it becomes a limiting factor for GSH biosynthesis under APAP-induced oxidative stress, leading to enhanced hepatoxicity (Figure 3 and 4). Importantly, we show that exogenous glycine administration (Figure 5) and endogenously increasing glycine availability through hepatocyte-specific ablation of SHMT2 (Figure 6) protected mice with hepatic steatosis from APAP toxicity. Interestingly, glycine can also support de novo GSH production by enabling cysteine synthesis from glycine-derived serine and homocysteine via the transsulfuration pathway19 (Figure S6C). Indeed, mice with hepatic steatosis that were treated with glycine showed increased levels of liver cystathionine and cysteine (Figure S6D–E). Furthermore, the results of this study suggest that monitoring circulating glycine could be considered when administrating analgesics to patients with MASLD, even those at early stages of simple hepatic steatosis.
To summarize, the current study mechanistically links limited glycine availability in MASLD due to reverse SHMT2 activity with impaired GSH synthesis and xenobiotic sensitivity. Glycine administration or inhibition of glycine conversion to serine restores circulating and hepatic glycine levels, increases GSH recovery, and protects from APAP toxicity under hepatic steatosis.
Limitations of Study
The current study has some limitations that may serve as future avenues of research. MASLD is a sex-dimorphic disease with higher prevalence and severity in males compared to females, both in humans and animal models46. While our discoveries offer insight into the metabolic mechanism leading to decreased glycine in MASLD and its implications for APAP toxicity in male mice, further assessment is required to explore the involvement of these metabolic pathways and the therapeutic potential of glycine in female mice. Moreover, future research employing unbiased metabolomics and stable-isotope tracing in individuals with MASLD could prove valuable in establishing the applicability of the present findings to humans. Finally, while the current study focused on metabolic alterations in early MASLD, glycine levels were found to be inversely associated with the severity of the disease (i.e., hepatocellular ballooning, lobular inflammation, and hepatic fibrosis)3. Therefore, further research is warranted to elucidate the metabolic mechanisms underlying the decrease in glycine in more advanced stages of MASLD.
STAR METHODS
RESOURCE AVAILABILITY
Lead contact
Further information and requests for resources and reagents should be directed to and will be fulfilled by the lead contact Eyal Gottlieb (egottlieb@mdanderson.org)
Materials availability
Unique materials generated in this study are available from the corresponding authors with a completed materials transfer agreement.
Data and code availability
The raw metabolomics MS data generated in this study were deposited in the Metabolomics Workbench. The accession number is listed in the key resources table. Source data are provided within this paper (Data S1 and S2). Any additional information required to reanalyze the data reported in this paper is available from the lead contact upon request.
KEY RESOURCES TABLE
| REAGENT or RESOURCE | SOURCE | IDENTIFIER |
|---|---|---|
| Antibodies | ||
| Rabbit monoclonal anti-gamma H2A.X (1:1000) | Abcam | Cat# ab81299 |
| Rabbit polyclonal anti SHMT2 (1:1000) | Abcam | Cat# ab224427 |
| Mouse monoclonal anti-beta Actin (1:5000) | Abcam | Cat# ab6276 |
| Mouse monoclonal anti GAPDH (1:1000) | Santa Cruz | Cat# sc-365062 |
| Donkey anti-Rabbit IgG Secondary Antibody (1:20000) | LI-COR Biosciences | Cat# 926–68073 |
| Donkey anti-Mouse IgG Polyclonal Antibody (1:20000) | LI-COR Biosciences | Cat# 926–32212 |
| Chemicals, peptides, and recombinant proteins | ||
| SHIN1 | MedChemExpress | Cat# HY-112066A |
| 13C2 glycine | Sigma Aldrich | Cat# 283827 |
| Acetaminophen | Sigma-Aldrich | Cat# A7085 |
| Glycine | Sigma-Aldrich | Cat# G7126 |
| D-alanine | Sigma-Aldrich | Cat# A7377 |
| N-acetyl-L-cysteine | Sigma-Aldrich | Cat# A7250 |
| RIPA Lysis buffer | ThermoFisher Scientific | Cat# 50–103-5430 |
| Protease inhibitor Cocktail | Merck | Cat# 539134 |
| Bradford Protein Assay | Bio-Rad | Cat# 5000205 |
| Methanol, LC-MS Grade | Merck | Cat# 106035 |
| Acetonitrile, LC-MS Grade | Merck | Cat# 100029 |
| Paraformaldehyde | ThermoFisher Scientific, | Cat# AAJ61899AK |
| Tissue Freezing Medium | Leica | Cat# 14020108926 |
| Oil red O staining (ORO) | Sigma-Aldrich | Cat# 01391 |
| Hematoxylin and eosin (H&E) | Vector Laboratories | Cat# H-3502 |
| Aqueous mounting media | Leica | Cat# 94–9990402 |
| 13C3 serine | Cambridge Isotope Laboratories | Cat# CLM-1574-H |
| Ammonium carbonate, LC-MS Grade | ThermoFisher Scientific | Cat# 10785511 |
| Ammonium hydroxide, LC-MS Grade | ThermoFisher Scientific | Cat# 15547049 |
| Formic Acid, LC-MS Grade | Merck | Cat# 533002 |
| DMEM: F12 media | Sartorius | Cat# 01–170-1A |
| Fetal bovine serum | ThermoFisher Scientific | Cat# 10270106 |
| Penicillin Streptomycin | Sartorius | Cat# 03–031-5B |
| Dexamethasone | Sigma-Aldrich | Cat# D4902 |
| ITS-G | ThermoFisher Scientific | Cat# 41400045 |
| Glutamine | Sartorius | Cat# 03–020-1A |
| Earle’s Balanced Salt Solution | Sartorius | Cat# 02–0101-1A |
| Vitamin solution | Sartorius | Cat# 01–326-1B |
| Non-essential amino acids | Sartorius | Cat# 01–325-1B |
| Glutathione | Sigma-Aldrich | Cat# G6013 |
| Ammonium metavanadate | Sigma-Aldrich | Cat# 204846 |
| Manganese chloride | Sigma-Aldrich | Cat# 244589 |
| Ascorbic acid | Sigma-Aldrich | Cat# A4403 |
| Palmitic acid | Sigma-Aldrich | Cat# P0500 |
| Oleic acid | Sigma-Aldrich | Cat# O1383 |
| BSA | Sigma-Aldrich | Cat# A3294 |
| BODIPY 493/503 | ThermoFisher Scientific | Cat# D3922 |
| DAPI | Sigma Aldrich | Cat# D9542 |
| Dihydroethidium | Sigma Aldrich | Cat# D7008 |
| Hoechst | ThermoFisher Scientific | Cat# R37165 |
| TRIzol | Sigma Aldrich | Cat# 93289 |
| Nitrocellulose membrane | Bio Rad | Cat# 1704271 |
| Critical commercial assays | ||
| Alanine Transaminase Assay Kit | ThermoFisher Scientific | Cat# 50–489-244 |
| Aspartate Transaminase Assay Kit | ThermoFisher Scientific | Cat# 50–489-248 |
| LDH-Cytotoxicity Assay Kit | Abbot GmBH, | Cat# 2P56–22 |
| Triglyceride Colorimetric Assay Kit | Cayman Chemical | Cat# 10010303 |
| Direct-ZolTM RNA MiniPrep Plus kit | Zymo Research | Cat# 11–331PB |
| cDNA Reverse Transcription Kit | ThermoFisher Scientific | Cat# 4368814 |
| Fast SYBR™ Green Master Mix | ThermoFisher Scientific | Cat# 4385612 |
| Cholesterol kit | Abbot | Cat# 04S9230 |
| Deposited data | ||
| Source Data (Data S1 & S2) | This paper | |
| Experimental models: Cell lines | ||
| AML12 cells | ATCC | Cat# CRL-2254 |
| Experimental models: Organisms/strains | ||
| Mouse: C57BL/6JOlaHsd | Envigo | |
| Mouse: Alb-cre mice (C57BL/6J background) | The Jackson Laboratory | Cat# 003574 |
| Mouse: Shmt2fl/fl | This paper | |
| Oligonucleotides | ||
| Primer sequences for Shmt2 genotyping: Forward 5’-GGGCCAGGAGAGTTTATCAGACAG-3’ Reverse 5’-ACAGGCTGCAGGGGTGAGACG-3’ | This paper | |
| Primer sequences for Shmt2 genotyping: Forward 5’- CCTTACGTACGGTCCGTCTTCCAC-3’ Reverse 5’-CCCCCCGCGTTCCCCTCT-3’ | This paper | |
| Primers for Hmox1: Forward 5’- AGGTACACATCCAAGCCGAGA- 3’ Reverse 5’- CATCACCAGCTTAAAGCCTTCT- 3’ | 47 | |
| Primers for Nqo1: Forward 5’- TCTCTGGCCGATTCAGAGTG- 3’ Reverse 5’- CCAGACGGTTTCCAGACGTT- 3’ | 48 | |
| Primers for Gapdh: Forward 5’- AGACGGCCGCATCTTCTT- 3’ Reverse 5’- TTCACACCGACCTTCACCAT- 3’ | 48 | |
| Software and algorithms | ||
| Compound Discoverer | ThermoFisher Scientific | Version 3.3 https://www.thermofisher.com/order/catalog/product/OPTON-31061 |
| GraphPad Prism | GraphPad Software | Version 8.0 https://www.graphpad.com/features |
| Xcalibur | ThermoFisher Scientific | Version 4.1 https://www.thermofisher.com/order/catalog/product/OPTON-30965 |
| TraceFinder | ThermoFisher Scientific | Version 4.1 https://www.thermofisher.com/order/catalog/product/OPTON-31001 |
| MetaboAnalyst | 49 | Version 5.0 https://www.metaboanalyst.ca/ |
| AutoPlotter | 50 | Version 2.6 https://mpietzke.shinyapps.io/AutoPlotter/ |
| Other | ||
| Standard chow diet (CD) | Altromin | Cat# 1320 |
| Low fat diet (LFD) | Envigo | Cat# TD.08485 |
| Western diet (WD) | Envigo | Cat# TD.88137 |
| Liquid diet | Bio-Serv | Cat# F1258SP |
| High fat diet | Altromin | Cat# C1084 |
| Disposable animal feeding needles | ThermoFisher Scientific | Cat# 01–208-88 |
| Superfrost Plus slides | ThermoFisher Scientific | Cat#22–037-246 |
| Precellys 24 tissue homogenizer | Bertin Corp | Cat# P002391-P24T0-A.0 |
| Heparin lithium tubes | BD | Cat# 366664 |
| CK14 homogenizing tubes with 1.4 mm ceramic beads | Bertin Corp | Cat# P000926-LYSK0-A |
| HPLC glass vials and caps | Agilent | Cat# 8010–0542 |
| Q-Exactive Orbitrap | ThermoFisher Scientific | |
| Orbitrap Exploris 240 Mass Spectrometer | ThermoFisher Scientific | |
| Vanquish Flex ultra-high-performance liquid chromatography (UPLC) system | ThermoFisher Scientific | |
| Ultimate 3000 high-performance liquid chromatography (HPLC) system | ThermoFisher Scientific | |
| ZIC pHILIC column | Merck | Cat# 150460 |
| ZIC-pHILIC guard column | Merck | Cat# 150438 |
| ACQUITY UPLC BEH C18 column | Waters | Cat# 186002352 |
EXPERIMENTAL MODEL AND STUDY PARTICIPANT DETAILS
Animal studies
All animal procedures were performed in accordance with guidelines established by the NIH on the care and use of animals in research, as confirmed by the Institutional Animal Care and Use Committees of the Technion – Israel Institute of Technology and Louisiana State University Health Sciences Center-Shreveport. C57BL/6JOlaHsd male mice were purchased from Envigo. Shmt2 conditional knockout mice (floxed Shmt2) were generated on the C57BL/6J background using the CRISPR-Cas9 gene editing system. LoxP sites flanking exons 3 and 4 of Shmt2 were inserted using the following guide RNAs: 5’-AAGCTCTTTTGAATCTGACA-3’ and 5’-CCATCTTCACCGGACCTGAC-3’ (Fig S3E). Successful generation of homozygous floxed Shmt2 (Shmt2fl/fl) mice was confirmed by PCR validating LoxP insertion in intron 2 using the following primers: 5’-GGGCCAGGAGAGTTTATCAGACAG-3’(forward) and 5’-ACAGGCTGCAGGGGTGAGACG-3’ (reverse) (Figure S3F), and intron 4 using the following primers: 5’-CCTTACGTACGGTCCGTCTTCCAC-3’ (forward) and 5’-CCCCCCGCGTTCCCCTCT-3’ (reverse) (Figure S3F). Shmt2fl/fl mice were crossed with Alb-cre mice on the C57BL/6J background (The Jackson Laboratory, 003574) (Figure 2L). Successful deletion of SHMT2 in the hepatocytes was confirmed using Western blot (Figure 2L).
All mice were housed on a 12-hour light/dark cycle with ad libitum access to food and water except for fasting periods. At 8 weeks of age, mice (n=3 per cage) were placed either on standard chow diet (CD, Altromin,1320) or Western diet (WD, Envigo, TD.88137) for 10 weeks (Table S3). In alternative dietary models, mice were fed a low-fat diet (LD, Envigo, TD.08485) or high-fat, high-fructose diet (HFHFD) composed of food pellets (Altromin, C1084) and 9% fructose enriched liquid diet (Bio-Serv, F1258SP) as the only source of water. For glycine tracing experiments, CD and WD fed mice were injected intraperitoneally (IP) thrice with 100 mg/kg 13C2 glycine (Sigma Aldrich, 283827) in saline (0.9% w/v of NaCl in water) at 20-minute intervals and sacrificed 10 minutes following the third injection. For SHMT inhibitor (SHIN1) experiments, WD fed mice were injected IP with 100 mg/kg SHIN126,51 (MedChemExpress, HY-112066A) in DMSO, or vehicle only 20 minutes prior the administration of three doses of 13C2 glycine. For APAP experiments, food was removed from the cages 16 hours before administration. On the day of the experiment, 15 mg/mL APAP (Sigma-Aldrich, A7085) was dissolved in saline and kept at 37°C until administered IP at 300 mg/kg dose. Saline was used as control. Mice were allowed access to food 2 hours following APAP administration. For glycine treatment, 1 g/kg of glycine (Sigma-Aldrich, G7126) or 13C2 glycine was administered by oral gavage with disposable animal feeding needles (ThermoFisher Scientific, 01–208-88) 15 minutes and 3 hours following APAP injection. Mice were sacrificed at the indicated time points. Similar to glycine treatment, mice were orally administered with either 1.18 g/kg D-alanine (Sigma Aldrich, A7377) or 300 mg/kg N-acetyl cysteine52,53 (Sigma Aldrich, A7250) 15 minutes and 3 hours following APAP injection.
Cell culture studies
AML12 cells were obtained from ATCC (CRL-2254) and cultured according to the recommendations in DMEM:F12 media (Sartorius, 01–170-1A) supplemented with 10% fetal bovine serum (FBS) (ThermoFisher Scientific, 10270106), 100 U/mL penicillin, 100 μg/mL streptomycin (Biological Industries, 03–031-5B), 40 ng/mL dexamethasone (Sigma-Aldrich, D4902), ITS-G (1:100, ThermoFisher Scientific, , 41400045) and 2 mM Glutamine (Sartorius, 03020–1A).
METHOD DETAILS
Sample collection
At endpoint of mouse experiments, plasma was collected in heparin lithium tubes (BD, 450535) and then centrifuged at 2,000 g for 15 minutes at 4°C. For tissue collection, mice were sacrificed by isoflurane inhalation. Liver and kidney tissues were immediately collected, rinsed with cold PBS, and dissected as described below. Tissues were then snap-frozen in liquid nitrogen and kept in −80°C or transferred to 4% paraformaldehyde (PFA). For consistency, the left lobe was consistently used for metabolomics, the posterior right and middle lobes were used for histological analysis, and the remaining portions of the right lobe were used for Western blot and qPCR analyses.
Plasma transaminases
Liver transaminases were measured using commercially available kits: ALT (ThermoFisher Scientific, 50–489-244), AST (ThermoFisher Scientific, 50–489-248) and LDH kit (Abbot GmBH, 2P56–22) according to the manufacturer’s instructions. In hemolytic blood samples, the LDH and AST levels were excluded from the analysis to avoid false positive results.
Liver histology
Livers were dissected and the middle and right lobe were fixed in 4% PFA (ThermoFisher Scientific, AAJ61899AK) for 48 hours, paraffin-embedded and sectioned at 5 μm thickness (Leica RM2255) and adhered to Superfrost Plus slides (ThermoFisher Scientific, 22–037-246). Slides were stained with hematoxylin and eosin (H&E, Vector Laboratories, H-3502) and mounted in aqueous mounting media (Leica, 94–9990402) for histological analysis. For Oil Red O (ORO) staining, PFA-fixed liver samples were cryoprotected in 20% sucrose at 4 °C overnight. Snap-frozen with liquid nitrogen in Tissue Freezing Medium (Leica, 14020108926) and stored at −80 °C for cryosectioning at 10 μm thickness. ORO (Sigma-Aldrich, 01391) was performed as described8.
Histological scoring
H&E-stained, paraffin-embedded sections from the left and right liver lobes were used for each mouse. APAP-induced liver injury and hemorrhage were graded from 1–3 as previously described54 by a researcher blinded to the experimental groups. Mean score of both lobes was calculated for each mouse.
Liver triglyceride and cholesterol measurements
Triglyceride and cholesterol measurements in the liver were performed using a Triglyceride Colorimetric Assay Kit (Cayman Chemical 10010303) and Cholesterol kit (Abbot 04S9230) as per manufacturer instructions.
Mouse sample preparation for metabolomics
For liver samples, approximately 40 mg of frozen liver tissue were added to CK14 homogenizing tubes containing 1.4 mm ceramic beads (Bertin Corp, P000926-LYSK0-A) which were prefilled with 1,000 μL of cold (−20°C) metabolite extraction solvent consisting of methanol (Merck, 106035), acetonitrile (Merck, 100029) and water at a ratio of 5:3:2. Samples were homogenized at 4°C using a Precellys 24 tissue homogenizer (Bertin Corp, P002391-P24T0-A.0). Homogenization conditions were set to three cycles, 20 seconds each, 7,200 rpm with a 60 second gap between each of the cycles to preserve low temperature. Homogenates were centrifuged at 18,000 g for 15 minutes at 4°C. The supernatant was then collected in microcentrifuge tubes and centrifuged again under the same conditions. The cleared supernatants were transferred to glass HPLC vials (Agilent, 8010–0542) and kept at −80°C until LC-MS analysis. For sphinganine extraction, frozen liver tissues were homogenized with methanol (Mercury, 1060352500) and processed as described above. For plasma analysis, samples were diluted 1:10 in cold extraction solvent of methanol and acetonitrile at a ratio of 75:25, vortexed for 10 minutes and immediately centrifuged at 18,000 g for 10 minutes at 4°C. The supernatant was collected in glass HPLC vials for LC-MS analysis.
Calibration curve for glycine and serine quantification
For glycine and serine quantification in the liver, 13C2 glycine (Sigma Aldrich, 283827) and 13C3 serine (Cambridge Isotope Laboratories, Inc, CLM-1574-H) were spiked into liver tissue homogenates at a concentration range of 0.58–1,200 μM. Calibration curves were prepared in homogenates from both healthy and fatty liver to overcome possible liver matrix effects. For glycine and serine quantification in the plasma, labeled standards were spiked into plasma matrix from CD fed mice at 0.38–1,300 μM concentration range. Importantly, the samples used for calibration curves were prepared and processed similarly to the samples to be quantified.
In vitro metabolomics
For in vitro metabolomic experiments, AML12 cells were seeded in 6-well plates (ThermoFisher, 140675) at a density of 2×10⁵ cells per well and left overnight to adhere. On the following day, growth medium was replaced with metabolic medium prepared as follows: Earle’s Balanced Salt Solution (EBSS, Sartorius, 02–0101-1A), 1% FBS, 100 U/mL penicillin, 100 μg/mL streptomycin, non-essential amino acids (Sartorius, 01–325-1B), vitamin solution (1:50, Sartorius, 01–326-1B), 0.25 mM L-serine (Sigma-Aldrich S4500), 0.25 mM glycine (Sigma-Aldrich G7126), 1 mM glutamine (Sartorius, 03–020-1A), 1 mM sodium pyruvate (Sartorius, 03–042-1B), ITS-G (1:100, ThermoFisher Scientific, 41400045), 40 ng/mL dexamethasone, 1 μg/mL glutathione (Sigma-Aldrich, G6013), 0.3 ng/mL ammonium metavanadate (Sigma-Aldrich, 204846), 0.25 nM manganese chloride (Sigma-Aldrich, 244589), and 2.5 mg/L ascorbic acid (Sigma-Aldrich, A4403). The following day, the medium was replaced with fresh metabolic medium supplemented with 200 μM palmitate conjugated to bovine serum albumin (BSA) or BSA only (control) for 24 hours. Conjugation of palmitate to BSA was performed as previously described55. Metabolites were extracted from the cells using methanol:acetonitrile:water at a ratio of 5:3:2 and LC-MS analysis was performed as described below. For data normalization, raw data files were processed with Compound Discoverer 3.3 to obtain total peak areas for each sample. Each metabolite’s peak area value was normalized to total measurable ions in the sample.
LC-MS analysis
For polar metabolites detection, LC-MS metabolomics was performed as previously described56. ThermoFisher Scientific Ultimate 3000 high-performance liquid chromatography (HPLC) system coupled to Q-Exactive Orbitrap Mass Spectrometer (ThermoFisher Scientific) was used with a resolution of 35,000 at 200 mass/charge ratio (m/z), electrospray ionization, and polarity switching mode to enable both positive and negative ions across a mass range of 67 to 1,000 m/z. HPLC setup consisted of ZIC pHILIC column (SeQuant; 150 mm × 2.1 mm, 5μm) (Merck, 150460). Five μL of biological extracts were injected and the compounds were separated with mobile phase gradient of 15 minutes, starting at 20% aqueous (20 mM ammonium carbonate, ThermoFisher Scientific, 10785511) adjusted to pH=9.2, with 0.1% of 25% ammonium hydroxide (ThermoFisher Scientific, 15547049) and 80% organic (acetonitrile) and terminated with 20% acetonitrile. Flow rate and column temperature were maintained at 0.2 mL/minute and 45°C, respectively, for a total run time of 27 minutes. All metabolites were detected using a mass accuracy below 5 ppm. Xcalibur (ThermoFisher Scientific) was used for data acquisition.
For GSH-HNE detection the mass spectrometer was operated in a positive polarity mode by t-SIM (targeted-selected ion monitoring). The ion monitored was m/z 464 which corresponds to M+H adduct. For cysteine detection, the mass spectrometer was operated in a positive polarity mode by t-SIM to increase sensitivity for isotopologues detection. The ions monitored were m/z 122.02709 for M+0, m/z 123.03038 for M+1, m/z 124.03374 for M+2 and m/z 125.03709 for M+3. HPLC setup consisted of ZIC-pHILIC column (SeQuant; 150 mm × 2.1 mm, 5 μm; Merck). Mobile phase A: 0.1% v/v formic acid (Merck, 533002) in water. Mobile B: acetonitrile. The flow rate was kept at 200 μL/minute and the gradients were as follows: 0 minute 50% of B, 8 minute 20% of B, 12 minute 20% of B, 14 minute 50% of B, 18–21 minute 50% of B. For sphinganine detection, LC-MS analysis was conducted using Thermo Vanquish Flex ultra-high-performance liquid chromatography (UPLC) system coupled to Orbitrap Exploris 240 Mass Spectrometer (Thermo Fisher Scientific) with a resolution of 120,000 at 200 mass/charge ratio (m/z) equipped with a HESI source and operated in positive ion mode. Analytes were separated on an ACQUITY UPLC BEH C18 column (100 × 2.1 mm; 1.7 μm) (Waters, 186002352). The mobile phases consisted of A (H2O:acetonitrile 8:2, 0.1% formic acid) and B (IPA:acetonitrile 8:2, 0.1% formic acid). For each run, 5 μL of sample were injected onto the analytical column using the following gradient: 0–1 minute, 30% B; 1–2.5 minute, 30–70% B; 2.5–4 minute, 70–80% B, 80% B 4–5 minute; 5–6.5 minute, 80–90% B; 6.5–7.5 minute, 90–100% B; and 7.5–8.9 minute, 100–30% B. The flow rate was 0.4 mL/minute, and the column was operated at 55°C.
Targeted metabolic data analysis
TraceFinder 4.1 (ThermoFisher Scientific) was used for analysis. Peak areas of metabolites were determined using the exact mass of singly charged ions. The retention time of metabolites was predetermined on the pHILIC column by analyzing an in-house mass spectrometry metabolite library consisting of commercially available standards. Raw data files were processed with Compound Discoverer 3.3 to obtain total signals area for each sample to be used as normalization factor. Each metabolite’s peak area value was normalized to total measurable ions in the sample. Correction for natural abundance in isotope tracing experiments was done using Metabolite AutoPlotter 2.650.
Untargeted metabolomics
Untargeted metabolomics analysis was carried out using Compound Discoverer software 3.3 (ThermoFisher Scientific). Retention times were aligned across all data files using ChromeAlign node and a pool sample as a reference file (the pool sample was prepared by combining aliquots from all biological samples and was injected repeatedly, every 10 samples, for quality control and batch effect normalization). Unknown compound detection (minimum peak intensity of 1×10⁵ area under the curve, AUC) and grouping of compounds were performed across all samples with the following main settings (all other parameters were kept as default values): mass tolerance of 5 ppm, retention time tolerance of 0.2 minute compound detection: M+H and M-H ions only, peak rating filter was set to 4. Missing values were filled using the software’s ‘Fill Gap’ feature (mass tolerance of 5 ppm and signal/noise tolerance of 1.5). A total of 1,081 and 1,200 features were detected in the plasma and liver extracts, respectively. ‘Search Mass Lists’ node was added for identification using in-house metabolites library that contains retention times. Metabolites annotation was done as follows, with decreasing confidence levels: 1) by matching the mass and retention time of observed signal to an in-house library generated using commercial standards (mass tolerance of 5 ppm and retention time tolerance of 0.5 minutes); 2) by matching fragmentation spectra to mzCloud (www.mzcloud.org) with precursor and fragment mass tolerance of 10 ppm and match factor threshold of 80, and 3) compounds with no fragmentation spectra data were annotated using Human Metabolome Database (https://hmdb.ca/), BioCyc (https://biocyc.org/), and Kyoto Encyclopedia of Genes and Genomes (KEGG https://www.genome.jp/kegg/) applying filtering of the softwares’ mzlogic score higher than 50 and with less than three possible candidates. After completing the above filtering and annotation processes, 260 and 324 metabolites were annotated in the plasma and liver respectively.
Immunoblotting
Protein extraction from liver samples was performed by re-suspending frozen tissues (approximately 30 mg) in 0.5 mL of RIPA lysis buffer (Fisher Scientific, 50–103-5430) containing protease inhibitor cocktail (1:100) (Merck, 539134), and lysed at 4°C using a Precellys 24 tissue homogenizer. Following lysis, samples were incubated on ice for 10 minutes, then spun down at 15,000 g for 10 minutes in 4°C. Supernatant was collected, protein concentration was quantified using Bradford assay (Bio-Rad, 500020) and stored in −80°C until immunoblotting. Equal amounts of extracted proteins (40 μg) were loaded and run by electrophoresis on a 12% SDS–polyacrylamide gel and were transferred to a nitrocellulose membrane (Bio Rad, 1704271). The membranes were incubated in blocking buffer, TBS-T (Tris-buffered saline, 0.1% Tween 20) containing 5% (w/v) BSA for 1 hours in room temperature, and probed with the appropriate primary antibodies overnight at 4 °C. Subsequently, the membranes were washed three times with TBS–T, and then incubated with the appropriate secondary antibodies for 1 h at room temperature. Antibodies used in this study are summarized in Key Resources Table. Images of immunoblots were acquired using Li-Cor Odyssey XF Imager. Densitometry was performed using Image Studio Lite v5.2 software and normalized to β-actin or GAPDH. All uncropped Western blots can be found in Data S2.
Reverse transcription and qPCR
Liver tissues were lysed in TRIzol (Sigma Aldrich, 93289) and RNA was extracted using Direct-Zol™ RNA MiniPrep Plus kit (Zymo Research, 11–331PB). From each sample, 5 μg of total RNA were used to synthesize cDNA using a cDNA Reverse Transcription Kit (ThermoFisher Scientific, 4368814). Specific transcript levels were assessed by a Bio-Rad CFX connect real-time PCR system using the Fast SYBR™ Green Master Mix (ThermoFisher Scientific, 4385612) and the ΔΔCt threshold cycle method of normalization. Gene expression levels were normalized to Gapdh. Primer pairs used for qPCR are listed in the Key Resources Table.
Lipid droplet staining in AML12 cells
AML12 cells were plated on 8 well chamber slides (ThermoFisher Scientific, 154526PK) at a density of 1.5×10⁴ cells per well. Following 24 hours of incubation with palmitate or oleate conjugated to BSA or BSA only (control), the cells were fixed with 4% PFA for 10 minutes and kept at 4°C until analysis. Cellular lipids were stained using 5 μM BODIPY 493/503 (ThermoFisher Scientific, D3922) according to manufacturer’s instructions and nuclei were stained with DAPI 5 μg/mL (Sigma Aldrich, D9542). Cells were analyzed and imaged on a Keyence BZ-X810 and maintained at 38°C and 5% CO2. At least three images were taken per well. Images were processed with ImageJ software (NIH).
Superoxide staining in AML12 cells
AML12 cells were plated on 24 well glass bottom plate (Cellvis, P24–1.5H–N) at a density of 1.5×10⁴ cells per well. The following day, growth medium was replaced with the metabolic medium described above supplemented with 200 μM palmitate or oleate conjugated to BSA (PA-BSA, OA-BSA), or BSA only (control) followed by incubation for 24 hours. In APAP experiments, cells were incubated with BSA, 200 μM palmitate conjugated to BSA, 30 mM APAP or palmitate with APAP for 12 hours. For experiments with glycine or GSH treatment, cells were incubated in metabolic medium without glycine with indicated treatments for 12 hrs. For superoxide staining, cells were washed thrice with warm 37°C HBSS media (ThermoFisher Scientific, 14025050) and incubated with 5 μM Dihydroethidium (DHE, Sigma Aldrich, D7008) and Hoechst (ThermoFisher Scientific, R37165) for 30 minutes at 37 °C in the dark. Cells were then washed again with warm HBSS media and were maintained in HBSS with Hoechst during image acquisition. Cells were analyzed and imaged on a Keyence BZ-X810 and maintained at 38°C and 5% CO2. At least three images were taken per well. Images were processed with ImageJ software (NIH).
Quantification of time spent in motion in APAP treated mice
Cages of APAP treated mice were recorded for approximately one minute 24 hours following APAP injection and videos were analyzed manually, as previously described57. Briefly, for each mouse, time spent in motion (locomotion or stretching) and time spent still (pausing or freezing) were measured and recorded. The percentage of active locomotion time out of total recorded time was calculated for each mouse. Analysis was performed by a researcher blinded to the experimental groups.
Quantification and statistical analysis
Statistical analyses were performed using GraphPad Prism version 8.0.1. Data are presented as mean ± SEM. The specific test is described in the figure legend of each figure. A value of P<0.05 was considered statistically significant. Principal component analysis (PCA) plots of the annotated metabolomics data were generated using MetaboAnalyst software 5.0 (https://www.metaboanalyst.ca/). PCA plots were generated using log-transformed intensities and auto-scaling for normalization. Metabolite enrichment analysis was performed exclusively on annotated metabolites (HMDB ID) with statistically significant change (P<0.05) using the Small Molecule Pathway Database (SMPDB) library and enrichment pathway tool in MetaboAnalyst software 5.0. All source data can be found in Data S1 and S2 (unprocessed data underlying the display items in the manuscript, related to Figures 1–6 and S1–S6, in which all the relevant figures are listed).
Supplementary Material
Data S1-Source Data: Source data used for generating graphs in the manuscript, related to Figures 1–6 and S1–S6.
Video S1: Locomotion of CD and WD fed mice 24 hours following APAP administration, related to Figures 4–5, Figure S5.
Table S1: Altered metabolites in livers from mice with hepatic steatosis compared to controls, related to Figure 1.
Table S2: Altered metabolites in plasma from mice with hepatic steatosis compared to controls, related to Figure 1.
Video S2: Locomotion of WD fed Shmt2fl/fl and Shmt2HKO 24 hours following APAP administration, related to Figure 6.
Highlights.
Altered one-carbon metabolism occurs in the early reversible stage of MASLD
Limited glycine in hepatic steatosis drives redox stress and acetaminophen toxicity
Serine synthesis via hepatocyte SHMT2 causes glycine depletion in hepatic steatosis
Elevating glycine levels by diet or genetic means alleviates acetaminophen toxicity
Acknowledgments
This study was supported by grants from the Israel Science Foundation (ISF) (#824/19 to E.G.), the Michigan-Israel Partnership for Research and Education (E.G., I.M., O.R., Y.E.C.), the Laura and Isaac Perlmutter Foundation (E.G.), and the Israel Council for Higher Education (VATAT to A.G.) and the National Institute of Health (HL150233, DK134011, and DK136685 to O.R.). We thank the Biomedical Core Facility (BCF) and the preclinical facility at the Ruth and Bruce Rappaport Faculty of Medicine and the Technion – Israel Institute of Technology for their services. We wish to thank Prof. Herman Wolosker (Technion) for providing SHIN1, and Prof. Yehuda Chowers (Technion) for discussing the results and offering research directions.
Footnotes
Publisher's Disclaimer: This is a PDF file of an unedited manuscript that has been accepted for publication. As a service to our customers we are providing this early version of the manuscript. The manuscript will undergo copyediting, typesetting, and review of the resulting proof before it is published in its final form. Please note that during the production process errors may be discovered which could affect the content, and all legal disclaimers that apply to the journal pertain.
Declaration of Interests
Eyal Gottlieb is a Founder and Shareholder at MetaboMed Ltd, Israel. Y. Eugene Chen is the founder and Oren Rom is a scientific advisor at Diapin Therapeutics LLC. They are the inventors of PCT/US2019/046052 (Tri-peptides and treatment of metabolic, cardiovascular, and inflammatory disorders).
References
- 1.Younossi Z, Anstee QM, Marietti M, Hardy T, Henry L, Eslam M, George J, and Bugianesi E (2018). Global burden of NAFLD and NASH: trends, predictions, risk factors and prevention. Nature reviews. Gastroenterology & hepatology 15, 11–20. 10.1038/nrgastro.2017.109. [DOI] [PubMed] [Google Scholar]
- 2.Friedman SL, Neuschwander-Tetri BA, Rinella M, and Sanyal AJ (2018). Mechanisms of NAFLD development and therapeutic strategies. Nature medicine 24, 908–922. 10.1038/s41591-018-0104-9. [DOI] [PMC free article] [PubMed] [Google Scholar]
- 3.Gaggini M, Carli F, Rosso C, Buzzigoli E, Marietti M, Della Latta V, Ciociaro D, Abate ML, Gambino R, Cassader M, et al. (2018). Altered amino acid concentrations in NAFLD: Impact of obesity and insulin resistance. Hepatology 67, 145–158. 10.1002/hep.29465. [DOI] [PubMed] [Google Scholar]
- 4.Hasegawa T, Iino C, Endo T, Mikami K, Kimura M, Sawada N, Nakaji S, and Fukuda S (2020). Changed Amino Acids in NAFLD and Liver Fibrosis: A Large Cross-Sectional Study without Influence of Insulin Resistance. Nutrients 12. 10.3390/nu12051450. [DOI] [PMC free article] [PubMed] [Google Scholar]
- 5.Wittemans LBL, Lotta LA, Oliver-Williams C, Stewart ID, Surendran P, Karthikeyan S, Day FR, Koulman A, Imamura F, Zeng L, et al. (2019). Assessing the causal association of glycine with risk of cardio-metabolic diseases. Nature communications 10, 1060. 10.1038/s41467-019-08936-1. [DOI] [PMC free article] [PubMed] [Google Scholar]
- 6.Rom O, Liu Y, Finney AC, Ghrayeb A, Zhao Y, Shukha Y, Wang L, Rajanayake KK, Das S, Rashdan NA, et al. (2022). Induction of glutathione biosynthesis by glycine-based treatment mitigates atherosclerosis. Redox biology 52, 102313. 10.1016/j.redox.2022.102313. [DOI] [PMC free article] [PubMed] [Google Scholar]
- 7.Li X, Sun L, Zhang W, Li H, Wang S, Mu H, Zhou Q, Zhang Y, Tang Y, Wang Y, et al. (2018). Association of serum glycine levels with metabolic syndrome in an elderly Chinese population. Nutrition & metabolism 15, 89. 10.1186/s12986-018-0325-4. [DOI] [PMC free article] [PubMed] [Google Scholar]
- 8.Rom O, Liu Y, Liu Z, Zhao Y, Wu J, Ghrayeb A, Villacorta L, Fan Y, Chang L, Wang L, et al. (2020). Glycine-based treatment ameliorates NAFLD by modulating fatty acid oxidation, glutathione synthesis, and the gut microbiome. Science translational medicine 12. 10.1126/scitranslmed.aaz2841. [DOI] [PMC free article] [PubMed] [Google Scholar]
- 9.Takashima S, Ikejima K, Arai K, Yokokawa J, Kon K, Yamashina S, and Watanabe S (2016). Glycine prevents metabolic steatohepatitis in diabetic KK-Ay mice through modulation of hepatic innate immunity. American journal of physiology. Gastrointestinal and liver physiology 311, G1105–G1113. 10.1152/ajpgi.00465.2015. [DOI] [PubMed] [Google Scholar]
- 10.Cruz M, Maldonado-Bernal C, Mondragon-Gonzalez R, Sanchez-Barrera R, Wacher NH, Carvajal-Sandoval G, and Kumate J (2008). Glycine treatment decreases proinflammatory cytokines and increases interferon-gamma in patients with type 2 diabetes. Journal of endocrinological investigation 31, 694–699. 10.1007/BF03346417. [DOI] [PubMed] [Google Scholar]
- 11.Qu P, Rom O, Li K, Jia L, Gao X, Liu Z, Ding S, Zhao M, Wang H, Chen S, et al. (2023). DT-109 ameliorates nonalcoholic steatohepatitis in nonhuman primates. Cell metabolism 35, 742–757 e710. 10.1016/j.cmet.2023.03.013. [DOI] [PubMed] [Google Scholar]
- 12.Mardinoglu A, Bjornson E, Zhang C, Klevstig M, Soderlund S, Stahlman M, Adiels M, Hakkarainen A, Lundbom N, Kilicarslan M, et al. (2017). Personal model-assisted identification of NAD(+) and glutathione metabolism as intervention target in NAFLD. Molecular systems biology 13, 916. 10.15252/msb.20167422. [DOI] [PMC free article] [PubMed] [Google Scholar]
- 13.Massart J, Begriche K, Moreau C, and Fromenty B (2017). Role of nonalcoholic fatty liver disease as risk factor for drug-induced hepatotoxicity. Journal of clinical and translational research 3, 212–232. 10.18053/jctres.03.2017S1.006. [DOI] [PMC free article] [PubMed] [Google Scholar]
- 14.Naik A, Belic A, Zanger UM, and Rozman D (2013). Molecular Interactions between NAFLD and Xenobiotic Metabolism. Frontiers in genetics 4, 2. 10.3389/fgene.2013.00002. [DOI] [PMC free article] [PubMed] [Google Scholar]
- 15.Albadry M, Hopfl S, Ehteshamzad N, Konig M, Bottcher M, Neumann J, Lupp A, Dirsch O, Radde N, Christ B, et al. (2022). Periportal steatosis in mice affects distinct parameters of pericentral drug metabolism. Scientific reports 12, 21825. 10.1038/s41598-022-26483-6. [DOI] [PMC free article] [PubMed] [Google Scholar]
- 16.Merrell MD, and Cherrington NJ (2011). Drug metabolism alterations in nonalcoholic fatty liver disease. Drug metabolism reviews 43, 317–334. 10.3109/03602532.2011.577781. [DOI] [PMC free article] [PubMed] [Google Scholar]
- 17.Garcia-Roman R, and Frances R (2020). Acetaminophen-Induced Liver Damage in Hepatic Steatosis. Clinical pharmacology and therapeutics 107, 1068–1081. 10.1002/cpt.1701. [DOI] [PubMed] [Google Scholar]
- 18.Larson AM, Polson J, Fontana RJ, Davern TJ, Lalani E, Hynan LS, Reisch JS, Schiodt FV, Ostapowicz G, Shakil AO, et al. (2005). Acetaminophen-induced acute liver failure: results of a United States multicenter, prospective study. Hepatology 42, 1364–1372. 10.1002/hep.20948. [DOI] [PubMed] [Google Scholar]
- 19.Ducker GS, and Rabinowitz JD (2017). One-Carbon Metabolism in Health and Disease. Cell metabolism 25, 27–42. 10.1016/j.cmet.2016.08.009. [DOI] [PMC free article] [PubMed] [Google Scholar]
- 20.da Silva RP, Eudy BJ, and Deminice R (2020). One-Carbon Metabolism in Fatty Liver Disease and Fibrosis: One-Carbon to Rule Them All. The Journal of nutrition 150, 994–1003. 10.1093/jn/nxaa032. [DOI] [PubMed] [Google Scholar]
- 21.Alonso C, Fernandez-Ramos D, Varela-Rey M, Martinez-Arranz I, Navasa N, Van Liempd SM, Lavin Trueba JL, Mayo R, Ilisso CP, de Juan VG, et al. (2017). Metabolomic Identification of Subtypes of Nonalcoholic Steatohepatitis. Gastroenterology 152, 1449–1461 e1447. 10.1053/j.gastro.2017.01.015. [DOI] [PMC free article] [PubMed] [Google Scholar]
- 22.Walker AK (2017). 1-Carbon Cycle Metabolites Methylate Their Way to Fatty Liver. Trends in endocrinology and metabolism: TEM 28, 63–72. 10.1016/j.tem.2016.10.004. [DOI] [PMC free article] [PubMed] [Google Scholar]
- 23.Rome FI, and Hughey CC (2022). Disrupted liver oxidative metabolism in glycine N-methyltransferase-deficient mice is mitigated by dietary methionine restriction. Molecular metabolism 58, 101452. 10.1016/j.molmet.2022.101452. [DOI] [PMC free article] [PubMed] [Google Scholar]
- 24.Yamakado M, Tanaka T, Nagao K, Imaizumi A, Komatsu M, Daimon T, Miyano H, Tani M, Toda A, Yamamoto H, et al. (2017). Plasma amino acid profile associated with fatty liver disease and co-occurrence of metabolic risk factors. Scientific reports 7, 14485. 10.1038/s41598-017-14974-w. [DOI] [PMC free article] [PubMed] [Google Scholar]
- 25.Ducker GS, Ghergurovich JM, Mainolfi N, Suri V, Jeong SK, Hsin-Jung Li S, Friedman A, Manfredi MG, Gitai Z, Kim H, and Rabinowitz JD (2017). Human SHMT inhibitors reveal defective glycine import as a targetable metabolic vulnerability of diffuse large B-cell lymphoma. Proceedings of the National Academy of Sciences of the United States of America 114, 11404–11409. 10.1073/pnas.1706617114. [DOI] [PMC free article] [PubMed] [Google Scholar]
- 26.He L, Endress J, Cho S, Li Z, Zheng Y, Asara JM, and Blenis J (2022). Suppression of nuclear GSK3 signaling promotes serine/one-carbon metabolism and confers metabolic vulnerability in lung cancer cells. Science advances 8, eabm8786. 10.1126/sciadv.abm8786. [DOI] [PMC free article] [PubMed] [Google Scholar]
- 27.Holecek M (2022). Serine Metabolism in Health and Disease and as a Conditionally Essential Amino Acid. Nutrients 14. 10.3390/nu14091987. [DOI] [PMC free article] [PubMed] [Google Scholar]
- 28.Ooi GJ, Meikle PJ, Huynh K, Earnest A, Roberts SK, Kemp W, Parker BL, Brown W, Burton P, and Watt MJ (2021). Hepatic lipidomic remodeling in severe obesity manifests with steatosis and does not evolve with non-alcoholic steatohepatitis. Journal of hepatology 75, 524–535. 10.1016/j.jhep.2021.04.013. [DOI] [PubMed] [Google Scholar]
- 29.Sekhar RV, McKay SV, Patel SG, Guthikonda AP, Reddy VT, Balasubramanyam A, and Jahoor F (2011). Glutathione synthesis is diminished in patients with uncontrolled diabetes and restored by dietary supplementation with cysteine and glycine. Diabetes care 34, 162–167. 10.2337/dc10-1006. [DOI] [PMC free article] [PubMed] [Google Scholar]
- 30.Rada P, Gonzalez-Rodriguez A, Garcia-Monzon C, and Valverde AM (2020). Understanding lipotoxicity in NAFLD pathogenesis: is CD36 a key driver? Cell death & disease 11, 802. 10.1038/s41419-020-03003-w. [DOI] [PMC free article] [PubMed] [Google Scholar]
- 31.Chen X, Li L, Liu X, Luo R, Liao G, Li L, Liu J, Cheng J, Lu Y, and Chen Y (2018). Oleic acid protects saturated fatty acid mediated lipotoxicity in hepatocytes and rat of non-alcoholic steatohepatitis. Life sciences 203, 291–304. 10.1016/j.lfs.2018.04.022. [DOI] [PubMed] [Google Scholar]
- 32.Zeng X, Zhu M, Liu X, Chen X, Yuan Y, Li L, Liu J, Lu Y, Cheng J, and Chen Y (2020). Oleic acid ameliorates palmitic acid induced hepatocellular lipotoxicity by inhibition of ER stress and pyroptosis. Nutrition & metabolism 17, 11. 10.1186/s12986-020-0434-8. [DOI] [PMC free article] [PubMed] [Google Scholar]
- 33.Wu G, Fang YZ, Yang S, Lupton JR, and Turner ND (2004). Glutathione metabolism and its implications for health. The Journal of nutrition 134, 489–492. 10.1093/jn/134.3.489. [DOI] [PubMed] [Google Scholar]
- 34.Lushchak VI (2012). Glutathione homeostasis and functions: potential targets for medical interventions. Journal of amino acids 2012, 736837. 10.1155/2012/736837. [DOI] [PMC free article] [PubMed] [Google Scholar]
- 35.Michaut A, Moreau C, Robin MA, and Fromenty B (2014). Acetaminophen-induced liver injury in obesity and nonalcoholic fatty liver disease. Liver international : official journal of the International Association for the Study of the Liver 34, e171–179. 10.1111/liv.12514. [DOI] [PubMed] [Google Scholar]
- 36.Ito Y, Abril ER, Bethea NW, McCuskey MK, and McCuskey RS (2006). Dietary steatotic liver attenuates acetaminophen hepatotoxicity in mice. Microcirculation 13, 19–27. 10.1080/10739680500383423. [DOI] [PubMed] [Google Scholar]
- 37.Kim TH, Choi D, Kim JY, Lee JH, and Koo SH (2017). Fast food diet-induced non-alcoholic fatty liver disease exerts early protective effect against acetaminophen intoxication in mice. BMC gastroenterology 17, 124. 10.1186/s12876-017-0680-z. [DOI] [PMC free article] [PubMed] [Google Scholar]
- 38.Nair AB, and Jacob S (2016). A simple practice guide for dose conversion between animals and human. Journal of basic and clinical pharmacy 7, 27–31. 10.4103/0976-0105.177703. [DOI] [PMC free article] [PubMed] [Google Scholar]
- 39.NHS-UK. About paracetamol for adults https://www.nhs.uk/medicines/paracetamol-for-adults/about-paracetamol-for-adults/.
- 40.Hinson JA, Roberts DW, and James LP (2010). Mechanisms of acetaminophen-induced liver necrosis. Handbook of experimental pharmacology, 369–405. 10.1007/978-3-642-00663-0_12. [DOI] [PMC free article] [PubMed] [Google Scholar]
- 41.Blazka ME, Elwell MR, Holladay SD, Wilson RE, and Luster MI (1996). Histopathology of acetaminophen-induced liver changes: role of interleukin 1 alpha and tumor necrosis factor alpha. Toxicologic pathology 24, 181–189. 10.1177/019262339602400206. [DOI] [PubMed] [Google Scholar]
- 42.Caldow MK, Ham DJ, Godeassi DP, Chee A, Lynch GS, and Koopman R (2016). Glycine supplementation during calorie restriction accelerates fat loss and protects against further muscle loss in obese mice. Clinical nutrition 35, 1118–1126. 10.1016/j.clnu.2015.08.013. [DOI] [PubMed] [Google Scholar]
- 43.Zhou Y, Oresic M, Leivonen M, Gopalacharyulu P, Hyysalo J, Arola J, Verrijken A, Francque S, Van Gaal L, Hyotylainen T, and Yki-Jarvinen H (2016). Noninvasive Detection of Nonalcoholic Steatohepatitis Using Clinical Markers and Circulating Levels of Lipids and Metabolites. Clinical gastroenterology and hepatology : the official clinical practice journal of the American Gastroenterological Association 14, 1463–1472 e1466. 10.1016/j.cgh.2016.05.046. [DOI] [PubMed] [Google Scholar]
- 44.Zhou X, Han D, Xu R, Wu H, Qu C, Wang F, Wang X, and Zhao Y (2016). Glycine protects against high sucrose and high fat-induced non-alcoholic steatohepatitis in rats. Oncotarget 7, 80223–80237. 10.18632/oncotarget.12831. [DOI] [PMC free article] [PubMed] [Google Scholar]
- 45.White PJ, Lapworth AL, McGarrah RW, Kwee LC, Crown SB, Ilkayeva O, An J, Carson MW, Christopher BA, Ball JR, et al. (2020). Muscle-Liver Trafficking of BCAA-Derived Nitrogen Underlies Obesity-Related Glycine Depletion. Cell reports 33, 108375. 10.1016/j.celrep.2020.108375. [DOI] [PMC free article] [PubMed] [Google Scholar]
- 46.Lonardo A, Nascimbeni F, Ballestri S, Fairweather D, Win S, Than TA, Abdelmalek MF, and Suzuki A (2019). Sex Differences in Nonalcoholic Fatty Liver Disease: State of the Art and Identification of Research Gaps. Hepatology 70, 1457–1469. 10.1002/hep.30626. [DOI] [PMC free article] [PubMed] [Google Scholar]
- 47.Dunn LL, Kong SMY, Tumanov S, Chen W, Cantley J, Ayer A, Maghzal GJ, Midwinter RG, Chan KH, Ng MKC, and Stocker R (2021). Hmox1 (Heme Oxygenase-1) Protects Against Ischemia-Mediated Injury via Stabilization of HIF-1alpha (Hypoxia-Inducible Factor-1alpha). Arteriosclerosis, thrombosis, and vascular biology 41, 317–330. 10.1161/ATVBAHA.120.315393. [DOI] [PubMed] [Google Scholar]
- 48.Ruart M, Chavarria L, Camprecios G, Suarez-Herrera N, Montironi C, Guixe-Muntet S, Bosch J, Friedman SL, Garcia-Pagan JC, and Hernandez-Gea V (2019). Impaired endothelial autophagy promotes liver fibrosis by aggravating the oxidative stress response during acute liver injury. Journal of hepatology 70, 458–469. 10.1016/j.jhep.2018.10.015. [DOI] [PMC free article] [PubMed] [Google Scholar]
- 49.Chong J, Soufan O, Li C, Caraus I, Li S, Bourque G, Wishart DS, and Xia J (2018). MetaboAnalyst 4.0: towards more transparent and integrative metabolomics analysis. Nucleic acids research 46, W486–W494. 10.1093/nar/gky310. [DOI] [PMC free article] [PubMed] [Google Scholar]
- 50.Pietzke M, and Vazquez A (2020). Metabolite AutoPlotter - an application to process and visualise metabolite data in the web browser. Cancer & metabolism 8, 15. 10.1186/s40170-020-00220-x. [DOI] [PMC free article] [PubMed] [Google Scholar]
- 51.Pikman Y, Ocasio-Martinez N, Alexe G, Dimitrov B, Kitara S, Diehl FF, Robichaud AL, Conway AS, Ross L, Su A, et al. (2022). Targeting serine hydroxymethyltransferases 1 and 2 for T-cell acute lymphoblastic leukemia therapy. Leukemia 36, 348–360. 10.1038/s41375-021-01361-8. [DOI] [PMC free article] [PubMed] [Google Scholar]
- 52.Barman PK, Mukherjee R, Prusty BK, Suklabaidya S, Senapati S, and Ravindran B (2016). Chitohexaose protects against acetaminophen-induced hepatotoxicity in mice. Cell death & disease 7, e2224. 10.1038/cddis.2016.131. [DOI] [PMC free article] [PubMed] [Google Scholar]
- 53.Gao Z, Yi W, Tang J, Sun Y, Huang J, Lan T, Dai X, Xu S, Jin ZG, and Wu X (2022). Urolithin A protects against acetaminophen-induced liver injury in mice via sustained activation of Nrf2. International journal of biological sciences 18, 2146–2162. 10.7150/ijbs.69116. [DOI] [PMC free article] [PubMed] [Google Scholar]
- 54.Hoque R, Sohail MA, Salhanick S, Malik AF, Ghani A, Robson SC, and Mehal WZ (2012). P2X7 receptor-mediated purinergic signaling promotes liver injury in acetaminophen hepatotoxicity in mice. American journal of physiology. Gastrointestinal and liver physiology 302, G1171–1179. 10.1152/ajpgi.00352.2011. [DOI] [PMC free article] [PubMed] [Google Scholar]
- 55.Kim JY, Lee HJ, Lee SJ, Jung YH, Yoo DY, Hwang IK, Seong JK, Ryu JM, and Han HJ (2017). Palmitic Acid-BSA enhances Amyloid-beta production through GPR40-mediated dual pathways in neuronal cells: Involvement of the Akt/mTOR/HIF-1alpha and Akt/NF-kappaB pathways. Scientific reports 7, 4335. 10.1038/s41598-017-04175-w. [DOI] [PMC free article] [PubMed] [Google Scholar]
- 56.Mackay GM, Zheng L, van den Broek NJ, and Gottlieb E (2015). Analysis of Cell Metabolism Using LC-MS and Isotope Tracers. Methods in enzymology 561, 171–196. 10.1016/bs.mie.2015.05.016. [DOI] [PubMed] [Google Scholar]
- 57.Makino J, Kato K, and Maes FW (1991). Temporal structure of open field behavior in inbred strains of mice. Japanese Psychological Research 33, 145–152. [Google Scholar]
Associated Data
This section collects any data citations, data availability statements, or supplementary materials included in this article.
Supplementary Materials
Data S1-Source Data: Source data used for generating graphs in the manuscript, related to Figures 1–6 and S1–S6.
Video S1: Locomotion of CD and WD fed mice 24 hours following APAP administration, related to Figures 4–5, Figure S5.
Table S1: Altered metabolites in livers from mice with hepatic steatosis compared to controls, related to Figure 1.
Table S2: Altered metabolites in plasma from mice with hepatic steatosis compared to controls, related to Figure 1.
Video S2: Locomotion of WD fed Shmt2fl/fl and Shmt2HKO 24 hours following APAP administration, related to Figure 6.
Data Availability Statement
The raw metabolomics MS data generated in this study were deposited in the Metabolomics Workbench. The accession number is listed in the key resources table. Source data are provided within this paper (Data S1 and S2). Any additional information required to reanalyze the data reported in this paper is available from the lead contact upon request.
KEY RESOURCES TABLE
| REAGENT or RESOURCE | SOURCE | IDENTIFIER |
|---|---|---|
| Antibodies | ||
| Rabbit monoclonal anti-gamma H2A.X (1:1000) | Abcam | Cat# ab81299 |
| Rabbit polyclonal anti SHMT2 (1:1000) | Abcam | Cat# ab224427 |
| Mouse monoclonal anti-beta Actin (1:5000) | Abcam | Cat# ab6276 |
| Mouse monoclonal anti GAPDH (1:1000) | Santa Cruz | Cat# sc-365062 |
| Donkey anti-Rabbit IgG Secondary Antibody (1:20000) | LI-COR Biosciences | Cat# 926–68073 |
| Donkey anti-Mouse IgG Polyclonal Antibody (1:20000) | LI-COR Biosciences | Cat# 926–32212 |
| Chemicals, peptides, and recombinant proteins | ||
| SHIN1 | MedChemExpress | Cat# HY-112066A |
| 13C2 glycine | Sigma Aldrich | Cat# 283827 |
| Acetaminophen | Sigma-Aldrich | Cat# A7085 |
| Glycine | Sigma-Aldrich | Cat# G7126 |
| D-alanine | Sigma-Aldrich | Cat# A7377 |
| N-acetyl-L-cysteine | Sigma-Aldrich | Cat# A7250 |
| RIPA Lysis buffer | ThermoFisher Scientific | Cat# 50–103-5430 |
| Protease inhibitor Cocktail | Merck | Cat# 539134 |
| Bradford Protein Assay | Bio-Rad | Cat# 5000205 |
| Methanol, LC-MS Grade | Merck | Cat# 106035 |
| Acetonitrile, LC-MS Grade | Merck | Cat# 100029 |
| Paraformaldehyde | ThermoFisher Scientific, | Cat# AAJ61899AK |
| Tissue Freezing Medium | Leica | Cat# 14020108926 |
| Oil red O staining (ORO) | Sigma-Aldrich | Cat# 01391 |
| Hematoxylin and eosin (H&E) | Vector Laboratories | Cat# H-3502 |
| Aqueous mounting media | Leica | Cat# 94–9990402 |
| 13C3 serine | Cambridge Isotope Laboratories | Cat# CLM-1574-H |
| Ammonium carbonate, LC-MS Grade | ThermoFisher Scientific | Cat# 10785511 |
| Ammonium hydroxide, LC-MS Grade | ThermoFisher Scientific | Cat# 15547049 |
| Formic Acid, LC-MS Grade | Merck | Cat# 533002 |
| DMEM: F12 media | Sartorius | Cat# 01–170-1A |
| Fetal bovine serum | ThermoFisher Scientific | Cat# 10270106 |
| Penicillin Streptomycin | Sartorius | Cat# 03–031-5B |
| Dexamethasone | Sigma-Aldrich | Cat# D4902 |
| ITS-G | ThermoFisher Scientific | Cat# 41400045 |
| Glutamine | Sartorius | Cat# 03–020-1A |
| Earle’s Balanced Salt Solution | Sartorius | Cat# 02–0101-1A |
| Vitamin solution | Sartorius | Cat# 01–326-1B |
| Non-essential amino acids | Sartorius | Cat# 01–325-1B |
| Glutathione | Sigma-Aldrich | Cat# G6013 |
| Ammonium metavanadate | Sigma-Aldrich | Cat# 204846 |
| Manganese chloride | Sigma-Aldrich | Cat# 244589 |
| Ascorbic acid | Sigma-Aldrich | Cat# A4403 |
| Palmitic acid | Sigma-Aldrich | Cat# P0500 |
| Oleic acid | Sigma-Aldrich | Cat# O1383 |
| BSA | Sigma-Aldrich | Cat# A3294 |
| BODIPY 493/503 | ThermoFisher Scientific | Cat# D3922 |
| DAPI | Sigma Aldrich | Cat# D9542 |
| Dihydroethidium | Sigma Aldrich | Cat# D7008 |
| Hoechst | ThermoFisher Scientific | Cat# R37165 |
| TRIzol | Sigma Aldrich | Cat# 93289 |
| Nitrocellulose membrane | Bio Rad | Cat# 1704271 |
| Critical commercial assays | ||
| Alanine Transaminase Assay Kit | ThermoFisher Scientific | Cat# 50–489-244 |
| Aspartate Transaminase Assay Kit | ThermoFisher Scientific | Cat# 50–489-248 |
| LDH-Cytotoxicity Assay Kit | Abbot GmBH, | Cat# 2P56–22 |
| Triglyceride Colorimetric Assay Kit | Cayman Chemical | Cat# 10010303 |
| Direct-ZolTM RNA MiniPrep Plus kit | Zymo Research | Cat# 11–331PB |
| cDNA Reverse Transcription Kit | ThermoFisher Scientific | Cat# 4368814 |
| Fast SYBR™ Green Master Mix | ThermoFisher Scientific | Cat# 4385612 |
| Cholesterol kit | Abbot | Cat# 04S9230 |
| Deposited data | ||
| Source Data (Data S1 & S2) | This paper | |
| Experimental models: Cell lines | ||
| AML12 cells | ATCC | Cat# CRL-2254 |
| Experimental models: Organisms/strains | ||
| Mouse: C57BL/6JOlaHsd | Envigo | |
| Mouse: Alb-cre mice (C57BL/6J background) | The Jackson Laboratory | Cat# 003574 |
| Mouse: Shmt2fl/fl | This paper | |
| Oligonucleotides | ||
| Primer sequences for Shmt2 genotyping: Forward 5’-GGGCCAGGAGAGTTTATCAGACAG-3’ Reverse 5’-ACAGGCTGCAGGGGTGAGACG-3’ | This paper | |
| Primer sequences for Shmt2 genotyping: Forward 5’- CCTTACGTACGGTCCGTCTTCCAC-3’ Reverse 5’-CCCCCCGCGTTCCCCTCT-3’ | This paper | |
| Primers for Hmox1: Forward 5’- AGGTACACATCCAAGCCGAGA- 3’ Reverse 5’- CATCACCAGCTTAAAGCCTTCT- 3’ | 47 | |
| Primers for Nqo1: Forward 5’- TCTCTGGCCGATTCAGAGTG- 3’ Reverse 5’- CCAGACGGTTTCCAGACGTT- 3’ | 48 | |
| Primers for Gapdh: Forward 5’- AGACGGCCGCATCTTCTT- 3’ Reverse 5’- TTCACACCGACCTTCACCAT- 3’ | 48 | |
| Software and algorithms | ||
| Compound Discoverer | ThermoFisher Scientific | Version 3.3 https://www.thermofisher.com/order/catalog/product/OPTON-31061 |
| GraphPad Prism | GraphPad Software | Version 8.0 https://www.graphpad.com/features |
| Xcalibur | ThermoFisher Scientific | Version 4.1 https://www.thermofisher.com/order/catalog/product/OPTON-30965 |
| TraceFinder | ThermoFisher Scientific | Version 4.1 https://www.thermofisher.com/order/catalog/product/OPTON-31001 |
| MetaboAnalyst | 49 | Version 5.0 https://www.metaboanalyst.ca/ |
| AutoPlotter | 50 | Version 2.6 https://mpietzke.shinyapps.io/AutoPlotter/ |
| Other | ||
| Standard chow diet (CD) | Altromin | Cat# 1320 |
| Low fat diet (LFD) | Envigo | Cat# TD.08485 |
| Western diet (WD) | Envigo | Cat# TD.88137 |
| Liquid diet | Bio-Serv | Cat# F1258SP |
| High fat diet | Altromin | Cat# C1084 |
| Disposable animal feeding needles | ThermoFisher Scientific | Cat# 01–208-88 |
| Superfrost Plus slides | ThermoFisher Scientific | Cat#22–037-246 |
| Precellys 24 tissue homogenizer | Bertin Corp | Cat# P002391-P24T0-A.0 |
| Heparin lithium tubes | BD | Cat# 366664 |
| CK14 homogenizing tubes with 1.4 mm ceramic beads | Bertin Corp | Cat# P000926-LYSK0-A |
| HPLC glass vials and caps | Agilent | Cat# 8010–0542 |
| Q-Exactive Orbitrap | ThermoFisher Scientific | |
| Orbitrap Exploris 240 Mass Spectrometer | ThermoFisher Scientific | |
| Vanquish Flex ultra-high-performance liquid chromatography (UPLC) system | ThermoFisher Scientific | |
| Ultimate 3000 high-performance liquid chromatography (HPLC) system | ThermoFisher Scientific | |
| ZIC pHILIC column | Merck | Cat# 150460 |
| ZIC-pHILIC guard column | Merck | Cat# 150438 |
| ACQUITY UPLC BEH C18 column | Waters | Cat# 186002352 |