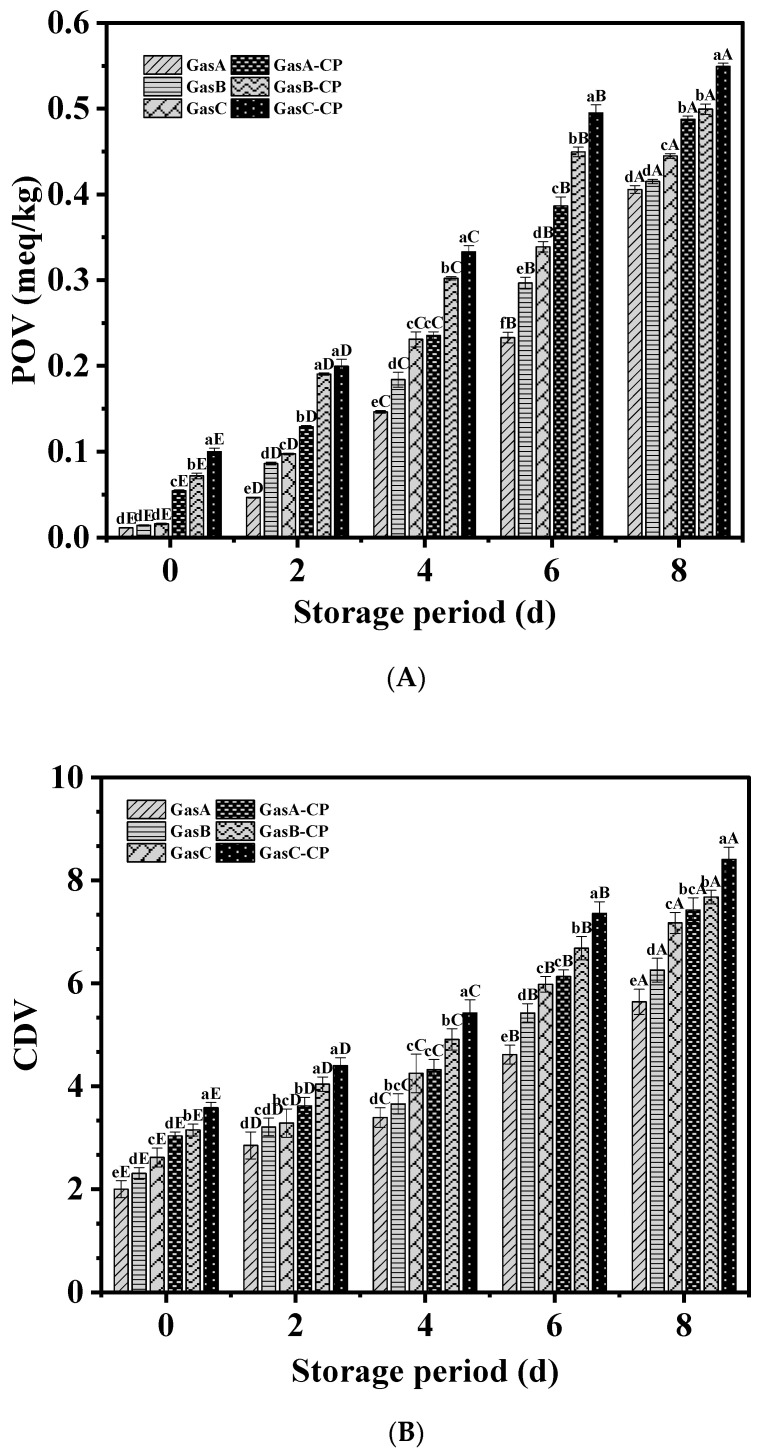
Figure 2.
Changes in POV (A) and CDV (B) of tilapia fillets under different treatment conditions during refrigerator storage. Bars represent standard deviation (n = 3). Different uppercase letters (A–E) on the bars within the same treatment indicate significant differences (p < 0.05). Different lowercase letters (a–f) on the bars within the same cold storage time indicate significant differences (p < 0.05). Caption: See Figure 1.

