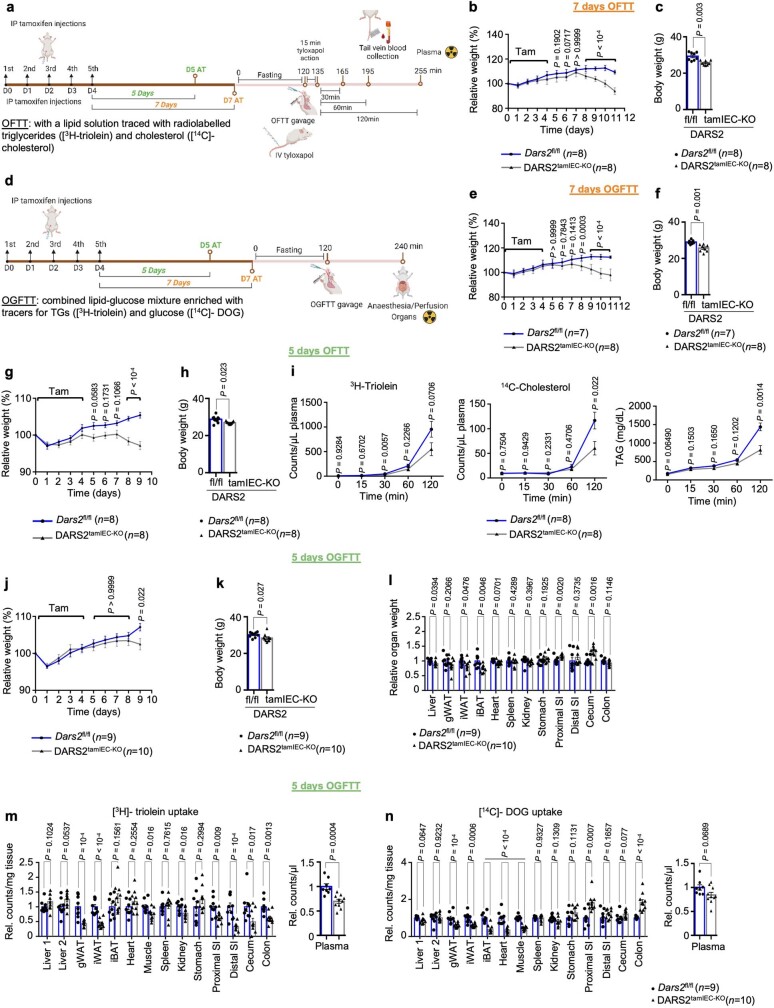
Extended Data Fig. 9. Oral glucose fat tolerance and metabolic tracing in DARS2tamIEC-KO mice 5 and 7 days upon the last tamoxifen injection.
a-n, Metabolic tracing studies performed in DARS2tamIEC-KO mice 7 (a-f) and 5 days (a, d, g-n) upon the last tamoxifen injection. a, Schematic depiction of the experimental design of the oral fat tolerance test (OFTT) created with Biorender.com. On day 5 or 7 after the last tamoxifen injection, mice received an intravenous injection of the lipoprotein lipase inhibitor tyloxapol and were fasted for 2 h, followed by oral gavage with a lipid solution containing 3H-triolein and 14C-cholesterol. Afterwards, blood was collected from the tail vein for the indicated time points and the plasma appearance of the tracers was measured. b, c, g, h, Relative body weight change over the indicated time period (b, g) and body weight recorded on the day of sacrifice (c, h) of Dars2fl/fl (n = 8) and DARS2tamIEC-KO (n = 8) mice subjected to OFTT 7 days (b, c) or 5 days (g, h) upon tamoxifen. e, f, j, k, Relative body weight change over the indicated time period (e, j) and body weight recorded on the day of sacrifice (f, k) of Dars2fl/fl (n = 7) and DARS2tamIEC-KO (n = 8) mice subjected to OGFTT 7 days (e, f) or Dars2fl/fl (n = 9) and DARS2tamIEC-KO (n = 10) mice subjected to OGFTT 5 days (j, k) upon tamoxifen. d, Schematic depiction of the experimental design of the oral glucose fat tolerance test (OGFTT) created with BioRender.com. On day 5 or 7 after the last tamoxifen injection, mice were fasted for 2 h followed by oral gavage with 3H-triolein and 14C-DOG. Tissues were harvested 2 h after the oral gavage. i, Graphs depicting 3H-triolein, 14C-cholesterol and TAG content in portal plasma of Dars2fl/fl (n = 8) and DARS2tamIEC-KO (n = 8) mice subjected to OFTT after intravenous tyloxapol injection. l, Graph depicting relative organ weight of Dars2fl/fl (n = 9) and DARS2tamIEC-KO (n = 10) mice subjected to OGFTT. m, n, Graphs depicting counts of 3H-triolein (m) or 14C-DOG (n) in different organs and plasma from Dars2fl/fl (n = 9) and DARS2tamIEC-KO (n = 10) mice determined 120 min after oral gavage 5 days upon the last tamoxifen injection. In c, f, h, k, l, m and n, dots represent individual mice. In bar graphs data are represented as mean ± s.e.m. and P values were calculated by two-way ANOVA with Bonferroni’s correction for multiple comparison (b, e, g, j), two-sided nonparametric Mann-Whitney U -test (c, f, h, k), and unpaired two-sided Student’s t-test with no assumption of equal variance (i, l, m, n).

