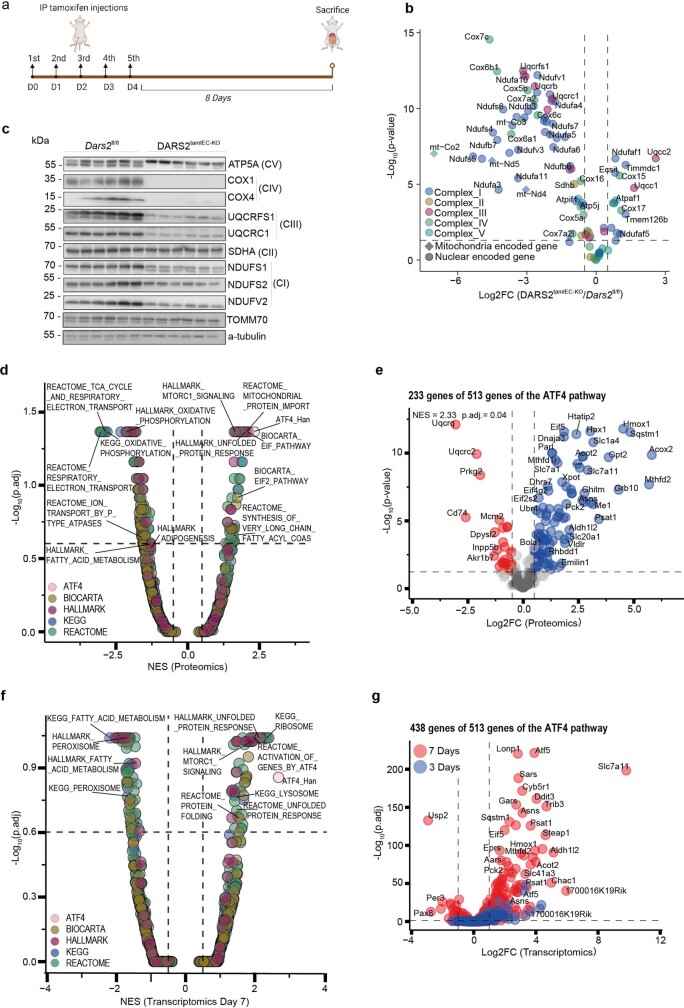
Extended Data Fig. 4. Proteomics and transcriptomics analyses of intestinal tissue and enterocytes from DARS2tamIEC-KO mice.
a, Schematic depicting the experimental design for inducible DARS2 deletion created with BioRender.com. Mice received daily intraperitoneal injections of tamoxifen (1 mg) for 5 consecutive days and were sacrificed 8 days upon the last injection as indicated. b, Volcano plot illustrating the protein expression profile of the mitochondria respiratory chain complex proteins detected in proximal IECs isolated from DARS2tamIEC-KO (n = 11) compared to Dars2fl/fl (n = 9) 7 days upon the last tamoxifen injection. c, Immunoblot analysis of protein extracts from proximal SI IECs from Dars2fl/fl and DARS2tamIEC-KO mice 7 days after the last tamoxifen injection with the indicated antibodies. α- tubulin was used as loading control. d, Volcano plot the profile of the different gene sets (colour coded) after performing GSEA analysis on the proteomics landscape of the DARS2tamIEC-KO (n = 11) mice compared to Dars2fl/fl (n = 9) 7 days upon the last tamoxifen injection. Adjusted p-value (p.adj) and normalized enrichment score (NES) are the result of the GSEA analysis. e, Volcano plot illustrating the protein expression profile of genes that are part of the ATF4 signature based on Han et al44 comparing proximal small intestinal IECs from DARS2tamIEC-KO (n = 11) to Dars2fl/fl mice (n = 9). f, Volcano plot illustrating the profile of the different gene sets (colour coded) after performing GSEA analysis on the transcriptomic profile of DARS2tamIEC-KO (n = 6) mice compared to Dars2fl/fl (n = 6) 7 days upon the last tamoxifen injection. NES and p.adj are the result of the GSEA analysis. g, Volcano plot illustrating the mRNA expression profile of genes that are part of the ATF4 signature based on Han et. al44 comparing the proximal small intestine from DARS2tamIEC-KO mice to Dars2fl/fl 7 days (red, n = 6) and 3 days (blue, n = 7) upon the last tamoxifen injection, respectively. In c, each lane represents one mouse (n = 6 per genotype). For gel source data, see Supplementary Fig. 1. In b and e, unpaired two-sided Welch’s Student t-test with S0 = 0.1 and a permutation-based FDR of 0.01 with 500 randomizations was performed to obtain differentially regulated proteins between the two groups. In d and f, normalized enrichment score (NES) and the statistics (p.adj) were calculated based on an algorithm described in Subramanian et al54. In g, the statistical test producing the P values is Wald test and P‐adjusted values are calculated using the FDR/Benjamini-Hochberg approach. It is computed by function nbinomWaldTest of the Bioconductor DESeq2 package, based on a negative binomial general linear model of the gene counts49.

