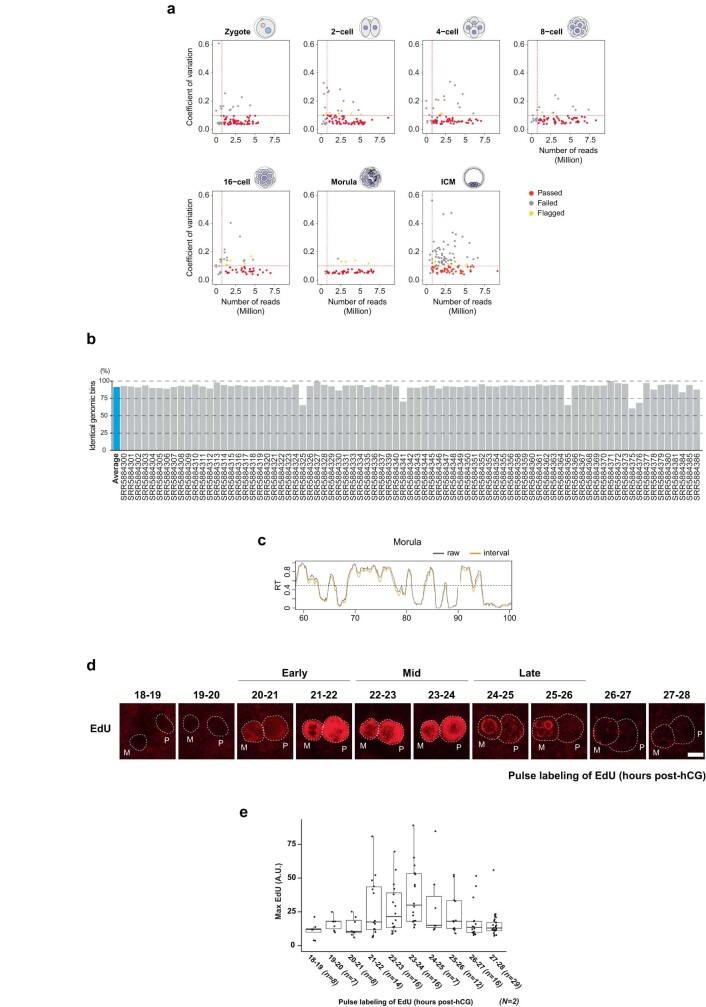
Extended Data Fig. 1. Quality control of scRepli-seq samples.
a. Scatter plots comparing the coefficient of variation calculated on the average read counts per chromosomes and the number of reads for each cell at the indicated embryonic stages. Horizontal and vertical lines indicate cutoffs for filtering cells. b. High concordance of replication state between with or without normalization by cells in G1. c. Comparison between two computational methods to calculate RT profiles. Shown are representative RT profiles derived from either raw or interval averaged replication timing values in the morula stage. d., e. Analysis of DNA replication in zygotes by EdU incorporation (d). Representative images of incorporated EdU and the corresponding quantifications are shown in e. Female and male pronuclei are indicated; the white dotted line depicts the nuclear periphery; note the EdU incorporation at the characteristic ring-shaped heterochromatic regions surrounding the nucleoli precursors between the 24 h and 26 h time. Approximate early, mid, and late S-phase times are indicated based on earlier work. Box plots show median of maximum intensity value and the interquartile range (IQR), whiskers depict the smallest and largest values within 1.5 ×IQR. n, and N, number of analysed embryos and number of independent biological replicates, respectively. Scale bar, 10 μm.

