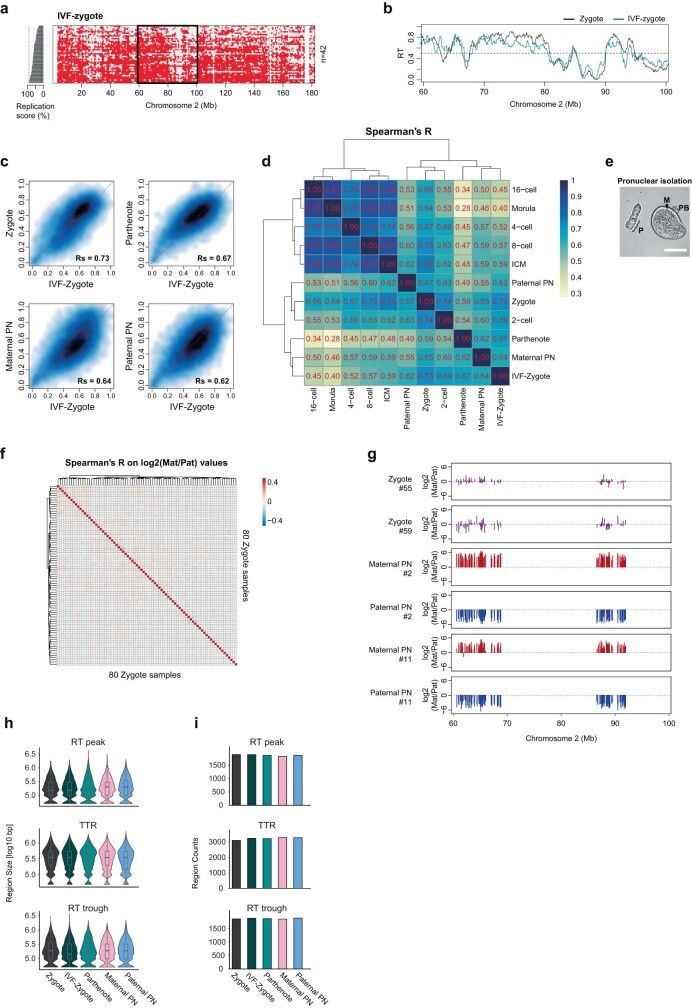
Extended Data Fig. 4. Unique pattern of RT in zygote is not due to differences in replication between maternal and paternal alleles.
a. Representative heatmap depicting binarized replication status of all single cells in zygotes produced by IVF. Cells are ranked by their percentage of replicated genome (replication score), which is plotted as a bar plot on the left. b. Average RT profile of IVF-derived zygotes at the chromosome 2 region indicated by a black rectangle in a. The lines indicate RT profiles calculated as the average of overlapping intervals defined by the genome-wide replication score. c. Smoothed scatterplot comparing the RT values in zygotes, parthenogenetic zygotes, and isolated pronuclei (PN) compared to that of IVF-derived zygote. Rs indicate Spearman’s R. d. Correlation of genome-wide RT values between normal zygotes, zygotes produced by IVF, parthenogenetic zygotes and isolated maternal and paternal pronucleus (PN) embryos and later developmental stages using Spearman’s R. e. Representative brightfield image of isolated paternal pronucleus and remaining maternal pronucleus in the ooplasm. M, P, and PB indicate maternal pronucleus, paternal pronucleus, and polar body, respectively. Pronuclear isolation was repeated twice independently with similar results. Scale bar, 50 μm. f. Correlation heatmap of log2 maternal to paternal ratios between individual zygotes after discrimination of parental origins of sequencing reads using SNPs. Allele-specific bias was calculated by computing correlation coefficients of the maternal to paternal ratios across all genomic bins in which SNPs enabled identification of parent-of-origin allele. g. Representative genomic tracks of the log2 maternal to paternal ratio in zygotes (magenta) and in physically isolated maternal (red) or paternal pronucleus (blue) samples after assigning parental origin based on SNPs. Regions in which there are no reads (e.g. ~65–85 Mb) correspond to regions with no SNPs. h., i. Analysis of the size (h) and number (i) of the replication features in normal zygotes compared to zygotes produced by IVF, parthenogenetic zygotes and isolated maternal and paternal pronucleus (PN). Box plots show median and the interquartile range (IQR), whiskers depict the smallest and largest values within 1.5 ×IQR.

