
Figure 7.
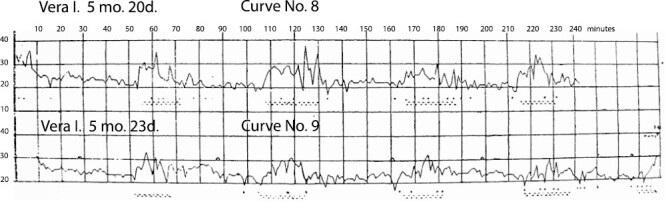
Curve No.8 (Name: Vera I. [girl]; Age: 5 months 20 days). Curve No.9 (shows data from the same child, a few days later) (Name: Vera I.; Age: 5 months 23 days). Explanation for curve No.9: symbol “^” marks the minutes (shown at ~28, 88, 160, and 198 minutes) when the child was turned over to the other side. Figure is from [Denisova, M. P. and Figurin, N. L. (1926). Periodic phenomena in the sleep of children. Novoe v refleksologii i fiziologii nervnoi sistemy, 2, 338–345]. This material is provided solely for scientific and educational uses.