

Abstract
Kiwifruit bacterial canker is a global disease caused by Pseudomonas syringae pv. actinidiae (Psa), which poses a major threat to kiwifruit production worldwide. Despite the economic importance of Actinidia chinensis var. chinensis, only a few resistant varieties have been identified to date. In this study, we screened 44 kiwifruit F1 hybrid lines derived from a cross between two A. chinensis var. chinensis lines and identified two offspring with distinct resistance to Psa: resistant offspring RH12 and susceptible offspring SH14. To identify traits associated with resistance, we performed a comparative transcriptomic analysis of these two lines. We identified several highly differentially expressed genes (DEGs) associated with flavonoid synthesis, pathogen interactions, and hormone signaling pathways, which play essential roles in disease resistance. Additionally, using weighted gene co-expression network analysis, we identified six core transcription factors. Moreover, qRT–PCR results demonstrated the high expression of AcC3H1 and AcREM14 in Psa-induced highly resistant hybrid lines. Ultimately, Overexpression of AcC3H1 and AcREM14 in kiwifruit enhanced disease resistance, and this was associated with upregulation of enzymatic activity and gene expression in the salicylic acid (SA) signaling pathway. Our study elucidates a molecular mechanism underlying disease resistance in kiwifruit and contributes to the advancement of research on kiwifruit breeding.
Introduction
Kiwifruit is widely recognized as a nutritious food owing to its high vitamin C content and abundance of other essential nutrients [1]. China is the world’s major producer and distributor of kiwifruit and therefore possesses rich germplasm resources. Actinidia chinensis var. chinensis and A. chinensis var. deliciosa are among the most widely grown kiwifruit varieties [2, 3]. In particular, A. chinensis var. chinensis, including the well-known cultivar ‘Hort16A’ in New Zealand [4] and ‘Hongyang’ in China, has excellent quality and superior commercial value. Kiwifruit canker is a devastating disease that poses a severe threat to the cultivation and commercial production of kiwifruit. The main symptoms include leaf spots, rotten flowers, and mucus exudation, which can destroy the entire kiwifruit garden [5]. Kiwifruit canker disease is difficult to prevent and control because of its explosive and destructive nature and its propagation cycle within the plant. This disease has spread widely in areas where A. chinensis var. chinensis is cultivated, including China, Japan, Spain, New Zealand, Italy, and Turkey [6–10]. In China, kiwifruit canker mainly affects the central provinces, including Shaanxi and Sichuan [11, 12]. Currently, most A. chinensis var. chinensis are sensitive to Pseudomonas syringae pv. actinidiae (Psa) [13]. Thus, mining and screening this variety for resistance is critical for controlling canker disease.
In nature, plants regularly face threats from various pathogens, such as bacteria, fungi, and viruses. During co-evolution, plants and pathogens have always engaged in an arms race in which each organism strives to outcompete or evade the other. To accomplish this, plants have developed complex defense mechanisms to protect themselves from invaders. In response, pathogens have developed various strategies to avoid or destroy plant defense mechanisms and successfully infect the host [14]. Infection resistance in plants consists of both constitutive defenses, such as plant cuticular layers, cell walls, and preformed antimicrobial compounds, and induced defenses, which are triggered by the recognition of pathogen-associated molecular patterns and pathogen-secreted effectors [15]. To defend against pathogen attack, molecules such as calcium (Ca2+), reactive oxygen species (ROS), salicylic acid (SA), jasmonic acid (JA), ethylene, and flavonoids regulate disease resistance and defense signaling networks [16, 17].
Significant efforts have been made to identify kiwifruit cultivars that exhibit resistance to Psa. A single quantitative trait locus (QTL) for Psa resistance has been identified in linkage group 27 of A. chinensis var. chinensis ‘Hort16A’ using a high-density genetic map, and six minor QTL loci were identified in a resistant breeding parent based on a dense phenotyping technique [18]. Transcriptomic analysis of different kiwifruit varieties has indicated that both coding and non-coding regions in kiwifruit may be involved in responses to Psa [19]. Research has also shown that signal regulatory networks and metabolic pathways play essential roles in kiwifruit immunity. Changes in hormones, such as SA and JA, as well as secondary metabolites, including ROS, malondialdehyde (MDA), and superoxide dismutase (SOD), have also been found to be important indicators of plant resistance [20, 21]. It has been shown that JA accumulates in the sensitive line of A. chinensis var. chinensis ‘Hongyang’, but decreases in the resistant line A. chinensis var. deliciosa ‘Jinkui’ during Psa infection [22]. Song et al. showed that the SA-controlled signaling pathway genes NPR1, TGA, and PR1 displayed higher expression in the resistant line Actinidia eriantha var. ‘Huate’ than in the sensitive ‘Hongyang’ [23]. These findings indicate that the SA and JA signaling pathways may be involved in the resistance response to Psa. In addition, kiwifruit regulates its metabolism to suppress infection, and Psa can enhance pathogenesis by manipulating the carbon/nitrogen metabolic pathway and sugar-mediated immunity [24].
The CCCH (C3H) type zinc finger transcription factor (TF) and B3 DNA-binding protein have been reported to be involved in the regulation of biotic and abiotic stresses in plants [25–29]. Silencing GhC3H20 reduces the tolerance of cotton to salt stress. A yeast two-hybrid test identified two GhC3H20 interacting proteins (GhPP2CA and GhHAB1). GhC3H20 interacts with GhPP2CA and GhHAB1 to participate in the abscisic acid (ABA) signaling pathway and improve salt tolerance in cotton [30]. The CARAV1 gene (B3 domain protein) has been reported to enhance the infection of transgenic Arabidopsis thaliana with P. syringae pv. tomato DC3000 and the activation of the CARAV1 promoter is induced by Bemisia tabaci, SA, and ABA [31]. However, there are few reports on the two types of TF in kiwifruit. Additionally, there is limited research on the function of B3 DNA-binding proteins and C3H TFs, which requires further exploration.
To date, studies have demonstrated limited understanding of the mechanisms underlying kiwifruit resistance to canker diseases. In this study, we aimed to identify the traits associated with Psa resistance in F1 progeny derived from the same parental lines. We evaluated 44 A. chinensis var. chinensis hybrid lines and selected two F1 representative offspring that exhibited different sensitivities to Psa. We used RNA-seq to perform comparative transcriptomics of the two progenies, including differential gene expression analysis and weighted gene co-expression network analysis (WGCNA). This allowed us to identify multiple genes associated with resistance and susceptibility, as well as the associated pathways that correlate with Psa infection. Our study demonstrated that comparing kiwifruit germplasm resources with a consistent genetic background is highly productive in revealing disease resistance pathways. Our findings lay a foundation for the breeding of kiwifruits resistant to Psa infection.
Results
Selection of F1 kiwifruit hybrids with differential susceptibility to Psa infection
To identify traits associated with Psa resistance and to minimize contributions from different genetic backgrounds, we first generated kiwifruit F1 progeny by crossing A. chinensis var. chinensis ‘Xiong22’ (♂, Psa-resistant) with A. chinensis var. chinensis ‘Hort16A’ (♀, Psa-susceptible). We obtained 44 F1 offspring and tested their susceptibility to Psa infection using leaf disc assays. Based on the disease index (D) [32], we classified the 44 hybrid lines into four categories: high resistance (HR, D < 10), resistance (R, 10 ≤ D < 25), tolerance (T, 25 ≤ D < 40), susceptibility (S, 40 ≤ D < 65), and high susceptibility (HS, D ≥ 65). We noticed that most of the kiwifruit offspring lines were S or HS (35 out of 44), and there were four lines with HR phenotype, namely RH468, RH259, RH301, and RH12. Among them, RH12 was the line with the best phenotype (Fig. 1).
Figure 1.

Kiwifruit leaf disease index evaluating Psa susceptibility of F1 offspring. Kiwifruit names with prefixes ZH, SH, and RH belong to 44 A. chinensis var. chinensis hybrid lines. Actinidia chinensis var. deliciosa ‘Xuxiang’ (XX, resistant), A. chinensis var. deliciosa ‘Cuixiang’ (CX, resistant), A. chinensis var. chinensis ‘Hongyang’ (HY, highly susceptible), A. chinensis var. chinensis ‘Hort16A’ (Hort16A, highly susceptible), A. chinensis var. chinensis ‘Xiong22’ (Xiong22, resistant), A. chinensis var. deliciosa ‘Hayward’ (HWD, tolerant) and Actinidia macrosperma var. ‘Dazi’ (DZ, highly resistant) were utilized as the seven controls. Different letters denote statistically significant differences (P < 0.05, Duncan’s multiple range test).
To further confirm the observed resistance, we selected RH12 and a representative HS line, SH14, and performed several virulence tests. Both lines exhibited the same ploidy, as determined by flow cytometry (2n = 58 chromosomes) (Fig. 2a). Leaf disc assays consistently showed that SH14 was highly susceptible to the high-virulence Psa strain M228, whereas RH12 was significantly more resistant (Student’s t test, P < 0.001) (Fig. 2b and c). We also performed a leaf vein assay by inoculating Psa into kiwifruit veins through a puncture wound. To assess the dissemination of infection, we used an eGFP-labeled Psa M228 strain (Fig. 2b). As shown in Fig. 2d and e, at 5 days post-inoculation (dpi) the kiwifruit veins of the two lines showed significantly different pathogen expansion (Student’s two-tailed t test, P < 0.001). Light and transmitted light microscopy showed extensive colonization of pathogenic bacteria in the intercellular spaces of Psa-infected SH14 leaf tissues at 3 dpi. Further cytological observations using transmission electron microscopy revealed that infection with the pathogen led to cytoplasmic shrinkage and chloroplast disintegration in SH14. However, both the membrane structures remained relatively intact. In contrast, RH12 leaf tissues exhibited dense cytoplasm containing intact organelles and minimal bacterial distribution in the intercellular spaces (Fig. 2f). Overall, the results of these different virulence tests illustrate that we identified two F1 kiwifruit hybrids that were derived from the same parental lines but exhibited varying susceptibility to Psa.
Figure 2.

Comprehensive phenotypic analysis of A. chinensis var. chinensis hybrid RH12 and SH14 lines upon Psa infection. a Ploidy detection of RH12 and SH14 by flow cytometry. HY, A. chinensis var. chinensis ‘Hongyang’, a known diploid, was used as a control. b Leaf disc assay showing differences in Psa resistance between RH12 and SH14. HY, A. chinensis var. chinensis ‘Hongyang’, was used as a control, hereafter. c Quantitative measurement of Psa-infected RH12 and SH14 leaf discs shown in (b). ***P < 0.001 (Student’s two-tailed t test). d Bacterial growth in leaf veins at different time points under UV light. Scale bars represent 5 mm. e Infected vein length shown in (d). ***P < 0.001 (Student’s two-tailed t test). f Light and transmission electron micrographs of cross-sections of kiwifruit leaves (RH12 and SH14) infected with Psa. Chl, chloroplast.
Kiwifruit lines with different disease susceptibilities exhibit distinct immune responses to Psa infection
After infection, plants typically regulate their metabolites to defend against pathogens [33]. It has been reported that, at the early stages of Psa infection, kiwifruit resistance depends on the activation of the antioxidant system [34]. To characterize the differences between the responses of RH12 and SH14 lines to Psa infection, we measured several aspects of the plant immune response during early-stage infection (0–24 h). RH12 demonstrated an earlier ROS burst, with a 1.59-fold higher H2O2 concentration than SH14 at 6 h post-inoculation (hpi) (Supplementary Data Fig. S2a). We found that MDA and hydroxyl ion (OH) levels in SH14 significantly increased at 6 hpi compared with those in RH12 (Supplementary Data Fig. S2b and d). The maximum OH content in SH14 (130.3 U μg−1 FW) was 1.72 times higher than that observed in RH12 at 24 hpi. However, no significant changes were observed in electrolyte leakage in RH12 and SH14 in response to pathogen infection (Supplementary Data Fig. S2c). In contrast, changes in proline (PRO) and glutathione (GSH) contents were more pronounced in RH12 (Supplementary Data Fig. S2e and f). PRO levels increased with infection time in both kiwifruit lines. However, higher PRO levels in RH12 than in SH14 were evident as early as 6 hpi. We also measured the activities of SOD and catalase (CAT), as these two molecules reflect the severity of Psa infection in kiwifruit leaves [35]. We found that CAT activity in the two lines significantly increased from 0 to 12 hpi, peaking at 12 hpi; however, CAT activity in SH14 was lower than that in RH12 at 12 hpi (Supplementary Data Fig. S2g). The RH12 and SH14 lines also varied in terms of their SOD activity. RH12 displayed an earlier increase in SOD activity, peaking (82.33 U g−1 FW) at 6 hpi, whereas SH14 reached its peak SOD activity at 12 hpi (Supplementary Data Fig. S2h). Additionally, we found that there was a higher accumulation of SA in SH14, ~2-fold higher than in RH12. However, JA was significantly induced in SH14, whereas it remained unchanged in RH12, suggesting that JA may mediate the susceptibility of kiwifruit to Psa infection (Supplementary Data Fig. S2i). Collectively, our analyses indicate that RH12 and SH14 kiwifruit lines exhibit different immune responses to Psa infection, which may contribute to their divergent resistance.
Global transcriptome analysis of RH12 and SH14 upon Psa infection
To further investigate the mechanisms underlying the differential responses of RH12 and SH14 to Psa infection, we performed RNA sequencing (RNA-seq) on leaf discs of RH12 and SH14 infected with Psa. Infected samples were collected at four time points (0, 6, 12, and 24 hpi), based on a previous report [36]. On average, 84 020 044 high-quality reads were generated from each sample. Of these, 83.55% (RH12) and 88.61% (SH14) were mapped to the Hong Yang v3 genome (http://kiwifruitgenome.org/) (Supplementary Data Table S1). Additionally, principal component analysis revealed that RH12 and SH14 exhibited distinct patterns of gene expression migration over time during Psa infection (Supplementary Data Fig. S3).
To identify differentially expressed genes (DEGs), we used two approaches simultaneously. First, we compared the genes expressed at 6, 12, and 24 hpi with those at 0 hpi for each kiwifruit line. We observed that, as the infection progressed, the number of upregulated genes increased in both lines. Interestingly, although the number of downregulated genes in RH12 decreased gradually during infection, the number increased over time in SH14 (Fig. 3a). SH14 had the largest DEG pool at 24 hpi compared with all 10 of the identified dynamic comparison groups, with 5524 upregulated genes and 4406 downregulated genes. Strikingly, Actinidia39891.t1 and Actinidia05137.t1 were among the highly upregulated genes, both of which were related to redox and flavonoid synthesis (Fig. 3a, Supplementary Data Table S2), indicating that these two genes may play a key role in disease resistance. We also compared the gene expression levels between the two lines at each time point. We identified 2035 DEGs with high expression levels in RH12 at 0 hpi and 1927 highly expressed DEGs at 12 hpi. Based on the 10 comparison groups (Fig. 3a), several of the top five most highly expressed genes were associated with disease resistance, such as the disease-related gene Actinidia37001.t1, a receptor kinase gene (Actinidia11043.t1), and the disease-related cell death gene Actinidia33551.t1.
Figure 3.

Differential gene expression analysis in A. chinensis var. chinensis hybrids RH12 and SH14 upon Psa infection. a Number of DEGs and highly expressed genes in RH12 and SH14. The criteria for screening DEGs were |log2fold change| > 1 and FDR < 0.01. FC, fold change. The gene identifiers of the top five DEGs in each comparison group are shown in the figure. RH12-6 h/0 h (RH12-12 h/0 h, RH12-24 h/0 h) represents the comparison between RH12 at 6 and 0 h (RH12 at 12 versus 0 h, RH12 at 24 versus 0 h). SH14-6 h/0 h (SH14-12 h/0 h, SH14-24 h/0 h) represents the comparison of SH14 at 6 versus 0 h (SH14 at 12 versus 0 h, SH14 at 24 versus 0 h). RH12/SH14-0 h (RH12/SH14-6 h, RH12/SH14-12 h, RH12/SH14-24 h) represents the comparison between RH12 and SH14 at 0 h (6, 12, and 24 h). b, c Significantly differentially expressed genes in RH12 and SH14. d STEM (Short Time-series Expression Miner) analysis of DEG expression trends in the two kiwifruit lines. In each profile, the line represents the expression trend of DEGs; the number above represents the number of profiles, and the bottom number represents the number of DEGs in each profile.
Temporal trends and Kyoto Encyclopedia of Genes and Genomes analysis of differentially expressed genes
A comparison of gene expression in RH12 and SH14 at different time points revealed fewer DEGs in RH12 than in SH14 (11 013 versus 13 280). When we compared gene expression at 6, 12, and 24 hpi with expression at 0 hpi in each line, we observed that the numbers of DEGs at all three time points in RH12 and SH14 were approximately equal (3555 versus 3486). However, the largest number of DEGs was observed at 24 hpi (versus 0 hpi), when SH14 had 1539 more DEGs than RH12 (Fig. 3a–c).
To identify the pathways enriched for DEGs, we performed Kyoto Encyclopedia of Genes and Genomes (KEGG) analysis on the DEGs from 10 comparison groups (Fig. 3a) and identified the top 15 pathways (Supplementary Data Fig. S5). The plant hormone signal transduction pathway was enriched for DEGs in all 10 comparison groups. The pathways of flavonoid biosynthesis, phenylpropanoid biosynthesis, and plant–pathogen interactions showed a high enrichment of DEGs. Gene expression trends reflected the specific responses of kiwifruit to Psa infection. The results revealed opposite expression patterns of DEGs between the two lines during infection, such as profile17 and profile2, profile19 and profile0 (Fig. 3d). Among the profiles, module profile17 in RH12 showed an upward expression trend in 2867 genes (P < 0.05), whereas module profile2 in SH14 showed a downward trend in 2586 genes (P < 0.05). Gene Ontology (GO) analysis revealed that there were six common GO terms (response to external stimulus, plasma membrane, vacuole, cell wall, external encapsulating structure, and transferase activity) present in both profile2 (SH14) and profile17 (RH12) (Supplementary Data Fig. S4a and b). Moreover, expression analysis of the DEGs for these six GO terms revealed inconsistent expression patterns between RH12 and SH14 in profile17 (Supplementary Data Fig. S4c–h). In profile17, RH12 exhibited an upregulation trend among the DEGs, whereas SH14 showed diverse expression patterns with both upregulation and downregulation evident in the DEGs. Additionally, the DEGs in profile2 were downregulated in SH14, whereas only a few DEGs in RH12 were downregulated. However, significant differences in expression were primarily observed between RH12-0 h and SH14-0 h (Supplementary Data Fig. S4c–h).
Temporal and spatial expression of hormone signaling, flavonoid, and plant–pathogen pathway interactions differs between RH12 and SH14
According to KEGG enrichment analysis, we found that DEGs related to ‘plant hormone signal transduction’ and ‘flavonoid’ and ‘plant hormone signal transduction’ were significantly enriched (Supplementary Data Fig. S5). As hormone signal transduction plays an active role in plant immune regulation [37], we selected key genes involved in five major hormone-signaling pathways related to plant defense and examined their expression in RH12 and SH14 (Supplementary Data Fig. S6a). We identified 120 DEGs involved in the kiwifruit hormone signal transduction process (Supplementary Data Table S3a). As shown in Supplementary Data Fig. S6a, the expression patterns of DEGs in the ethylene signaling pathway differed between RH12 and SH14. A notable example is the JA pathway and we found that the JAZ-like gene (Actinidia37726.t1) was not significantly induced in either line, but its expression in SH14 was significantly lower than that in RH12 at 12 and 24 hpi. For the SA pathway, we found that the positive regulators of TGA-, PR1-, and NPR1-like genes (Supplementary Data Table S5) were induced by Psa, particularly Actinidia39176.t2 (NPR1-like).
To further explore the DEGs involved in the interactions of SH14 and RH12 in the plant–pathogen interaction pathway, we obtained the genes in this pathway in kiwifruit by performing BLASTp comparison with A. thaliana (E-values <10−3). We identified 131 DEGs with adequate expression (FPKM <0.01) and several genes that appeared to respond to Psa infection (Supplementary Data Table S3b, Supplementary Data Fig. S6b). Notably, we found that two key components of the calcium signal transduction pathway, CDPK and CaMCML, showed similar expression trends in both kiwifruit lines, but their expression in RH12 was significantly higher than in SH14 (P < 0.05) (Supplementary Data Table S3b). In addition, we observed that the expression of the ROS regulator RBOH in RH12 was significantly higher than that in SH14 at 12 and 24 hpi; it is an important regulator of ROS burst and therefore resistance to pathogen infection, which was the original downregulation trend of Actinidia28337.t1 (an RBOH-like gene) (Supplementary Data Fig. S6b).
Blastn analysis mapped 115 DEGs to the flavonoid pathway in RH12 and SH14 (Supplementary Data Table S3c, Supplementary Data Fig. S6c). Several DEGs in the phenylpropanoid biosynthesis pathway were annotated as key phenylalanine ammonia lyase (PAL)-like genes, which are essential for phenylpropanoid biosynthesis [38]. Of all the PAL-like genes, only six were significantly upregulated (P < 0.05) in RH12 (Supplementary Data Table S3c). We identified 16 F3H-like genes in the flavonoid pathway that play key roles in regulating the accumulation of flavonoid metabolites in plants [39]. In addition, we identified DEGs homologous to TT5 (chalcone synthase) and chalcone isomerase-like (CHIL) genes, which synthesize pinocembrin, liquiritigenin, butin, and naringenin (Supplementary Data Table S3c, Supplementary Data Fig. S6c). These results suggest that the expression of flavonoid biosynthesis genes was highly upregulated in the resistant line RH12 in response to Psa stress.
Co-expression network analysis provides insights into the genes contributing to Psa resistance
WGCNA was used to identify highly correlated gene clusters and link them to biological traits [40]. Rather than concentrating on a single gene or isolated biomarker, WGCNA modularly investigates co-expressed genes and extracts intramodular hub genes from system networks, which increases the sensitivity of recognizing important targets for biological regulation [41]. To further identify the key genes involved in pathogen resistance in RH12 and SH14, we performed WGCNA. Based on a power value of 16 (Supplementary Data Fig. S7), we grouped 23 samples and 30 344 DEGs into 20 modules (Supplementary Data Fig. S8a). The samples at different time points had different degrees of association with the traits (Supplementary Data Fig. S8b). Likewise, association analysis revealed relationships between the traits of interest and the specific gene modules (Supplementary Data Fig. S8c). The number of genes varied significantly among the modules. The most extensive module (MEturquoise) possessed 5800 genes, whereas the smallest module (MEroyalblue) contained only 32 genes. Genes in each module were considered co-expressed and functionally related. Because highly correlated modules (red squares) are likely to be involved in similar biological processes, four highly trait-specific modules were further analyzed (Supplementary Data Fig. S8c). We found that the MEblack module (R > 0.8) was highly correlated with GSH and R.S (R, resistant; S, susceptible), whereas the MEgreen module (R > 0.64) was highly positively correlated with the H2O2, PRO, electrolyte, GSH, and OH pathways. In addition, MEturquoise (R > 0.77) positively correlated with MDA, electrolyte, and OH. The MEpink module (R < −0.73) was highly negatively correlated with R.S (Supplementary Data Fig. S9). Overall, the correlation between genes in the modules and their corresponding traits suggests that genes within a module may have similar functions that can be related to phenotypes of interest.
Regulatory networks of the resistance-related modules
To further investigate hub genes in the WGCNA modules, we screened 592 (weight > 0.15), 636 (weight > 0.15), 423 (weight > 0.15), and 483 (weight > 0.35) genes from the four modules. We analyzed the gene expression profiles of the four modules and found that the gene expression in each module was unique. In the MEgreen module, the expression trends for RH12 and SH14 were the same, whereas in the MEblack module RH12 and SH14 displayed opposing expression patterns (Supplementary Data Fig. S10a and b). In comparison, the MEpink and MEturquoise modules had similar expression patterns; the genes in the modules were highly expressed in SH14 (Supplementary Data Fig. S10a and b). To detect critical hub genes, we performed cytoHubba analysis to efficiently screen for genes. We defined hub genes by selecting the top 5% of genes with the highest degree (most edges) in each module (Fig. 4) and identified a subset of 107 hub genes. Of the hub genes in the MEturquoise module (Fig. 4a), Actinidia37889.t1 (β-glucosidase) had the highest degree (69 edges) and may be involved in regulating processes such as lignification of plant cell walls and defense responses of plants to adversity [42, 43]. We also found that several hub genes were DEGs involved in the activation of cell wall lignification hormones and release of aromatic compounds. In the MEblack module, we found critical hub genes involved in salt resistance and plant cell wall synthesis (Actinidia33019.t1 and Actinidia01250.t1), and encoding M3KP1 (Actinidia14678.t1) and protein kinases (Actinidia04156.t1 and Actinidia27276.t1) that regulate ROS. Intriguingly, critical hub genes in the MEblack (Fig. 4b) and MEpink (Fig. 4c) modules were expressed in opposite directions. We identified 21 critical hub genes in the MEgreen module (Fig. 4d), and the highest-degree hub gene was annotated as Actinidia38741.t1 (protein-enhanced disease resistance 2) (40 edges).
Figure 4.
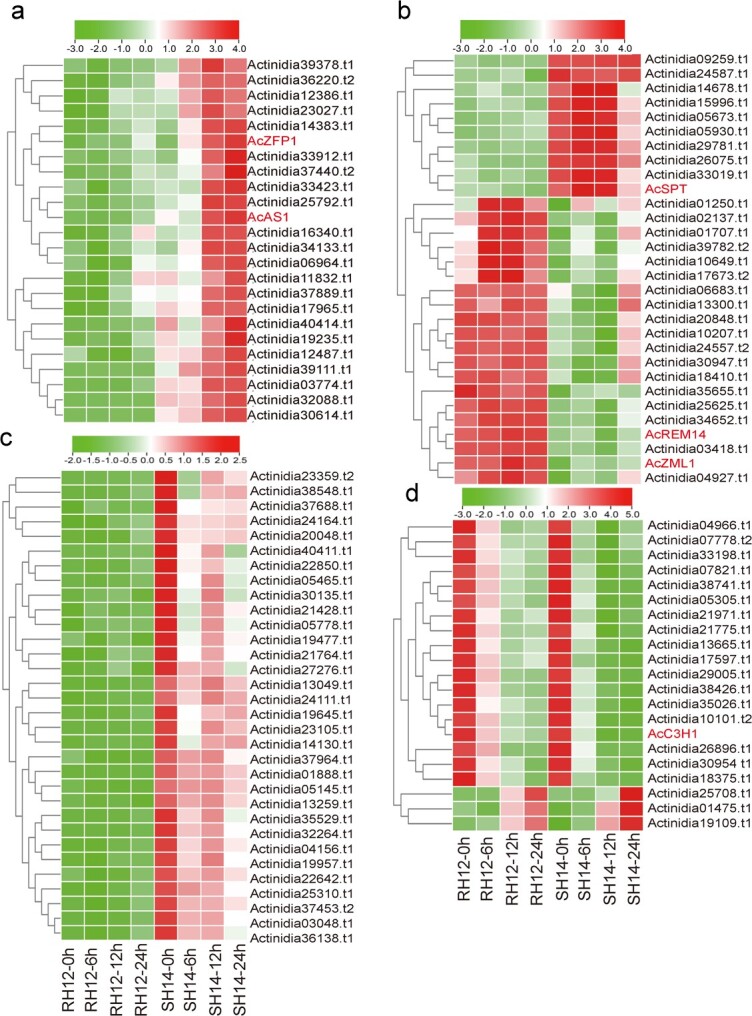
Heat maps showing the top 5% hub genes in the four WGCNA modules. a Expression patterns of 24 hub genes in the MEturquoise module. b Expression patterns of 30 hub genes in the MEblack module. c Expression patterns of 32 hub genes in the MEpink module. d Expression patterns of 21 hub genes in the MEgreen module.
Functional annotation of hub genes
To better understand the function of traits highly correlated with the modules, the hub genes of the four modules were subjected to GO analysis (P < 0.05). We found that the genes co-expressed in the MEgreen module (electrolyte- and H2O2-specific modules) (Supplementary Data Fig. S10c, Supplementary Data Table S6a) were related to ‘RNA binding’, ‘generation of precursors and energy’, and ‘nucleoplasm’. Notably, the biological processes involved in ‘metabolic process’ were highly enriched. In the MEblack module (Supplementary Data Fig. S10d,Supplementary Data Table S6b), genes were enriched for ‘lipid metabolism processes’, ‘lysosomes’, and ‘cell cycle’ functions. The genes in the MEpink module (Supplementary Data Fig. S11c, Supplementary Data Table S6c) were mainly involved in ‘cell wall’, ‘cytoskeleton’, and ‘response to biotic stimulus’ roles. In comparison, genes in the MEturquoise module were enriched in ‘chloroplast’, ‘thylakoid’, and ‘photosynthesis biological processes’ (Supplementary Data Fig. S11d, Supplementary Data Table S6d). In summary, we identified hub genes associated with disease resistance.
Identification of the potential transcription factors that regulate kiwifruit resistance to Psa infection
TFs are activated after a series of signal transduction events when plants sense invading pathogens. Activated TFs specifically interact with cis-acting elements in the corresponding gene promoters in the nucleus, thereby activating the transcriptional expression of defense response-related genes [44]. We specifically investigated the TFs in the modules and identified 661 TFs, accounting for 29.35% of all kiwifruit TFs (Supplementary Data Table S5). Most TFs were enriched in the MEgreen module (325), whereas the MEpink module was least enriched (52). We found that the largest number of TFs (71) belonged to the NAC family, accounting for 57.25% (71/124) of the NAC TFs in kiwifruit. Other identified TFs belonged to the bHLH, MYB, C2H2, and ERF families, accounting for 20.00, 31.67, 25.69, and 21.88% of the total TFs in their respective families (Supplementary Data Table S5). We further screened the co-expression network using Cytoscape and identified 115 TFs that were displayed in the co-expression network of the four modules.
To identify the TFs critical for kiwifruit defense against Psa infection, we constructed a network using cytoHubba analysis. We discovered six (AcSPT, AcZML1, AcREM14, AcC3H1, AcAS1, and AcZFP1) high-degree (top 5%) TFs in four modules (Supplementary Data Table S6). Further analysis revealed that these six TFs may interact with several critical resistance genes (Supplementary Data Table S8). Notably, AcSPT and AcMAPKKK1 (mitogen-activated protein kinase kinase kinase1) (Actinidia14678.t1) were closely connected. AcZFP1 and AcLRR-RLP (Actinidia19235.t1) may have an interactive regulatory relationship (Supplementary Data Fig. S10e and f) (Supplementary Data Fig. S11e and f). In addition, cis-acting element analysis of the six TFs revealed a variety of hormone regulatory sites. For example, many response elements related to adversity and involved in ‘MeJA-responsiveness’ and ‘abscisic acid’ were identified in AcSPT. AcREM14 also contained a gibberellin-responsive element (Supplementary Data Table S7). In summary, through co-expression analysis, we found six TFs likely to play essential roles in defending against bacterial canker disease of kiwifruit.
To verify the gene expression profiles obtained from RNA-seq, we selected 20 genes, including those involved in important signaling pathways as well as predicted hub genes, and performed quantitative PCR analysis, which indicated that the relative gene expression of these selected genes was generally consistent with the transcriptomic data (Supplementary Data Fig. S12).
To investigate whether the expression of the six core TFs is associated with resistance of diploid kiwifruit to bacterial canker disease, we infected four HS kiwifruit materials (SH14, SH35, SH193, and SH225) and four HR materials (RH12, RH301, RH468, and RH259) (Fig. 1, Supplementary Data Fig. S1), which belong to the same hybrid diploid population as Psa-M228, and their expression was analyzed by qRT–PCR. Among them, ‘Hort16a’ and ‘Xiong22’ were used as the positive and negative controls, respectively. The experimental results showed that three TF genes (AcC3H1, AcZML1, and AcREM14)were highly expressed in the HR varieties. AcZML1 and AcC3H1 both showed a high expression trend induced by Psa in three HR materials (RH12, RH259, and RH468), whereas AcREM14 showed a significantly high expression trend in three HR materials (RH12, RH259, and RH301) (P < 0.05). Based on these results, we speculated that the increase in the expression levels of three TF genes (AcC3H1, AcZML1, and AcREM14) may be a key factor in kiwifruit disease resistance (Fig. 5).
Figure 5.

qRT–PCR was performed to determine the expression levels of the six TFs in the eight samples. Among them, ‘Hort16A’, SH14, SH35 (ZH35), SH193, and SH225 were highly susceptible (HS) materials, RH12, RH301, RH468, and RH259 were highly resistance (HR), and ‘Xiong22’ was resistant (R). Data are presented as mean ± standard deviation and each assay was repeated three times. Different letters indicate statistical significance (Duncan’s multiple range test, P < 0.05).
AcC3H1 and AcREM14 are important regulators of disease resistance
To validate the disease resistance functions of the three TFs in kiwifruit, we individually constructed overexpression vectors for each TF and performed transient transformation experiments in kiwifruit. Overexpression of AcREM14 and AcC3H1 significantly reduced the symptoms in kiwifruit leaf discs (Fig. 6a). We then used qRT–PCR to confirm that all three genes were upregulated to varying degrees in ‘Hort16A’ (Supplementary Data Fig. S13a). Next, we used the plate-coating method to count the bacteria on four overexpressing leaf discs and found that bacterial colonization was significantly reduced in the discs treated with OE-AcREM14 and OE-AcC3H1, which matched the statistical analysis of kiwifruit incidence (Fig. 6b, Supplementary Data Fig. S13b), indicating that AcREM14 and AcC3H1 can enhance the ability of kiwifruit leaves to resist Psa.
Figure 6.

Fig. 6. Functional identification of three core transcription factors, AcC3H1, AcZML1, and AcREM14, and evolutionary analysis of AcREM14 and AcC3H1. a Phenotypic observation of overexpressing leaf discs after 5 days of Psa infection. PC, the positive control, refers to the transient overexpression of the empty vector pCAMBIA1302 in ‘Xiong22’, followed by inoculation with Psa. Similarly, transient overexpression of the empty vector pCAMBIA1302 in kiwifruit ‘Hort16A’ leaves, followed by inoculation with Psa, served as a negative control (NC). b Biological content of bacteria M228 (Psa) in leaf discs. Three independent biological replicates were used for each experiment. The least significant difference method was used for statistical analysis. Different letters indicate statistical significance (P < 0.05). c, d Systematic evolutionary analysis of homologous proteins of (c) AcREM14 and (d) AcC3H1 in different species. The letters a-f and the numbers I-VI respectively represent the grouping of homologous proteins of AcREM14 and AcC3H1. MEGAX (https://www.megasoftware.net/dload_mac_beta) was used to construct phylogenetic trees. The neighbor-joining method was used with a bootstrap value of 1000. The evolutionary gene names were based on the National Center for Biotechnology Information (NCBI) (https://www.ncbi.nlm.nih.gov/) annotations, and the corresponding gene IDs for the simplified gene names are shown in Supplementary Data Table S11.
To study the evolutionary characteristics of AcREM14 and AcC3H1, homologous phylogenetic trees were constructed for these two proteins in different species. The study found that, among the homologous proteins in group b (Fig. 6c), AcREM14 had the highest number (18), accounting for 37.5% of the total homologous proteins (Fig. 6c). Multiple sequence alignments showed that AcREM14 had three typical B3 DNA-binding domains (Supplementary Data Fig. S14). The variability of REM14 homologous proteins was greater in kiwifruit and other species; however, the AcREM14 sequence was relatively conserved in kiwifruit, suggesting that this protein may be unique and plays a special role in kiwifruit. In contrast to AcREM14, AcC3H1 contained homologous proteins in multiple species (Fig. 6d, Supplementary Data Fig. S15) and its sequence variation was small in both kiwifruit and other species, indicating that this protein is functionally conserved. We also cloned the coding sequences of AcREM14 and AcC3H1 from RH12 and SH14 and translated them into proteins for comparison. The results showed that there were individual amino acid mutations in the sequences of these two proteins in RH12 and SH14, but no large-fragment deletions were observed (Supplementary Data Figs S14 and S15). Furthermore, through a comparative analysis of the promoter regions, we found that both AcREM14 (Supplementary Data Fig. S16a) and AcC3H1(Supplementary Data Fig. S16b) had base-point mutations in RH12 and SH14.
Overexpression of AcREM14 and AcC3H1 affects the physiological characteristics of kiwifruit
The effects of AcREM14 and AcC3H1 overexpression on the physiological characteristics of kiwifruit in response to bacterial canker disease were further explored. To achieve this, we transiently overexpressed AcC3H1 and AcREM14 genes in ‘Hort16A’ leaves. After 48 h of overexpression, plants were inoculated with Psa. The results indicated increased activities of defense enzymes (POD, SOD, and CAT) in kiwifruit leaf discs (Fig. 7a–c). Moreover, the transient overexpression of these two genes significantly promoted the burst of ROS in kiwifruit leaves (P < 0.05) (Fig. 7d and e). Notably, AcREM14 overexpression had a more significant effect than AcC3H1 on promoting this burst (P < 0.05) (Fig. 7d and e). Additionally, MDA content significantly decreased compared with that in the control (Fig. 7f), suggesting that AcC3H1 and AcREM14 can alleviate membrane damage in kiwifruit leaves and enhance disease resistance. Furthermore, we investigated the expression of defense genes in the SA, JA, and ethylene pathways in leaf discs overexpressing Psa. qRT–PCR analysis revealed varying degrees of defense gene activation (AcPR1a, AcTGA09, and AcNPR1) in the SA pathway (Fig. 7g–j). In contrast, overexpression of AcC3H1 alone may activate EIN3-mediated disease resistance in the ethylene pathway (Fig. 7k), indicating a potential role for AcREM14, primarily in the SA pathway. Remarkably, overexpression of AcREM14 and AcC3H1 resulted in a significant decrease in AcLOX1 gene expression in the JA pathway at 6, 12, and 24 hpi (Fig. 7l). This suppression suggested that the downregulation of AcLOX1 and AcMYC2a gene expression may hinder JA synthesis and subsequently weaken the sensitivity of kiwifruit to Psa.
Figure 7.

Physiological changes in kiwifruit leaves with transient overexpression (AcREM14 and AcC3H1) under Psa infection. a–c Measurement of POD, SOD, and CAT activity. d, e Levels of superoxide anion (O2−) and H2O2. f MDA content. g–i Expression of defense genes AcPR1a (pathogenesis-related protein 1), AcTGA9 (TGACG motif-binding factor), and AcNPR1 (non-expressor of pathogenesis-related gene 1) in the SA signaling pathway, as detected by qRT–PCR. j Relative expression of defense marker genes in the ethylene pathway, AcEIN3 (ethylene-insensitive 3). k, l Relative expression of defense genes AcLOX (lipoxygenase 1) and AcMYC2a (myelocytomatosis proteins 2) in the JA pathway. PC, the positive control, transiently overexpressed the empty vector pCAMBIA1302 in ‘Xiong22’, followed by inoculation with Psa. Similarly, transient overexpression of the empty vector pCAMBIA1302 in kiwifruit ‘Hort16A’ leaves, followed by inoculation with Psa, served as a negative control (NC). OE-AcREM14 refers to transient overexpression of AcREM14 in ‘Hort16A’ leaves, whereas OE-AcC3H1 refers to transient overexpression of AcC3H1 in ‘Hort16A’ leaves. Each experiment was conducted in triplicate. Different letters indicate statistical significance, P < 0.05 (Duncan’s multiple range test).
Discussion
In this study, we evaluated the resistance of 44 F1A. chinensis var. chinensis hybrids. Most A. chinensis var. chinensis lines were highly susceptible to Psa infection, which may be because of their low ploidy (2n). We identified the diploid A. chinensis var. chinensis line RH12, which showed high resistance to kiwifruit bacterial canker disease. Our comparative transcriptome analysis of two F1 hybrids with the same ploidy (2n) derived from the same parental lines but with different Psa resistance (RH12, high resistance; SH14, high susceptibility) largely reduced the contribution of genetic background to phenotypic differences. The utilization of these two lines facilitated our exploration of the genetic and regulatory mechanisms underlying the interactions between kiwifruit and Psa. Thus far, all previous comparative studies have sought to identify kiwifruit defense genes compared with kiwifruit with different genetic backgrounds. For instance A. chinensis var. chinensis ‘Hongyang’ versus Actinidia eriantha var. ‘Huate’ [23], and A. chinensis var. deliciosa and Actinidia arguta [45]. Variations across these genetic backgrounds present significant challenges in determining resistance mechanisms. In this study, we investigated Psa resistance-related traits in two F1 hybrids derived from the same parental lines, which was highly advantageous.
In our study, hormone signaling, flavonoid, and plant–pathogen interaction pathways were highly enriched by KEGG, indicating that these three pathways specifically play a role in the interaction between Psa and kiwifruit. A growing body of evidence suggests that the flavonoid pathway plays a vital role in plant adaptation to abiotic and biotic stress [46]. In the Psa-susceptible SH14 line, PAL-like genes were highly expressed at all four time points. Recent studies have shown that PALs are involved in the interactions between nucleotide-binding and leucine-rich repeat (NLR) proteins, as well as RNA-binding proteins that mediate broad-spectrum resistance in rice [47].
It was previously reported that inhibition of the ethylene and JA pathways occurs early after Psa infection [34], but this was not observed in our study. We believe that the innate (rather than Psa-induced) high expression in kiwifruit contributes more to resistance. In the ethylene pathway, SnRK2.8, a conserved kinase in Arabidopsis, phosphorylates the P. syringae effector protein AvrPtoB, thereby increasing virulence and reducing defenses in Arabidopsis [48]. In contrast, the expression patterns of SnRK-like genes in RH12 and SH14 showed opposite trends. Previous studies have shown that the expression of genes homologous to known resistance genes tends to be positively regulated in response to infection in resistant varieties, whereas these same genes are expressed at lower levels in response to infection in susceptible varieties [22]. In general, DEGs of the SA pathway have been widely reported to be involved in resistance to P. syringae [49]. Our investigation revealed that at 12 hpi with Psa, both JA and SA significantly accumulated in the susceptible varieties SH14 and ‘Hort16A’, whereas no significant change was observed in RH12 and ‘Xiong22’. (Supplementary Data Fig. S2). These findings suggest that JA plays a role in suppressing kiwifruit resistance to Psa. Subsequently, qRT–PCR analysis was conducted to assess the expression of marker genes involved in the JA (AcAOC2, AcMYC2a, AcCOI1, AcAOS1, AcLOX1, and AcPR-4) and SA (AcNPR1, AcTGA04, AcTGA09, and AcPR1a) pathways (Supplementary Data Fig. S12). Remarkably, the results were consistent with the trends observed in the transcriptome analysis. Furthermore, we identified a positive correlation between SA and JA synthesis and specific genes in kiwifruit. For instance, AcPR1a was upregulated in both RH12 and SH14 but showed a higher expression trend in SH14, which is consistent with the higher content of SA in SH14. Upregulation of the marker gene AcMYC2a in the JA synthesis pathway significantly promoted JA synthesis in SH14.
WGCNA has been frequently used to study plant interactions with pathogenic bacteria [50–52]. Wu et al. [53] constructed a co-expression network by WGCNA, which enabled the identification of a total of 5010 DEGs in 15 co-expression gene modules, and 4 modules showed significant association with smut resistance. The researchers identified 38 hub genes by calculating their connectivity within the corresponding network [50]. Here, we used WGCNA to correlate the expression profiles of RH12 and SH14 with the virulence phenotype and identified four highly correlated modules. According to REVIGO redundancy removal analysis, lipid metabolic processes are associated with disease resistance in kiwifruit. Our results support the conclusion that kiwifruit bacterial canker is associated with membrane lipid damage during Psa infection and that the lipid transfer protein StLTP10, a disease-resistance protein, enhances potato resistance to late blight fungus [44]. Using WGCNA, we narrowed down the number of critical hub genes involved in plant–pathogen interactions. By constructing a co-expression network, we identified several genes related to redox in hub genes with high connectivity (top 5%). Pathogen infection can cause plant lipid peroxidation and accumulation of ROS owing to the attack on membrane unsaturated fatty acids, which results in MDA accumulation. Accumulation of H2O2 can also trigger an increase in the concentration of intracellular calcium. Furthermore, the study observed no significant differences in the electrolyte leakage test between the resistant lines (‘Xiong22’ and RH12) and susceptible lines (‘Hort16A’ and SH14). This could be attributed to the relatively intact cell membranes in RH12 and SH14 (Fig. 2f), resulting in less leakage of intracellular molecules. Additionally, it may be associated with other potential disease resistance factors. For example, the activation of the immune genes AcPR1a and AcPR-4 (Supplementary Data Fig. S12) may have a more significant impact on determining resistance. These genes are responsible for initiating plant defense responses against pathogens. The synthesis of defense compounds, including MDA, SOD, H2O2, and GSH (Supplementary Data Fig. S2), may also have a significant influence on disease resistance. These compounds are involved in various defense mechanisms, such as the inhibition of pathogen growth and mitigation of oxidative stress induced by Psa.
TFs have been reported to play crucial roles in regulating defense-related signaling pathways in response to pathogen infection [54]. It has been shown that the MYB, NAC, bHLH, and C2H2 TFs are indispensable for plant defense against P. syringae [55]. Our study showed that the six hub TFs (top 5%) have several cis-elements that respond to signals such as low temperature, hormones, and drought stress, indicating the importance of TFs involved in canker resistance. We identified AcAS1, a typical R2R3-MYB TF in the MEturquoise module, which was induced by Psa in the susceptible line SH14 (Supplementary Data Table S8). Similar to AcAS1, the other two TFs, AcC3H1 and AcZFP1, belong to the zinc finger (CCCH-type) family of proteins. This study found that C3H-type zinc finger TFs can enhance plant resistance to pathogens by regulating the antioxidant response of plants. In Arabidopsis, the homologous genes of AcC3H1, AtTZF1 (Tandem CCCH Zinc Finger 1), AtTZF2 (Tandem CCCH Zinc Finger 2), and AtTZF3 (Tandem CCCH Zinc Finger 3) (Fig. 6d) participate in the ABA/JA signaling pathway and regulate abiotic stress responses such as cold and salt stress [56–58]. However, there are currently no reports on the role of AcC3H1 in disease resistance. Our study demonstrated, for the first time, that AcC3H1 plays a role in resistance to bacterial canker disease in kiwifruit. We also found that AcC3H1 is highly expressed in HR materials of A. chinensis and is highly associated with proteins such as ‘calcium-binding protein’ (Actinidia29005.t1) and ‘plant intracellular Ras-group-related LRR protein 7’ (Actinidia35026.t1) in the CytoHub network, which may be key to its involvement in disease resistance. Our hypothesis was also confirmed by transient overexpression experiments, which showed that AcC3H1 and AcREM14 (plant-specific B3 DNA-binding domain proteins) could enhance kiwifruit resistance to Psa.
Comparing the sequence alignment of AcC3H1 and AcREM14 in RH12 and SH14, differences were found in both the protein sequence and the promoter region, with significant variations mainly observed in the promoter region. Variations (point mutations and deletions) in the base positions of the promoter region in SH14 and RH12 may be key factors leading to expression discrepancies in these two TFs in response to Psa infection, particularly in resistant and susceptible cultivars, where the genes are expressed at higher levels in resistant cultivars. Additionally, among these two factors, only C3H1 has highly conserved homologous proteins in other species, whereas REM14 appears to have evolved in kiwifruit, displaying significant differences from other known homologous proteins. Further exploration is required to determine whether kiwifruit-specific AcREM14 has other functions. Physiological and qRT–PCR analyses revealed that the overexpression of these two genes induced a significant surge in ROS in kiwifruit and concurrently upregulated gene expression in the SA pathway. Therefore, we deduced that these two TFs play pivotal roles in modulating the SA pathway. However, a more detailed understanding of the precise mechanisms underlying disease resistance pathways requires further investigation using molecular techniques. With emerging genome-editing technologies, it will be of great interest to verify the function of these TFs in the future.
Conclusions
In this study we selected two kiwifruit F1 progenies that displayed differing susceptibilities to Psa infection and performed comparative transcriptome studies of the two lines to identify the traits responsible for Psa resistance. Our results showed that 6 hpi was the critical time point for Psa infection, and both resistant and sensitive kiwifruit lines mounted a comprehensive immune response to Psa infection. To decipher the correlation between the groups of DEGs and several phenotypes related to pathogen infection and resistance, we applied WGCN and REVIGO analyses to unravel the core genes related to kiwifruit canker susceptibility. Strikingly, we found that three core TF genes (AcC3H1, AcZML1, and AcREM14) were induced by Psa and showed a high expression trend in the four disease-resistant varieties. Finally, we validated that AcREM14 and AcC3H1 could enhance kiwifruit resistance to Psa through overexpression experiments. Our study provides insights into the molecular mechanisms underlying A. var. chinensis resistance to Psa infection and support kiwifruit breeding research.
Materials and methods
Plant materials and leaf disc assay
Kiwifruits were routinely grown in a greenhouse (34°15′49″ N, 108°3′47″ E) at Northwest A&F University. For leaf disc assays, Psa M228 was cultured in Luria–Bertani (LB) medium at 25°C for 12–16 h until the OD600 reached 0.6. To obtain kiwifruit leaf discs, fresh kiwifruit leaves of similar size and shape were obtained, rinsed with sterile water, and soaked in 70% ethanol for 30 s. Next, the leaves were submerged in 2% sodium hypochlorite solution for 3 min and 70% ethanol for 20 s. Finally, the leaves were rinsed four times with sterile water and dried by tissue blotting. For each test, 100 leaf discs were excised using a 10-mm diameter cork borer. To establish Psa infection, leaf discs were placed in a test tube containing 1 × 10⁵ cells/ml of Psa [suspended in phosphate-buffered saline (PBS) buffer, pH 6.8]. The tubes were then vacuumed for 5 min in a desiccator three times until the floating leaves sank to the bottom of the tube. After vacuuming,16 leaf discs were placed on a water agar plate and incubated at 16°C with a 16-h light/8-h dark photoperiod for 0, 6, 12, or 24 h, depending on the time point. Freshly completed Psa-inoculated kiwifruit leaf discs were sampled, quickly frozen in liquid nitrogen, and marked at 0 hpi. Three biological replicates (three leaf disc plates) were assayed for each kiwifruit line at each time point. Infection symptoms on leaf discs were normally observed 5 dpi. For molecular analysis, the samples were quickly frozen in liquid nitrogen after harvesting and stored at −80°C for future use. To quantify the number of Psa-infected leaf discs, 0.2-g leaf discs at different time points were transferred to tubes containing 2.0 ml 0.9% NaCl and gently ground with quartz sand. Subsequently, the suspensions were subjected to a series of dilutions (100, 10−1, 10−2, and 10−3), and 100 μl of each sample was plated onto the LB medium and cultured at 28°C for 72 h. After colonies appeared, their numbers were counted. Assays for each infected sample were repeated at least three times.
Leaf vein assay
Leaf vein assays were performed according to a previously described method [59], with slight modifications. Briefly, kiwifruit leaves of similar sizes were rinsed with sterile water, soaked in 0.6% sodium hypochlorite solution for 5 min, and rinsed three times with sterile water. After drying by tissue blotting, petiole bases were wrapped in absorbent cotton. Wounds were punctured at the main vein, 1–2 cm from the petiole, and 10 μl of eGFP-labeled M228 (grown at OD600 = 0.1, and diluted to 1 × 10⁸ cells/ml) bacterial suspension was dropped onto the wound. After inoculation, the leaves were incubated under the following conditions: photoperiod light/dark 16/8 h; day and night temperature 16/4°C; and relative humidity 95%. The areas of pathogen expansion were visualized and measured by fluorescence stereomicroscopy (MZ10F, Leica, Germany).
Transmission electron microscopy
The samples for transmission electron microscopy (TEM) were prepared as previously described [60]. Briefly, kiwifruit leaf discs at 5 dpi were excised into 1 mm × 1 mm × 3 mm pieces and fixed in 5.0 ml 4% (v/v) glutaraldehyde solution at 4°C overnight. Next, the leaf pieces were rinsed with PBS (pH 6.8) for 2 h, dehydrated with different concentrations of ethanol, and dried in a carbon dioxide critical-point dryer (Emitech, UK). Ultrathin sections (85 nm thick) were prepared for TEM using a UC7 ultra-thin sectioning machine (Leica, Germany) and placed on a copper mesh. After double staining with uranyl acetate and lead citrate, the samples were imaged using an HT-7700 transmission electron microscope (Hitachi, Japan) at 80.0 kV.
RNA isolation and sequencing
Total RNA was extracted using a Trelief RNAprep Pure Plant Kit (TSP412, Tsingke), according to the manufacturer’s instructions. RNA quality was examined using 1.0% agarose gel and NanoDrop. RNA-seq libraries were prepared by Biomarker Biotechnology (Beijing, China). cDNA synthesis was performed using Phusion DNA polymerase, and 450-bp target fragments were selected for the library. An Illumina RNA library preparation kit was used for end repair, poly(A) addition, and adaptor ligation. Libraries were sequenced on an Illumina NovaSeq 6000 sequencing platform to obtain 150 bp paired-end reads. Read quality was checked using a Qsep400 Bio-Fragment Analyzer. See Supplementary Data Table S1 for the RNA-seq metrics.
Differentially expressed gene and Gene Ontology enrichment analysis
To align RNA-seq reads to the genomes, the quality of the raw reads was first assessed using Trimmomatic v.0.39 [61] and fastp [62]. The filtered reads were aligned to the kiwifruit reference genome (http://kiwifruitgenome.org/) using HISAT2 v2.1.0 [63]. Transcript assembly was conducted using StringTie v1.3.3b [50] and read counts were calculated using the built-in prepDE.py script. The DEseq2 package v1.16.1 [64], was used to screen for transcripts with absolute expression fold-changes >2 and P < 0.05. For GO enrichment analysis, coding sequences were annotated using Blast2GO [65] based on the Swiss-Prot database (https://www.expasy.org/resources/uniprotkb-swiss-prot), and the GO terms of differentially enriched genes were determined using hypergeometric distribution. To determine the signaling pathways related to the DEGs, KEGG pathway enrichment analysis was performed using EdTBtools [66].
Measurement of disease index
Free PRO content was measured using sulfosalicylic acid extraction and the acidic ninhydrin staining method, according to a previously described method [67]. SOD activity, H2O2 concentration, and GSH content were measured using SOD (G0101F), H2O2 (G0112F), and GSH (G0206F) assay kits purchased from Suzhou Grace Biotechnology (Suzhou, China). The CAT content was determined using a UV spectrophotometric method [68]. MDA content was quantified through a thiobarbituric acid method [69]. Hydroxyl radicals were quantified using the plant hydroxyl radical (OH-)ELISA kit (Yaji, China, 7440-60-0). Free JA and SA were analyzed by high-performance liquid chromatography-mass spectrometry (HPLC–MS/MS) [70]. Each experiment was repeated five times. GraphPad Prism 8.0 was used for statistical and graphical analyses. The disease index (D) was calculated as 100 × ∑ (number of leaf discs at all levels × relative grade value)/(total number of leaf discs × highest-grade value).
Disease susceptibility was defined by the D scores: high resistance (HR), D < 10; resistance (R), 10 ≤ D < 25; tolerance (T), 25 ≤ D < 40; susceptibility (S): 40 ≤ D < 65; and high susceptibility (HS): D ≥ 65.
Weighted gene co-expression network analysis
WGCNA was performed with the WGCNA R package (v1.70, https://cran.r-project.org/web/packages/WGCNA/index.html). A standardized gene expression matrix was used as the input. After calculating the variation in the expression of each gene, 30 344 DEGs with the most marked variation were selected for WGCNA. After threshold screening, β = 16 was chosen as the suitable value to perform power processing on the original scale-dependent matrix to obtain a scale-free adjacency matrix. To better evaluate the correlation between gene expression patterns, the adjacency matrix was further transformed into a topological overlap matrix (TOM), and the topological dissimilarity matrix (dissTOM = 1 − TOM) was used for gene clustering and module division using the dynamic shear algorithm. The minimum number of genes in the module was 30 (minModuleSize = 30), the threshold for merging similar modules was 0.25 (cutHeight = 0.25), and the network type was unsigned. To identify modules specific for disease resistance, the correlation coefficient r and corresponding P values between the module feature vectors of each module and different disease resistance traits were calculated. Modules with a positive correlation (r > 0) and high significance (P < 0.01) were selected for further analysis. The network was visualized using Cytoscape v3.6.1.
Transient overexpression in kiwifruit leaf and quantitative RT–PCR analysis
The total RNA samples used for RNA-seq were subjected to qRT–PCR. Two micrograms of total RNA was used for reverse transcription, and first-strand cDNA was synthesized using a RevertAid First Strand cDNA Synthesis Kit (Thermo Fisher Scientific, K1622). qPCR was conducted using the Chamo Universal SYBR qPCR Master Mix (Vazyme Biotech, China) and run on a LightCycler 480 II quantitative instrument (Roche, Switzerland), according to the manufacturer’s instructions. Kiwifruit β-actin (GenBank ID ABR45727.1) was used as the reference gene, and relative gene expression was measured by the 2−ΔΔCt method. Primers used for qPCR are listed in Supplementary Data Table S9.
This study was based on a previous study [71] and we selected leaves of the susceptible kiwifruit A. chinensis var. chinensis ‘Hort16A’ with the same growth status. Next, the fusion gene carrying Agrobacterium GV3101 was overexpressed in kiwifruit leaf discs using the vacuum infiltration method. Leaf discs were placed on 0.7% water agar and cultured in a light incubator (16 h light/8 h dark, 20°C). After 48 h of culture, the samples were subjected to qRT–PCR for gene expression analysis. The leaf discs were inoculated with Psa (M228) using the vacuum infiltration method and placed in an incubator (16°C). After 5 days, photographs were taken to observe the phenotype, and ImageJ (V1.8.0) was used to calculate the disease index. The number of bacteria colonizing the leaf discs was counted using the spread-plate method. Graphpad Prism (V9.2) was used for data visualization [71]. The experiments were independently replicated at least three times, and the data are presented as the mean ± standard deviation of three independent experiments. The fusion expression vectors used to construct primers are listed in Supplementary Data Table S10.
Supplementary Material
Acknowledgements
This work was financially supported by the National Key R&D Program of China (2022YFD1400200), the Special Support Plan for High-level Talent of Shaanxi Province (to L.H.), and the Natural Science Foundation of China (grant 32102174 awarded to W.L.).
Contributor Information
Chao Zhao, State Key Laboratory of Crop Stress Biology for Arid Areas, College of Plant Protection, Northwest A&F University, Xianyang 712100, China.
Wei Liu, State Key Laboratory of Crop Stress Biology for Arid Areas, College of Plant Protection, Northwest A&F University, Xianyang 712100, China.
Yali Zhang, State Key Laboratory of Crop Stress Biology for Arid Areas, College of Plant Protection, Northwest A&F University, Xianyang 712100, China.
Yuanzhe Li, State Key Laboratory of Crop Stress Biology for Arid Areas, College of Plant Protection, Northwest A&F University, Xianyang 712100, China.
Chao Ma, State Key Laboratory of Crop Stress Biology for Arid Areas, College of Plant Protection, Northwest A&F University, Xianyang 712100, China.
Runze Tian, State Key Laboratory of Crop Stress Biology for Arid Areas, College of Plant Protection, Northwest A&F University, Xianyang 712100, China.
Rui Li, State Key Laboratory of Crop Stress Biology for Arid Areas, College of Plant Protection, Northwest A&F University, Xianyang 712100, China.
Mingjun Li, State Key Laboratory of Crop Stress Biology in Arid Areas, College of Horticulture, Northwest A&F University, Yangling, Shaanxi 712100, China.
Lili Huang, State Key Laboratory of Crop Stress Biology for Arid Areas, College of Plant Protection, Northwest A&F University, Xianyang 712100, China.
Author contributions.
C.Z. and W.L. conceived the study. C.Z. and Y.Z.L. performed the experiments. C.M. collected samples. Y.L.Z., R.L., and R.Z.T. conducted data analysis. W.L. and C.Z. wrote the manuscript with contributions from all authors. All authors have read and agreed to the published version of the manuscript.
Data availability
The raw RNA-Seqdata that support the findings of this study are openly available in NCBI at [https://www.ncbinlm.nih.gov/sra/PRINA1054973], reference number [PRJNA1054973].
Conflict of interest
The authors declare no conflict of interest.
Supplementary data
Supplementary data is available at Horticulture Research online.
References
- 1. Conner TS, Fletcher B, Haszard J. et al. KiwiC for vitality: results of a randomized placebo-controlled trial testing the effects of kiwifruit or vitamin C tablets on vitality in adults with low vitamin C levels. Nutrients. 2020;12:2898. [DOI] [PMC free article] [PubMed] [Google Scholar]
- 2. Ferguson AR, Huang H. Genetic resources of kiwifruit: domestication and breeding. Hortic Rev. 2007;33:1–121 [Google Scholar]
- 3. Dressler S, Bayer C. Actinidiaceae. In: Kubitzki K, ed. The Families and Genera of Vascular Plants. Volume VI. Dicotyledons: Celastrales, Oxalidales, Rosales, Cornales, Ericales. Berlin: Springer, 2004,14–9 [Google Scholar]
- 4. Koh Y, Kim G, Jung J. et al. Outbreak of bacterial canker on Hort16A (Actinidia chinensis Planchon) caused by Pseudomonas syringae pv. actinidiae in Korea. N Z J Crop Hortic Sci. 2010;38:275–82 [Google Scholar]
- 5. Donati I, Cellini A, Sangiorgio D. et al. Pseudomonas syringae pv. actinidiae: ecology, infection dynamics and disease epidemiology. Microb Ecol. 2020;80:81–102 [DOI] [PMC free article] [PubMed] [Google Scholar]
- 6. Bastas KK, Karakaya A. First report of bacterial canker of kiwifruit caused by Pseudomonas syringae pv. actinidiae in Turkey. Plant Dis. 2012;96:452. [DOI] [PubMed] [Google Scholar]
- 7. Vanneste JL. The scientific, economic, and social impacts of the New Zealand outbreak of bacterial canker of kiwifruit (Pseudomonas syringae pv. actinidiae). Annu Rev Phytopathol. 2017;55:377–99 [DOI] [PubMed] [Google Scholar]
- 8. Takikawa Y, Serizawa S, Ichikawa T. et al. Pseudomonas syringae pv. Actinidiae pv. nov. Japanese J Phytopathol. 1989;55:437–44 [Google Scholar]
- 9. Renzi M, Copini P, Taddei AR. et al. Bacterial canker on kiwifruit in Italy: anatomical changes in the wood and in the primary infection sites. Phytopathology. 2012;102:827–40 [DOI] [PubMed] [Google Scholar]
- 10. Abelleira A, López MM, Peñalver J. et al. First report of bacterial canker of kiwifruit caused by Pseudomonas syringae pv. actinidiae in Spain. Plant Dis. 2011;95:1583. [DOI] [PubMed] [Google Scholar]
- 11. Wang Z, Tang X, Liu S. Identification of the pathogenic bacterium for bacterial canker on Actinidia in Sichuan. J Southwest Agric Univ. 1992;6:500–3 [Google Scholar]
- 12. Pereira C, Costa P, Pinheiro L. et al. Kiwifruit bacterial canker: an integrative view focused on biocontrol strategies. Planta. 2021;253:49. [DOI] [PubMed] [Google Scholar]
- 13. Wang FM, Li JW, Ye KY. et al. Preliminary report on the improved resistance towards Pseudomonas syringae pv. actinidiae of cultivated kiwifruit (Actinidia chinensis) when grafted onto wild Actinidia guilinensis rootstock in vitro. J Plant Pathol. 2021;103:51–4 [Google Scholar]
- 14. Chisholm ST, Coaker G, Day B. et al. Host-microbe interactions: shaping the evolution of the plant immune response. Cell. 2006;124:803–14 [DOI] [PubMed] [Google Scholar]
- 15. Jones JD, Dangl JL. The plant immune system. Nature. 2006;444:323–9 [DOI] [PubMed] [Google Scholar]
- 16. Saijo Y, Loo EP, Yasuda S. Pattern recognition receptors and signaling in plant-microbe interactions. Plant J. 2018;93:592–613 [DOI] [PubMed] [Google Scholar]
- 17. Ngou BPM, Jones JDG, Ding P. Plant immune networks. Trends Plant Sci. 2022;27:255–73 [DOI] [PubMed] [Google Scholar]
- 18. Tahir J, Hoyte S, Bassett H. et al. Multiple quantitative trait loci contribute to resistance to bacterial canker incited by Pseudomonas syringae pv. actinidiae in kiwifruit (Actinidia chinensis). Hortic Res. 2019;6:101. [DOI] [PMC free article] [PubMed] [Google Scholar]
- 19. Wang Z, Liu Y, Li L. et al. Whole transcriptome sequencing of Pseudomonas syringae pv. actinidiae infected kiwifruit plants reveals species-specific interaction between long non-coding RNA and coding genes. Sci Rep. 2017;7:4910. [DOI] [PMC free article] [PubMed] [Google Scholar]
- 20. Vicent A, Aurelio G-C. Metabolomics of disease resistance in crops. Curr Issues Mol Biol. 2016;19:13–30 [PubMed] [Google Scholar]
- 21. Verma V, Ravindran P, Kumar PP. Plant hormone-mediated regulation of stress responses. BMC Plant Biol. 2016;16:86. [DOI] [PMC free article] [PubMed] [Google Scholar]
- 22. Wang X, Li Y, Liu Y. et al. Transcriptomic and proteomic profiling reveal the key role of AcMYB16 in the response of Pseudomonas syringae pv. actinidiae in kiwifruit. Front. Plant Sci. 2021;12:756330 [DOI] [PMC free article] [PubMed] [Google Scholar]
- 23. Song Y, Sun L, Lin M. et al. Comparative transcriptome analysis of resistant and susceptible kiwifruits in response to Pseudomonas syringae pv. actinidiae during early infection. PLoS One. 2019;14:e0211913 [DOI] [PMC free article] [PubMed] [Google Scholar]
- 24. Li Y, Wang X, Zeng Y. et al. Metabolic profiling reveals local and systemic responses of kiwifruit to Pseudomonas syringae pv. actinidiae. Plant. Direct. 2020;4:e00297 [DOI] [PMC free article] [PubMed] [Google Scholar]
- 25. Cheng X, Cao J, Gao C. et al. Identification of the wheat C3H gene family and expression analysis of candidates associated with seed dormancy and germination. Plant Physiol Biochem. 2020;156:524–37 [DOI] [PubMed] [Google Scholar]
- 26. Qhang Q, Zhang W-J, Yin Z-G. et al. Genome- and transcriptome-wide identification of C3Hs in common bean (Phaseolus vulgaris L.) and structural and expression-based analyses of their functions during the sprout stage under salt-stress conditions. Front Genet. 2020;11:564607 [DOI] [PMC free article] [PubMed] [Google Scholar]
- 27. Romanel EAC, Schrago CG, Couñago RM. et al. Evolution of the B3 DNA binding superfamily: new insights into REM family gene diversification. PLoS One. 2009;4:e5791 [DOI] [PMC free article] [PubMed] [Google Scholar]
- 28. Swaminathan K, Peterson K, Jack T. The plant B3 superfamily. Trends Plant Sci. 2008;13:647–55 [DOI] [PubMed] [Google Scholar]
- 29. Luo Y-X, Chen S-K, Wang P-D. et al. Genome-wide analysis of the RAV gene family in wheat and functional identification of TaRAV1 in salt stress. Int J Mol Sci. 2022;23:8834. [DOI] [PMC free article] [PubMed] [Google Scholar]
- 30. Zhang Q, Zhang J, Wei F. et al. The CCCH-type zinc-finger protein GhC3H20 enhances salt stress tolerance in Arabidopsis thaliana and cotton through ABA signal transduction pathway. Int J Mol Sci. 2023;24:5057. [DOI] [PMC free article] [PubMed] [Google Scholar]
- 31. Hoon SK, Chul LS, Won JH. et al. Expression and functional roles of the pepper pathogen-induced transcription factor RAV1 in bacterial disease resistance, and drought and salt stress tolerance. Plant Mol Biol. 2006;61:897–915 [DOI] [PubMed] [Google Scholar]
- 32. Cui L-H, Gao X-N, Zhang D. et al. Screening of kiwifruit bacterial canker resistance resources in Xiangxi area and its resistance mechanism. Plant Prot. 2019;45:158–64 [Google Scholar]
- 33. Xiong Q, Yang J, Ni S. Microbiome-Mediated Protection against Pathogens in Woody Plants. Int J Mol Sci. 2023;24:16118. [DOI] [PMC free article] [PubMed] [Google Scholar]
- 34. Nunes da Silva M, Vasconcelos MW, Gaspar M. et al. Early pathogen recognition and antioxidant system activation contributes to Actinidia arguta tolerance against Pseudomonas syringae pathovars actinidiae and actinidifoliorum. Front. Plant Sci. 2020;11:1022. [DOI] [PMC free article] [PubMed] [Google Scholar]
- 35. Gill SS, Tuteja N. Reactive oxygen species and antioxidant machinery in abiotic stress tolerance in crop plants. Plant Physiol Biochem. 2010;48:909–30 [DOI] [PubMed] [Google Scholar]
- 36. McAtee PA, Brian L, Curran B. et al. Re-programming of Pseudomonas syringae pv. actinidiae gene expression during early stages of infection of kiwifruit. BMC Genomics. 2018;19:822. [DOI] [PMC free article] [PubMed] [Google Scholar]
- 37. Robert-Seilaniantz A, Grant M, Jones JD. Hormone crosstalk in plant disease and defense: more than just jasmonate-salicylate antagonism. Annu Rev Phytopathol. 2011;49:317–43 [DOI] [PubMed] [Google Scholar]
- 38. Fraser CM, Chapple C. The phenylpropanoid pathway in Arabidopsis. The Arabidopsis Book. 2011;9:e0152 [DOI] [PMC free article] [PubMed] [Google Scholar]
- 39. Tu Y, Liu F, Guo DD. et al. Molecular characterization of flavanone 3-hydroxylase gene and flavonoid accumulation in two chemotyped safflower lines in response to methyl jasmonate stimulation. BMC Plant Biol. 2016;16:132. [DOI] [PMC free article] [PubMed] [Google Scholar]
- 40. Langfelder P, Horvath S. WGCNA: an R package for weighted correlation network analysis. BMC Bioinformatics. 2008;9:559. [DOI] [PMC free article] [PubMed] [Google Scholar]
- 41. Zhang B, Horvath S. A general framework for weighted gene co-expression network analysis. Stat Appl Genet Mol Biol. 2005;4:17. [DOI] [PubMed] [Google Scholar]
- 42. Ketudat CJR, Esen A. β-Glucosidases. Cell Mol Life Sci. 2010;67:3389–405 [DOI] [PMC free article] [PubMed] [Google Scholar]
- 43. Thorlby G, Fourrier N, Warren G. The SENSITIVE TO FREEZING2 gene, required for FREEZING tolerance in Arabidopsis thaliana, encodes a β-glucosidase. Plant Cell. 2004;16:2192–203 [DOI] [PMC free article] [PubMed] [Google Scholar]
- 44. Amorim LLB, Santos R, Neto J. et al. Transcription factors involved in plant resistance to pathogens. Curr Protein Pept Sci. 2017;18:335–51 [DOI] [PubMed] [Google Scholar]
- 45. Nunes da Silva M, Carvalho SMP, Rodrigues AM. et al. Defence-related pathways, phytohormones and primary metabolism are key players in kiwifruit plant tolerance to Pseudomonas syringae pv. actinidiae. Plant Cell Environ. 2022;45:528–41 [DOI] [PubMed] [Google Scholar]
- 46. Bag S, Mondal A, Majumder A. et al. Flavonoid mediated selective cross-talk between plants and beneficial soil microbiome. Phytochem Rev. 2022;21:1739–60 [DOI] [PMC free article] [PubMed] [Google Scholar]
- 47. Wang R, Wang GL, Ning Y. PALs: emerging key players in broad-spectrum disease resistance. Trends Plant Sci. 2019;24:785–7 [DOI] [PubMed] [Google Scholar]
- 48. Lei L, Stevens DM, Coaker G. Phosphorylation of the Pseudomonas effector AvrPtoB by Arabidopsis SnRK2.8 is required for bacterial virulence. Mol Plant. 2020;13:1513–22 [DOI] [PMC free article] [PubMed] [Google Scholar]
- 49. Chen J, Clinton M, Qi G. et al. Reprogramming and remodeling: transcriptional and epigenetic regulation of salicylic acid-mediated plant defense. J Exp Bot. 2020;71:5256–68 [DOI] [PubMed] [Google Scholar]
- 50. Naik S, Mohammed A. Coexpression network analysis of human candida infection reveals key modules and hub genes responsible for host-pathogen interactions. Front Genet. 2022;13:917636 [DOI] [PMC free article] [PubMed] [Google Scholar]
- 51. He W, Zhu Y, Leng Y. et al. Transcriptomic analysis reveals candidate genes responding maize gray leaf spot caused by Cercospora zeina. Plants (Basel). 2021;10:2257. [DOI] [PMC free article] [PubMed] [Google Scholar]
- 52. Wang C, Gao H, Chu Z. et al. A nonspecific lipid transfer protein, StLTP10, mediates resistance to Phytophthora infestans in potato. Mol Plant Pathol. 2021;22:48–63 [DOI] [PMC free article] [PubMed] [Google Scholar]
- 53. Wu Q, Pan YB, Su Y. et al. WGCNA identifies a comprehensive and dynamic gene co-expression network that associates with smut resistance in sugarcane. Int J Mol Sci. 2022;23:10770. [DOI] [PMC free article] [PubMed] [Google Scholar]
- 54. Gao Y, Li Z, Yang C. et al. Pseudomonas syringae activates ZAT18 to inhibit salicylic acid accumulation by repressing EDS1 transcription for bacterial infection. New Phytol. 2022;233:1274–88 [DOI] [PubMed] [Google Scholar]
- 55. Sun Q, Lu H, Zhang Q. et al. Transcriptome sequencing of wild soybean revealed gene expression dynamics under low nitrogen stress. J Appl Genet. 2021;62:389–404 [DOI] [PubMed] [Google Scholar]
- 56. Han G, Wang M, Yuan F. et al. The CCCH zinc finger protein gene AtZFP1 improves salt resistance in Arabidopsis thaliana. Plant Mol Biol. 2014;86:237–53 [DOI] [PubMed] [Google Scholar]
- 57. Lee SJ, Jung HJ, Kang H. et al. Arabidopsis zinc finger proteins AtC3H49/AtTZF3 and AtC3H20/AtTZF2 are involved in ABA and JA responses. Plant Cell Physiol. 2012;53:673–86 [DOI] [PubMed] [Google Scholar]
- 58. Costa-Broseta Á, Perea-Resa C, Castillo MC. et al. Nitric oxide deficiency decreases C-repeat binding factor-dependent and -independent induction of cold acclimation. J Exp Bot. 2019;70:3283–96 [DOI] [PMC free article] [PubMed] [Google Scholar]
- 59. Wang N, Han N, Tian R. et al. Role of the type VI secretion system in the pathogenicity of Pseudomonas syringae pv. actinidiae, the causative agent of kiwifruit bacterial canker. Front Microbiol. 2021;12:627785 [DOI] [PMC free article] [PubMed] [Google Scholar]
- 60. Kang Z, Huang L, Buchenauer H. Subcellular localization of chitinase and β-1,3-glucanase in compatible and incompatible interactions between wheat and Puccinia striiformis f sp. tritici. J Plant Dis Protection. 2003;110:170–83 [Google Scholar]
- 61. Bolger AM, Lohse M, Usadel B. Trimmomatic: a flexible trimmer for Illumina sequence data. Bioinformatics. 2014;30:2114–20 [DOI] [PMC free article] [PubMed] [Google Scholar]
- 62. Chen S, Zhou Y, Chen Y. et al. Fastp: an ultra-fast all-in-one FASTQ preprocessor. Bioinformatics. 2018;34:i884–90 [DOI] [PMC free article] [PubMed] [Google Scholar]
- 63. Nurmberg PL, Knox KA, Yun BW. et al. The developmental selector AS1 is an evolutionarily conserved regulator of the plant immune response. Proc Natl Acad Sci USA. 2007;104:18795–800 [DOI] [PMC free article] [PubMed] [Google Scholar]
- 64. Love MI, Huber W, Anders S. Moderated estimation of fold change and dispersion for RNA-seq data with DESeq2. Genome Biol. 2014;15:550. [DOI] [PMC free article] [PubMed] [Google Scholar]
- 65. Conesa A, Götz S, García-Gómez JM. et al. Blast2GO: a universal tool for annotation, visualization and analysis in functional genomics research. Bioinformatics. 2005;21:3674–6 [DOI] [PubMed] [Google Scholar]
- 66. Chen C, Chen H, Zhang Y. et al. TBtools: an integrative toolkit developed for interactive analyses of big biological data. Mol Plant. 2020;13:1194–202 [DOI] [PubMed] [Google Scholar]
- 67. Edit A, Cecile H-C, László E. et al. Methods for determination of proline in plants. Methods Mol Biol. 2010;639:317–31 [DOI] [PubMed] [Google Scholar]
- 68. Hadwan MH. Simple spectrophotometric assay for measuring catalase activity in biological tissues. BMC Biochem. 2018;19:7. [DOI] [PMC free article] [PubMed] [Google Scholar]
- 69. Schmedes A, Hølmer G. A new thiobarbituric acid (TBA) method for determining free malondialdehyde (MDA) and hydroperoxides selectively as a measure of lipid peroxidation. J Am Oil Chem Soc. 1989;66:813–7 [Google Scholar]
- 70. Sá M, Ferreira JP, Queiroz VT. et al. A liquid chromatography/electrospray ionisation tandem mass spectrometry method for the simultaneous quantification of salicylic, jasmonic and abscisic acids in Coffea arabica leaves. J Sci Food Agric. 2014;94:529–36 [DOI] [PubMed] [Google Scholar]
- 71. Liu W, Zhao C, Liu L. et al. Genome-wide identification of the TGA gene family in kiwifruit (Actinidia chinensis spp.) and revealing its roles in response to Pseudomonas syringae pv. actinidiae (Psa) infection. Int J Biol Macromol. 2022;222:101–13 [DOI] [PubMed] [Google Scholar]
Associated Data
This section collects any data citations, data availability statements, or supplementary materials included in this article.
Supplementary Materials
Data Availability Statement
The raw RNA-Seqdata that support the findings of this study are openly available in NCBI at [https://www.ncbinlm.nih.gov/sra/PRINA1054973], reference number [PRJNA1054973].