

Summary
Background
Measurement of the global burden of disease with disability-adjusted life-years (DALYs) requires disability weights that quantify health losses for all non-fatal consequences of disease and injury. There has been extensive debate about a range of conceptual and methodological issues concerning the definition and measurement of these weights. Our primary objective was a comprehensive re-estimation of disability weights for the Global Burden of Disease Study 2010 through a large-scale empirical investigation in which judgments about health losses associated with many causes of disease and injury were elicited from the general public in diverse communities through a new, standardised approach.
Methods
We surveyed respondents in two ways: household surveys of adults aged 18 years or older (face-to-face interviews in Bangladesh, Indonesia, Peru, and Tanzania; telephone interviews in the USA) between Oct 28, 2009, and June 23, 2010; and an open-access web-based survey between July 26, 2010, and May 16, 2011. The surveys used paired comparison questions, in which respondents considered two hypothetical individuals with different, randomly selected health states and indicated which person they regarded as healthier. The web survey added questions about population health equivalence, which compared the overall health benefits of different life-saving or disease-prevention programmes. We analysed paired comparison responses with probit regression analysis on all 220 unique states in the study. We used results from the population health equivalence responses to anchor the results from the paired comparisons on the disability weight scale from 0 (implying no loss of health) to 1 (implying a health loss equivalent to death). Additionally, we compared new disability weights with those used in WHO’s most recent update of the Global Burden of Disease Study for 2004.
Findings
13 902 individuals participated in household surveys and 16 328 in the web survey. Analysis of paired comparison responses indicated a high degree of consistency across surveys: correlations between individual survey results and results from analysis of the pooled dataset were 0·9 or higher in all surveys except in Bangladesh (r=0·75). Most of the 220 disability weights were located on the mild end of the severity scale, with 58 (26%) having weights below 0·05. Five (11%) states had weights below 0·01, such as mild anaemia, mild hearing or vision loss, and secondary infertility. The health states with the highest disability weights were acute schizophrenia (0·76) and severe multiple sclerosis (0·71). We identified a broad pattern of agreement between the old and new weights (r=0·70), particularly in the moderate-to-severe range. However, in the mild range below 0·2, many states had significantly lower weights in our study than previously.
Interpretation
This study represents the most extensive empirical effort as yet to measure disability weights. By contrast with the popular hypothesis that disability assessments vary widely across samples with different cultural environments, we have reported strong evidence of highly consistent results.
Funding
Bill & Melinda Gates Foundation.
Introduction
The Global Burden of Diseases, Injuries, and Risk Factors Study (GBD) aims to quantify health losses from a wide array of diseases and injuries. These losses are expressed in units of disability-adjusted life-years (DALYs), which account for both premature mortality—measured as years of life lost (YLLs)—and time spent in states of reduced health—measured as years lived with disability (YLDs). Al though the term disability has many meanings in different contexts,1–4 in the GBD, disability refers to any short-term or long-term loss of health.5
For the latest revision of the GBD (GBD 2010), YLDs have been computed for 1160 sequelae resulting from 289 disease and injury causes, by multiplying the number of people living with each sequela by an associated disability weight. Extensive efforts were made to standardise and streamline the list of health con sequences across diseases, and as a result the 1160 sequelae have been mapped into a set of 220 distinct health states that capture the most salient differences in symptoms and functioning.6 The disability weight for a health state is a number on a scale from zero to one that represents the severity of health loss associated with the state. A value of 0 implies that a health state is equivalent to full health, and a value of 1 implies that a state is equivalent to death.
The previous comprehensive estimation of the global burden of disease (undertaken in the final revision of GBD 1990, which was published in 19967) used the judgments of a small group of health-care profess ionals to establish disability weights for 483 sequelae of 131 diseases and injuries. These disability weights were used widely in WHO’s revisions of the GBD for 1999–2002, and 2004,8–14 and in several national and subnational burden of disease studies.15–22 Additions and amendments to the 1996 GBD weights have been assimilated selectively, largely on the basis of the Dutch Disability Weights study,23–25 which adapted the GBD measurem ent approach from the 1996 study, with specific modifications to the descriptions of health states and addition of several states.
In view of the widespread use of GBD weights and the centrality of disability weights to the comparable measurement of disease burden across diverse causes, there has been much commentary and debate about the 1996 GBD weights and their derivatives, with critics challenging several aspects of the work.26–40 Four broad topics dominate the debate: how to define the construct being measured; what methods of measurement of this construct to use to elicit responses from individuals or groups; whose responses should be elicited; and how universal the resulting weights are.
The starting point for measurement of disability weights should be a clear definition of the construct to be measured. Two distinct possibilities are to measure welfare loss or health loss. Welfare loss is a broad construct, and while health outcomes undoubtedly affect wellbeing generally, there are probably many additional influences from factors unrelated to health. A debate in health economics continues about whether to take overall wellbeing or health as the quantity to be maximised in health-policy choices,41–43 with a parallel discussion in philosophy addressing the so-called separate spheres argument about appropriate accounting for health and non-health consequences in evaluation of health-care priorities.44 However, a broad recognition that health might be afforded a special status that distinguishes it from other elements of wellbeing pervades many strains of discourse in public policy and international law. For example, pro tection of the right to health was most famously articulated in the International Covenant on Economic, Social and Cultural Rights, which affirmed “the right of everyone to the enjoyment of the highest attainable standard of physical and mental health”.45 Most governments have ratified international treaties that include the right to health,46 and provisions for health or the right to health appear in 135 national constitutions.47 Although some have argued that the burden of disease should be quantified in terms of overall welfare loss because health and wellbeing are not separable,48 others have challenged this view.43,49,50
The measurement of disability weights in GBD 1990 did not clearly distinguish between health and wellbeing,7 but an evolution in the conceptual thinking behind the GBD has subsequently made explicit the aspiration to quantify health loss rather than welfare loss.51 This choice now distinguishes the GBD from other strains of research into weighing of health consequences; therefore, we draw attention to important implications of this difference when relevant.
A related set of issues concerns the specific measurement methods used to elicit judgments about health or welfare from individuals or groups. Measurement of disability weights in the 1996 GBD revision7 was partly based on a technique called the person trade-off, which locates comparisons between health outcomes within a resource allocation framework. Broad debate about methods pertains not only to measurement of the burden of disease, but also to related efforts to quantify outcomes in economic evaluations of health interventions.52–55 Key issues range from technical concerns about the psychometric properties of different measures55,56 to conceptual and ethical concerns about some methods, including the specific formulation of the person trade-off in the 1996 GBD weights.26,57 Methods appropriate for eliciting judgments about welfare loss should be adapted to study health loss.42 There are ongoing debates about the relevance of specific values and judgments, such as time preference, risk aversion, or inequality aversion that could complicate the interpretation of responses to different elicitation methods.52,58,59
A third question in discussions of disability weights is whose judgments should be used to derive these weights. Three respondent groups have been considered: health-care professionals, individuals who experience a health state, or the general public. Arguments for various respondent groups are both principled and pragmatic.60–63 The 1996 GBD weights7 used health-care professionals on the basis that they would have knowledge of a diverse set of health states and would be able to make comparative judgments. Individuals in a health state have the most intimate knowledge of the reductions in function associated with that state; however, their comparative judgments with other health states will be based on asymmetric information.62,64 Additionally, the capacity of individuals with some chronic disorders to adapt to their circumstances could lead to underestimation of the health loss associated with a particular state.7,65,66 Much of the scientific literature about health-state weights uses the responses of the general public, on the basis of the argument that, in a democratic society, the views of the general public are relevant in comparative assessments that inform public policy.61,67
Finally, the universality of disability weights has been much discussed. A central theme in some critiques of DALYs and in broader discussions of disability has been the contextualisation of disability within a particular social and cultural environment,3,36 which raises questions about the possibility of significant cross-cultural variability in disability weights.27,28,30,68 The universality of disability weights could largely depend on the specific construct that is chosen. A reasonable hypothesis is that the construct of health loss associated with different health states is more universal than is the construct of welfare loss. Welfare loss might be strongly affected by social context, support networks, and a myriad of individual preferences that might be less pertinent to measures of health loss. For example, the same health loss could be associated with different welfare losses in societies with disability and health insurance compared with those without such insurance. Fundamentally, questions about the universality of measures of health loss and welfare loss are empirical ones, but the evidence needed for systematic scientific investigation of these questions remains limited.
Beyond the disability weights measurement study from the 1996 revision of GBD 1990, several other investig ations of disability weights have added to both the empirical basis for weighting of health outcomes and the conceptual and philosophical debates about these measures. Some of these studies have focused on estimation of weights for many conditions with an adaptation of the 1996 GBD approach, as in the Dutch study,23–25 the European Disability Weights Project,68–70 and some national burden of disease studies.71–73 Several others have focused on techniques to obtain these weights in culturally diverse settings.74–76 Various studies have pro vided critical per spectives and new empirical measurem ents for disability weights pertaining to specific dis orders or categories—eg, depression,77 suicidality,78 stroke,79 injuries,80,81 oral health,82,83 and neglected tropical diseases.39,84–87
For GBD 2010, we have undertaken a compre hensive re-estimation of disability weights through a large-scale empirical study. This report describes the design, implementation, and results of the GBD 2010 disability weights measurement study, which yields novel disability weights with measurements of uncert ainty for the 220 unique health states arising from the array of disease and injury causes in the GBD. Addressing the four themes of persistent debate and responding to critiques of previous efforts to measure disability weights for the GBD, we focused on eliciting judgments about health loss rather than welfare loss; used a new, standardised approach to measurement with simple paired com parison questions; included a major emphasis on surveyi ng respondents from the general public; and used primary data collection in diverse communities to examine hypotheses about cultural variation in assess ments of disability.
Methods
Study design and participants
The study was done through a multicountry household survey and an open-access web-based survey. Household surveys were done between Oct 28, 2009, and June 23, 2010, in five countries (Bangladesh, Indonesia, Peru, Tanzania, and the USA) that were selected to provide diversity in language, culture, and socioeconomic status. All household surveys were administered as face-to-face, computer-assisted personal interviews, except for the survey in the USA, which was administered with computer-assisted tele phone interviews.
In household surveys, households were randomly selected with a multistage, stratified sam pling design, with probabilities of being selected proportional to population size. All samples were designed to be representative in a specific geo graphical area or, in the case of the USA, to be nationally representative. In Bangladesh, the study was done in the rural Zakiganj subdistrict of Sylhet district with the sample frame developed for a previous study of maternal and neonatal health (the Projahnmo study88). In Indonesia, the survey was done in three provinces characterised by varying socioeconomic status: two rural sites (Banten and Central provinces) and one urban site (Bali province). In Peru, the survey was implemented in 38 of the 49 districts in metropolitan Lima, excluding rural areas and 11 districts that were excluded for reasons of small population size, distance, or security. In Tanzania, the study was done on Pemba Island with a sample frame developed previously.89 In the USA, the national sample design was based on a list-assisted, random-digit dialling approach, as used in the Behavioral Risk Factor Surveillance System (BRFSS).90
In all household surveys, an adult respondent aged 18 years or older was randomly selected by the survey program from every contacted household, using the Kish approach. For the four countries in which face-to-face interviews were under taken, up to three visits were made to selected households to establish contact. Once a respondent was identified, up to three return visits were made to do the survey at a time when the selected respondent was available. For the US telephone survey, up to seven repeat calls were made.
The web-based survey was posted online at a dedicated URL between July 26, 2010, and May 16, 2011. The survey was available in English at the time of initial launch, with subsequent availability in Spanish and Mandarin. Respond ents were recruited by various strate gies, such as news items and editorials in scientific journals, announce ments at scientific meetings, postings on the websites of several institutions participating in the GBD, online media campaigns through social networking channels and community mobilisation groups, and direct contact with individuals and groups with global health interests by use of professional networks of the study investigators and their colleagues. Participants had to be aged 18 years or older.
Oral informed consent was obtained from all participants in the household surveys and written informed consent was obtained from participants in the web survey. The study was approved by ethical review boards at each household survey site and at the University of Washington (Seattle, WA, USA).
Procedures
We developed a suite of standardised survey instruments to elicit comparative assessments of health consequences associated with a wide array of health outcomes, including the 220 unique health states that collectively defined the non-fatal outcomes in GBD 2010. The basis for all comparisons was a set of brief lay descriptions that emphasised the major functional consequences and symptoms associated with each health state with simple, non-clinical vocabulary (appendix). These descriptions were developed through detailed consultation with expert groups participating in GBD 2010 by an iterative process that aimed to capture the most salient details for each health state, while ensuring consistency in wording across states and avoiding ambiguous terms. At an early stage in development of lay descriptions, a standardised worksheet with various dimensions of functional health and symptoms was provided to expert groups to help to identify relevant features of health states. When health states captured grades of severity for particular diso rders, descriptions were grounded in standard clinical classific ation systems as much as possible; for example, descriptions of stages of angina were developed with reference to the Canadian Cardiovascular Society grading scale,91 and those for heart failure were based on the New York Heart Association functional classification.92
The primary mode of eliciting responses was a paired comparison question, in which respondents were presented with descriptions of two hypothetical people, each with a particular health state, and then asked which person they regarded as healthier (appendix). In all surveys, pairs of health states were randomly selected by computer algorithm. In the five household surveys, respondents were asked to complete 15 paired comparisons generated from a pool of 108 health states. The subset of 108 states in the household survey was selected on the basis of two criteria: first, that the most salient aspects could be easily communicated to lay respondents through fairly short descriptions (ie, in 35 or fewer words) and second, that they could be presented realistically as chronic outcomes that would persist throughout a lifetime. The second criterion aimed to avoid conflating severity with duration; health states that typically manifest as acute or episodic outcomes were reserved for the web-based survey, so that a separate temporary framing might be used for these outcomes.
Respondents to the web-based survey were randomly assigned by the survey program to one of four different survey versions (appendix). One version was identical to the household survey, with the same set of 108 health states. Other versions had different subsets of the 220 GBD health states (with various additional states that were included for experimental purposes and states that were pared from the final GBD list), extra questions framed as comparisons of temporary rather than chronic outcomes, and additional modes of eliciting comparative assessments of health outcomes (appendix). Of relevance to this report, one survey version included questions about population health equivalence for a subset of 30 health states. In these questions, respondents were asked to compare the health benefits of different life-saving or disease-prevention programmes to anchor disability weights to the necessary scale (from zero to one). All questionnaires included a basic set of questions about sociodemographic characteristics (eg, age, sex, and education), income or durable assets, and health insurance status.
Standardised protocols were developed for instrument translation, presurvey evaluation, training of field personnel, and data collection in each of the four countries where face-to-face household surveys were done. Instruments were translated from English to the local language and then translated back to English, and the quality of translations was independently verified by bilingual speakers with knowledge of the study objectives. Presurvey evaluation in each site included focus groups and cognitive interviews to ensure that questions were well understood by participants and yielded valid and comparable responses. Transcripts and interviewer notes from the focus groups and cognitive tests were reviewed and modifications to the survey questionnaires were made as needed on the basis of the results. The questionnaires were programmed in a computer-assisted personal interviewing platform, and survey procedures for data collection and transfer in the computer-assisted system were pilot tested in every site. During field implementation, all data were captured electronically and transmitted daily (subject to field staff’s internet access) to a central, encrypted server to allow continuous monitoring of progress and data quality. The telephone survey in the USA was administered by trained BRFSS interviewers, and standard BRFSS procedures for monitoring and data quality control were used.90
Statistical analysis
Analyses were done with R (version 2.11.0) and Stata MP (version 11.2). Responses to paired comparisons of health states were summarised with heat maps that provided a visual display of the choice probabilities over each possible pair of states—ie, the probability that the first state in the pair was chosen by the respondent as being the healthier of the two outcomes. To examine differences between health states on a quantitative scale, we ran probit regression analyses on the choice responses, including indicator variables for each state that took the value 1 if the state was chosen as the healthier option in a paired comparison, −1 if the state was the non-chosen alternative, and 0 for all health states other than the pair being considered. This model is equivalent to standard approaches to analysis of paired comparison data, by which the probability of a particular choice response is expressed as a function of the difference between the scale values for the two options.93
We ran models of the paired comparison responses on the pooled dataset including all household surveys and the web survey. Additionally, we ran models separately by survey to assess the degree of variability across settings. Responses to population health equivalence questions were modelled with censored regression. To anchor the results from the probit regression analysis on the disability weight scale ranging from zero to one, we first ran a linear regression of the probit coefficients from the pooled analysis on disability weight estimates derived from the population health equivalence re sponses. On the basis of previous empirical evidence indicating that disability weights are well characterised by a logit-normal distribution,94 we undertook the res caling in logit-transformed space. We then used numerical integration to obtain mean estimates of disability weights on the natural zero-to-one scale. First, we simulated normal random variates on the logit scale with means defined by the rescaled probit coefficients and variance by the standard deviation across survey-specific estimates. Then we transformed each of these simulated values through an inverse-logit function. Finally, we computed the mean across the resulting values for each health state. To estimate uncertainty intervals around the mean disability weights, we drew 1000 bootstrap samples from the pooled dataset and repeated the estimation steps for each sample. We report 95% uncertainty intervals based on the 2·5th and 97·5th centiles in the distributions about each disability weight. We compared the new weights estimated in this study with those reported in WHO’s most recent update of the GBD for 2004. The appendix includes further details about statistical modelling.
Role of the funding source
The sponsor had no role in study design, data collection, data analysis, data interpretation, or writing of the report. The corresponding author had full access to all the data in the study and had final responsibility for the decision to submit for publication.
Results
Table 1 shows the characteristics of the 13 902 participants in the household surveys and the 16 328 participants in the web survey. The web survey included respondents from 167 countries, 27 of which had at least 50 respondents (figure 1). 7180 (44%) participants in the web survey were from the USA. 10 579 (93%) of 11 320 selected respondents in the four face-to-face household surveys participated, and the probability of response was at least 88% in each site. 3323 (69%) of 4833 selected respondents in the US telephone survey participated. Of all 20 465 people who entered the web survey and were eligible to participate, 13 391 (65%) completed the full questionnaire and an additional 2937 (14%) completed at least part of the survey. As we had expected, respondents in the web-based survey had much higher levels of educational attainment than respondents in any of the household surveys.
Table 1:
Characteristics of the study population
| Bangladesh (n=2610) | Indonesia (n=2430) | Peru (n=2926) | Tanzania (n=2613) | USA (n=3323) | Web survey (n=16 328) | |
|---|---|---|---|---|---|---|
|
| ||||||
| Age | ||||||
| 18–29 years | 818 (31%) | 678 (28%) | 942 (32%) | 978 (37%) | 181 (5%) | 5186 (32%) |
| 30–49 years | 1146 (44%) | 1253 (52%) | 1354 (46%) | 1046 (40%) | 870 (26%) | 6660 (41%) |
| 50–69 years | 505 (19%) | 423 (17%) | 629 (21%) | 446 (17%) | 1412 (42%) | 4127 (25%) |
| ≥70 years | 141 (5·5%) | 76 (3%) | 1 (<1%) | 143 (5%) | 852 (26%) | 355 (2%) |
| Unknown | 0 | 0 | 0 | 0 | 8 (<1%) | 0 |
| Sex | ||||||
| Men | 1507 (58%) | 1256 (52%) | 1543 (53%) | 1508 (58%) | 1230 (37%) | 5268 (32%) |
| Women | 1103 (42%) | 1174 (48%) | 1383 (47%) | 1105 (42%) | 2092 (63%) | 11 011 (67%) |
| Unknown | 0 | 0 | 0 | 0 | 1 (<1%) | 49 (<1%) |
| Education | ||||||
| None | 1125 (43%) | 160 (7%) | 32 (1%) | 917 (35%) | 8 (<1%) | 59 (<1%) |
| Primary | 823 (32%) | 971 (40%) | 302 (10%) | 689 (26%) | 75 (2%) | 11 (<1%) |
| Secondary | 564 (22%) | 442 (18%) | 1378 (47%) | 978 (37%) | 1162 (35%) | 1035 (6%) |
| Higher | 98 (4%) | 857 (35%) | 1214 (41%) | 29 (1%) | 2063 (62%) | 15 173 (93%) |
| Unknown | 0 | 0 | 0 | 0 | 15 (<1%) | 50 (<1%) |
Figure 1: Number of participants in the web survey by country.
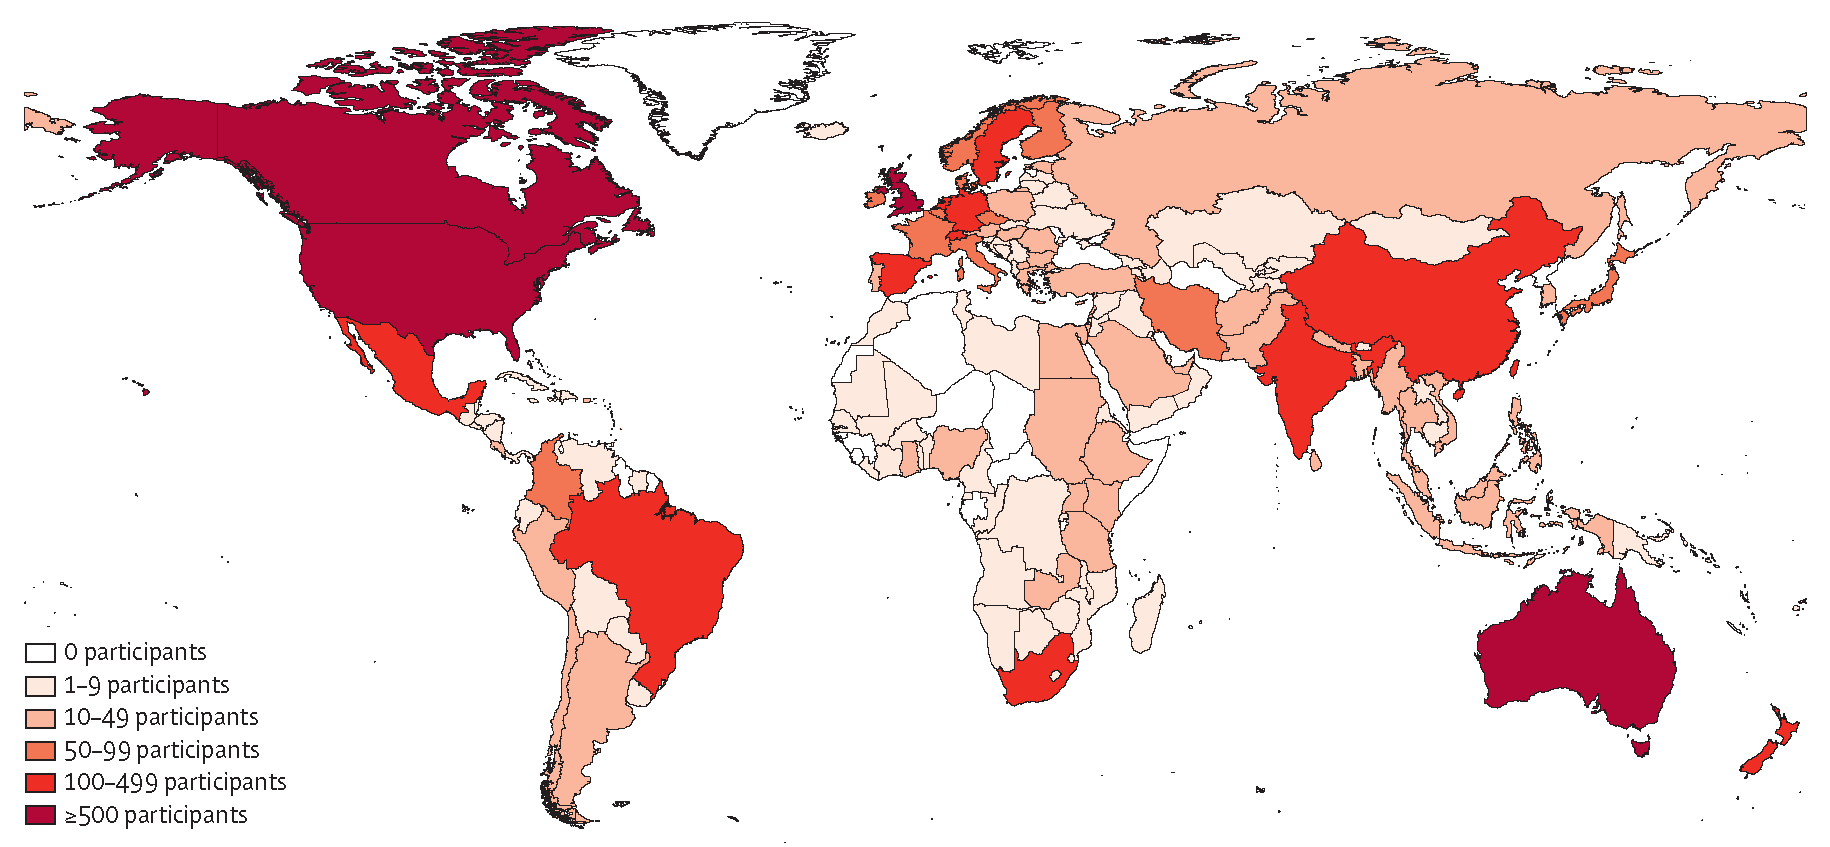
Figure 2 presents a series of heat maps offering a visual comparison of the paired comparison response probabilities in each of the household surveys and in the analogous version of the web survey. Each heat map displays a matrix of response probabilities for the 108×108 different pairwise comparisons from the set of 108 health states common to all surveys. The degree of measurement error across surveys varied, with the noisiest results in Bangladesh (figure 2); however, the surveys produced fairly similar information content within the paired comparison responses overall.
Figure 2: Response probabilities for paired comparisons in household surveys and the web survey.
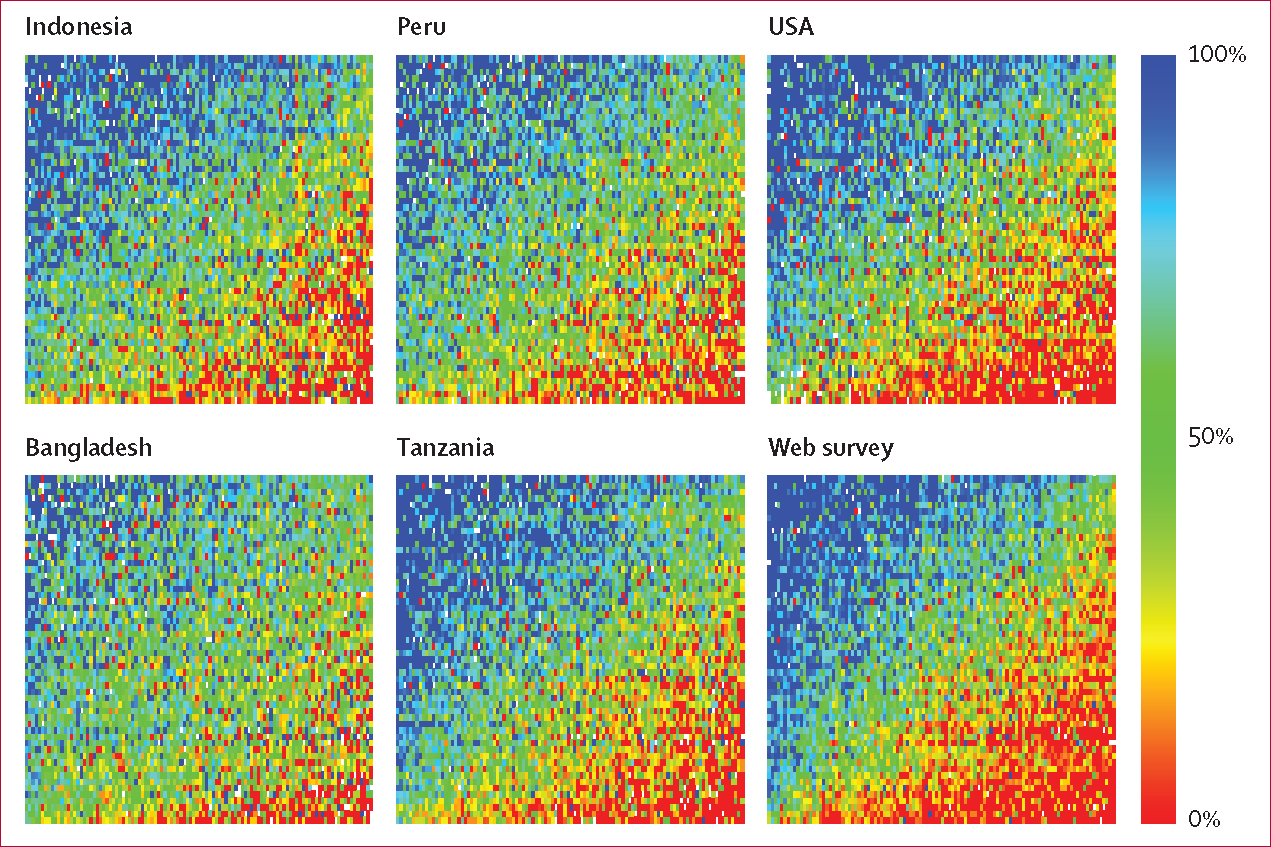
Colours on the heat maps correspond to the probability that the first health state in a paired comparison was chosen as the healthier outcome. Variation in the amount of measurement error across surveys is reflected in the varying degrees to which response probabilities follow an orderly transition from high to low between the upper left and the lower right corners in each heat map. A heat map with no measurement error and perfect internal consistency would have a smooth colour transition from blue to red along the diagonal, whereas a heat map with 100% error would have a completely random assortment of coloured squares.
Probit regression analyses were run on a pooled dataset, providing 379 492 paired comparison responses, and on datasets for each individual survey. Comparing results from regression analyses for each individual survey with pooled data, we confirmed a high degree of consistency between sites (figure 3). Pearson’s correlation coefficients between individual survey results and the results from the pooled analyses were 0·9 or higher in all cases except Bangladesh (figure 3). Comparing the web survey, which had the most highly educated respondents, with the survey in Tanzania, which had respondents with the lowest average educational levels, we noted a correlation of 0·89. Comparisons based on Lin’s concordance correlation coefficient were virtually identical to the Pearson’s results in most cases; the largest discrepancy between the two measures appeared in Bangladesh, where Lin’s coefficient was 0·72.
Figure 3: Survey-specific results compared with pooled results.
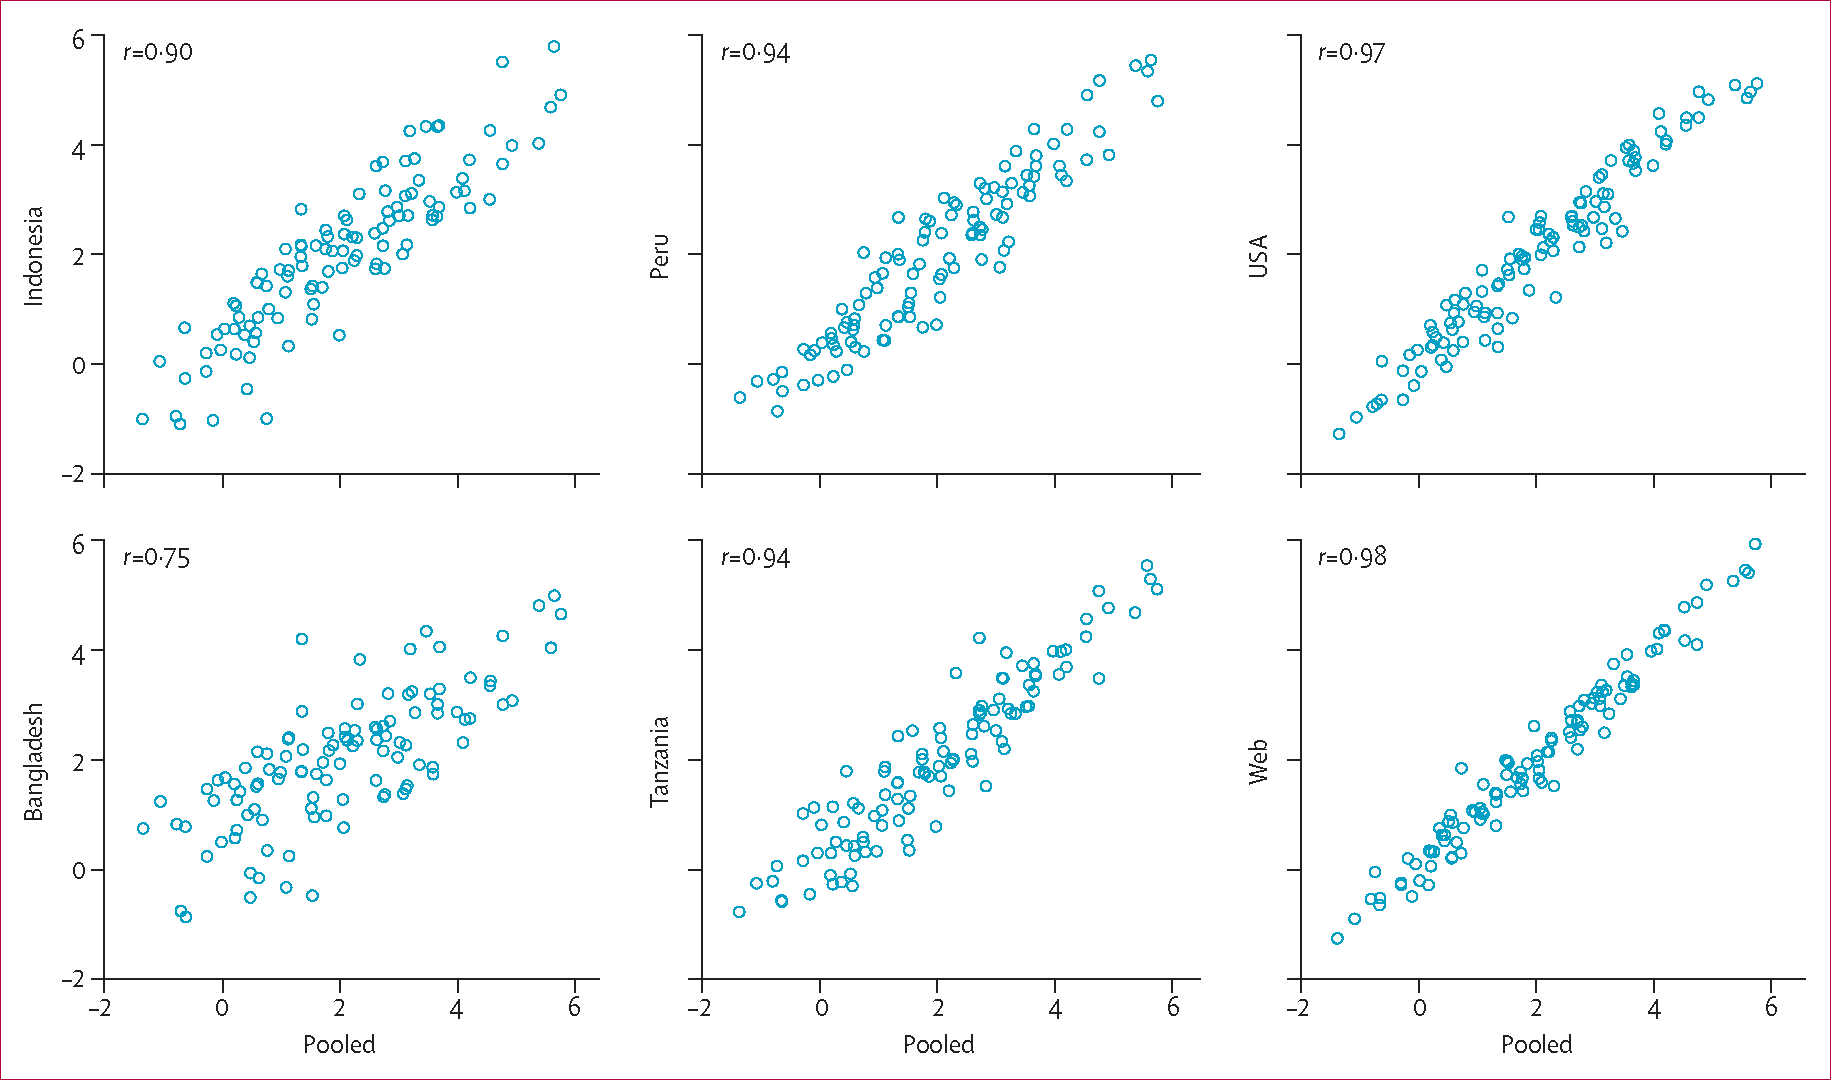
Values on the horizontal and vertical axes in each panel are normalised coefficients from probit regression analyses on paired comparison responses for the 108 health states included in the household surveys (appendix).
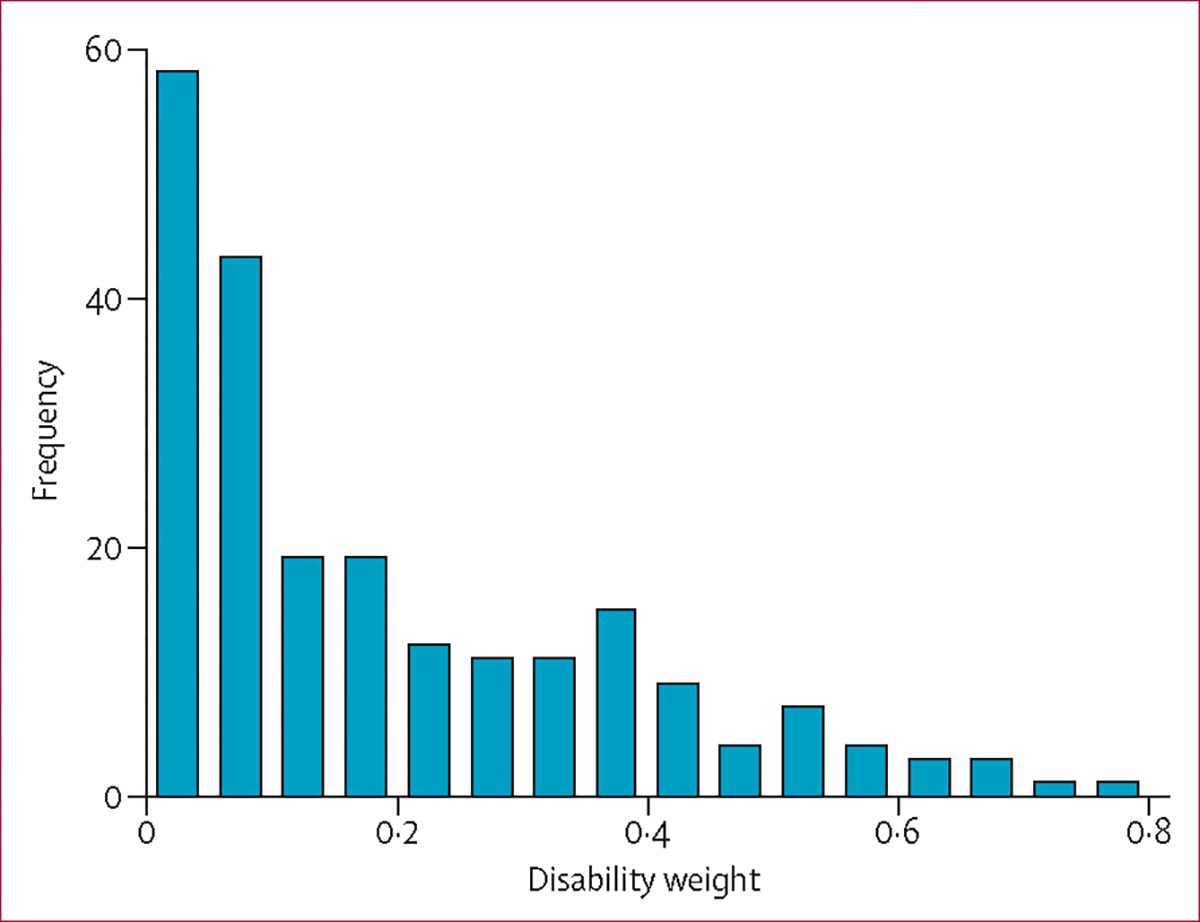
Table 2 shows the estimated disability weights and 95% uncertainty interv als for all 220 health states in the GBD 2010. Most were located on the mild end of the severity scale (figure 4). 58 (26%) unique states had disability weights below 0·05, implying that 1 year of life lost because of prem ature mortality is equivalent to more than 20 years lived in the specific health state. States with weights below 0·01 included those associated with mild anaemia, mild hearing or vision loss, secondary infertility, and several others (table 2). The outcomes with the highest disability weights were acute schizo phrenia and severe multiple sclerosis (table 2).
Table 2:
Disability weights for 220 unique health states
| Estimate (95% uncertainty interval) | |
|---|---|
|
| |
| Infectious disease | |
| Infectious disease: acute episode, mild | 0·005 (0·002–0·011) |
| Infectious disease: acute episode, moderate | 0·053 (0·033–0·081) |
| Infectious disease: acute episode, severe | 0·210 (0·139–0·298) |
| Infectious disease: post-acute consequences (fatigue, emotional lability, insomnia) | 0·254 (0·170–0·355) |
| Diarrhoea: mild | 0·061 (0·036–0·093) |
| Diarrhoea: moderate | 0·202 (0·133–0·299) |
| Diarrhoea: severe | 0·281 (0·184–0·399) |
| Epididymo-orchitis | 0·097 (0·063–0·137) |
| Herpes zoster | 0·061 (0·039–0·094) |
| HIV: symptomatic, pre-AIDS | 0·221 (0·146–0·310) |
| HIV/AIDS: receiving antiretroviral treatment | 0·053 (0·034–0·079) |
| AIDS: not receiving antiretroviral treatment | 0·547 (0·382–0·715) |
| Intestinal nematode infections: symptomatic | 0·030 (0·016–0·048) |
| Lymphatic filariasis: symptomatic | 0·110 (0·073–0·157) |
| Ear pain | 0·018 (0·009–0·031) |
| Tuberculosis: without HIV infection | 0·331 (0·222– 0·450) |
| Tuberculosis: with HIV infection | 0·399 (0·267–0·547) |
| Cancer | |
| Cancer: diagnosis and primary therapy | 0·294 (0·199–0·411) |
| Cancer: metastatic | 0·484 (0·330–0·643) |
| Mastectomy | 0·038 (0·022–0·059) |
| Stoma | 0·086 (0·055–0·131) |
| Terminal phase: with medication (for cancers, end-stage kidney or liver disease) | 0·508 (0·348–0·670) |
| Terminal phase: without medication (for cancers, end-stage kidney or liver disease) | 0·519 (0·356–0·683) |
| Cardiovascular and circulatory disease | |
| Acute myocardial infarction: days 1–2 | 0·422 (0·284–0·566) |
| Acute myocardial infarction: days 3–28 | 0·056 (0·035–0·082) |
| Angina pectoris: mild | 0·037 (0·022–0·058) |
| Angina pectoris: moderate | 0·066 (0·043–0·095) |
| Angina pectoris: severe | 0·167 (0·109–0·234) |
| Cardiac conduction disorders and cardiac dysrhythmias | 0·145 (0·097–0·205) |
| Claudication | 0·016 (0·008–0·028) |
| Heart failure: mild | 0·037 (0·021–0·058) |
| Heart failure: moderate | 0·070 (0·044–0·102) |
| Heart failure: severe | 0·186 (0·128–0·261) |
| Stroke: long-term consequences, mild | 0·021 (0·011–0·037) |
| Stroke: long-term consequences, moderate | 0·076 (0·050–0·110) |
| Stroke: long-term consequences, moderate plus cognition problems | 0·312 (0·211–0·433) |
| Stroke: long-term consequences, severe | 0·539 (0·363–0·705) |
| Stroke: long-term consequences, severe plus cognition problems | 0·567 (0·394–0·738) |
| Diabetes, digestive, and genitourinary disease | |
| Diabetic foot | 0·023 (0·012–0·039) |
| Diabetic neuropathy | 0·099 (0·066–0·145) |
| Chronic kidney disease (stage IV) | 0·105 (0·069–0·154) |
| End-stage renal disease: with kidney transplant | 0·027 (0·015–0·043) |
| End-stage renal disease: on dialysis | 0·573 (0·397–0·749) |
| Decompensated cirrhosis of the liver | 0·194 (0·127–0·273) |
| Gastric bleeding | 0·323 (0·214–0·461) |
| Crohn’s disease or ulcerative colitis | 0·225 (0·152–0·314) |
| Benign prostatic hypertrophy: symptomatic | 0·070 (0·046–0·102) |
| Urinary incontinence | 0·142 (0·094–0·204) |
| Impotence | 0·019 (0·010–0·034) |
| Infertility: primary | 0·011 (0·005–0·021) |
| Infertility: secondary | 0·006 (0·002–0·013) |
| Chronic respiratory diseases | |
| Asthma: controlled | 0·009 (0·004–0·018) |
| Asthma: partially controlled | 0·027 (0·015–0·045) |
| Asthma: uncontrolled | 0·132 (0·087–0·190) |
| COPD and other chronic respiratory diseases: mild | 0·015 (0·007–0·028) |
| COPD and other chronic respiratory diseases: moderate | 0·192 (0·129–0·271) |
| COPD and other chronic respiratory diseases: severe | 0·383 (0·259–0·528) |
| Neurological disorders | |
| Dementia: mild | 0·082 (0·055–0·117) |
| Dementia: moderate | 0·346 (0·233–0·475) |
| Dementia: severe | 0·438 (0·299–0·584) |
| Headache: migraine | 0·433 (0·287–0·593) |
| Headache: tension-type | 0·040 (0·025–0·062) |
| Multiple sclerosis: mild | 0·198 (0·137–0·278) |
| Multiple sclerosis: moderate | 0·445 (0·303–0·593) |
| Multiple sclerosis: severe | 0·707 (0·522–0·857) |
| Epilepsy: treated, seizure free | 0·072 (0·047–0·106) |
| Epilepsy: treated, with recent seizures | 0·319 (0·211–0·445) |
| Epilepsy: untreated | 0·420 (0·279–0·572) |
| Epilepsy: severe | 0·657 (0·464–0·827) |
| Parkinson’s disease: mild | 0·011 (0·005–0·021) |
| Parkinson’s disease: moderate | 0·263 (0·179–0·360) |
| Parkinson’s disease: severe | 0·549 (0·383–0·711) |
| Mental, behavioural, and substance use disorders | |
| Alcohol use disorder: mild | 0·259 (0·176–0·359) |
| Alcohol use disorder: moderate | 0·388 (0·262–0·529) |
| Alcohol use disorder: severe | 0·549 (0·384–0·708) |
| Fetal alcohol syndrome: mild | 0·017 (0·008–0·032) |
| Fetal alcohol syndrome: moderate | 0·057 (0·036–0·087) |
| Fetal alcohol syndrome: severe | 0·177 (0·117–0·255) |
| Cannabis dependence | 0·329 (0·223–0·455) |
| Amphetamine dependence | 0·353 (0·215–0·525) |
| Cocaine dependence | 0·376 (0·235–0·553) |
| Heroin and other opioid dependence | 0·641 (0·459–0·803) |
| Anxiety disorders: mild | 0·030 (0·017–0·048) |
| Anxiety disorders: moderate | 0·149 (0·101–0·210) |
| Anxiety disorders: severe | 0·523 (0·365–0·684) |
| Major depressive disorder: mild episode | 0·159 (0·107–0·223) |
| Major depressive disorder: moderate episode | 0·406 (0·276–0·551) |
| Major depressive disorder: severe episode | 0·655 (0·469–0·816) |
| Bipolar disorder: manic episode | 0·480 (0·323–0·642) |
| Bipolar disorder: residual state | 0·035 (0·021–0·055) |
| Schizophrenia: acute state | 0·756 (0·571–0·894) |
| Schizophrenia: residual state | 0·576 (0·399–0·756) |
| Anorexia nervosa | 0·223 (0·151–0·313) |
| Bulimia nervosa | 0·223 (0·150–0·310) |
| Attention-deficit hyperactivity disorder | 0·049 (0·031–0·074) |
| Conduct disorder | 0·236 (0·154–0·337) |
| Asperger’s syndrome | 0·110 (0·073–0·157) |
| Autism | 0·259 (0·177–0·362) |
| Intellectual disability: mild | 0·031 (0·018–0·049) |
| Intellectual disability: moderate | 0·080 (0·053–0·114) |
| Intellectual disability: severe | 0·126 (0·085–0·176) |
| Intellectual disability: profound | 0·157 (0·107–0·221) |
| Hearing and vision loss | |
| Hearing loss: mild | 0·005 (0·002–0·012) |
| Hearing loss: moderate | 0·023 (0·013–0·038) |
| Hearing loss: severe | 0·032 (0·018–0·051) |
| Hearing loss: profound | 0·031 (0·018–0·049) |
| Hearing loss: complete | 0·033 (0·020–0·052) |
| Hearing loss: mild, with ringing | 0·038 (0·024–0·058) |
| Hearing loss: moderate, with ringing | 0·058 (0·037–0·085) |
| Hearing loss: severe, with ringing | 0·065 (0·041–0·094) |
| Hearing loss: profound, with ringing | 0·088 (0·058–0·127) |
| Hearing loss: complete, with ringing | 0·092 (0·061–0·134) |
| Distance vision: mild impairment | 0·004 (0·001–0·010) |
| Distance vision: moderate impairment | 0·033 (0·020–0·052) |
| Distance vision: severe impairment | 0·191 (0·129–0·269) |
| Distance vision blindness | 0·195 (0·132–0·272) |
| Near vision impairment | 0·013 (0·006–0·024) |
| Musculoskeletal disorders | |
| Low back pain: acute, without leg pain | 0·269 (0·184–0·373) |
| Low back pain: acute, with leg pain | 0·322 (0·219–0·447) |
| Low back pain: chronic, without leg pain | 0·366 (0·248–0·499) |
| Low back pain: chronic, with leg pain | 0·374 (0·252–0·506) |
| Neck pain: acute, mild | 0·040 (0·023–0·064) |
| Neck pain: acute, severe | 0·221 (0·150–0·305) |
| Neck pain: chronic, mild | 0·101 (0·067–0·149) |
| Neck pain: chronic, severe | 0·286 (0·197–0·398) |
| Musculoskeletal problems: legs, mild | 0·023 (0·013–0·039) |
| Musculoskeletal problems: legs, moderate | 0·079 (0·053–0·115) |
| Musculoskeletal problems: legs, severe | 0·171 (0·117–0·240) |
| Musculoskeletal problems: arms, mild | 0·024 (0·014–0·041) |
| Musculoskeletal problems: arms, moderate | 0·114 (0·077–0·159) |
| Musculoskeletal problems: generalised, moderate | 0·292 (0·197–0·410) |
| Musculoskeletal problems: generalised, severe | 0·606 (0·421–0·771) |
| Gout: acute | 0·293 (0·198–0·404) |
| Injuries | |
| Amputation of finger(s), excluding thumb: long term, with treatment | 0·030 (0·018–0·048) |
| Amputation of thumb: long term | 0·013 (0·006–0·025) |
| Amputation of one arm: long term, with or without treatment | 0·130 (0·088–0·185) |
| Amputation of both arms: long term, with treatment | 0·044 (0·028–0·067) |
| Amputation of both arms: long term, without treatment | 0·359 (0·242–0·497) |
| Amputation of toe | 0·008 (0·003–0·017) |
| Amputation of one leg: long term, with treatment | 0·021 (0·011–0·035) |
| Amputation of one leg: long term, without treatment | 0·164 (0·111–0·229) |
| Amputation of both legs: long term, with treatment | 0·051 (0·032–0·076) |
| Amputation of both legs: long term, without treatment | 0·494 (0·341–0·654) |
| Burns of <20% total surface area without lower airway burns: short term, with or without treatment | 0·096 (0·062–0·140) |
| Burns of <20% total surface area or <10% total surface area if head or neck, or hands or wrist involved: long term, with or without treatment | 0·018 (0·010–0·032) |
| Burns of ≥20% total surface area: short term, with or without treatment | 0·333 (0·220–0·472) |
| Burns of ≥20% total surface area or ≥10% total surface area if head or neck, or hands or wrist involved: long term, with treatment | 0·127 (0·086–0·183) |
| Burns of ≥20% total surface area or ≥10% total surface area if head or neck, or hands or wrist involved: long term, without treatment | 0·438 (0·298–0·588) |
| Lower airway burns: with or without treatment | 0·373 (0·248–0·521) |
| Crush injury: short or long term, with or without treatment | 0·145 (0·093–0·211) |
| Dislocation of hip: long term, with or without treatment | 0·017 (0·008–0·030) |
| Dislocation of knee: long term, with or without treatment | 0·129 (0·087–0·178) |
| Dislocation of shoulder: long term, with or without treatment | 0·080 (0·053–0·116) |
| Other injuries of muscle and tendon (includes sprains, strains, and dislocations other than shoulder, knee, or hip) | 0·009 (0·004–0·018) |
| Drowning and non-fatal submersion: short or long term, with or without treatment | 0·288 (0·191–0·403) |
| Fracture of clavicle, scapula, or humerus: short or long term, with or without treatment | 0·053 (0·033–0·080) |
| Fracture of face bone: short or long term, with or without treatment | 0·173 (0·111– 0·257) |
| Fracture of foot bones: short term, with or without treatment | 0·033 (0·019–0·053) |
| Fracture of foot bones: long term, without treatment | 0·033 (0·019–0·052) |
| Fracture of hand: short term, with or without treatment | 0·025 (0·013–0·043) |
| Fracture of hand: long term, without treatment | 0·016 (0·008–0·028) |
| Fracture of neck of femur: short term, with or without treatment | 0·308 (0·205–0·439) |
| Fracture of neck of femur: long term, with treatment | 0·072 (0·047–0·105) |
| Fracture of neck of femur: long term, without treatment | 0·388 (0·261–0·532) |
| Fracture other than neck of femur: short term, with or without treatment | 0·192 (0·121–0·280) |
| Fracture other than neck of femur: long term, without treatment | 0·053 (0·035–0·079) |
| Fracture of patella, tibia or fibula, or ankle: short term, with or without treatment | 0·087 (0·055–0·127) |
| Fracture of patella, tibia or fibula, or ankle: long term, with or without treatment | 0·070 (0·047–0·102) |
| Fracture of pelvis: short term | 0·390 (0·257–0·545) |
| Fracture of pelvis: long term | 0·194 (0·132–0·272) |
| Fracture of radius or ulna: short term, with or without treatment | 0·065 (0·040–0·101) |
| Fracture of radius or ulna: long term, without treatment | 0·050 (0·032–0·075) |
| Fracture of skull: short or long term, with or without treatment | 0·073 (0·046–0·109) |
| Fracture of sternum or fracture of one or two ribs: short term, with or without treatment | 0·150 (0·098–0·215) |
| Fracture of vertebral column: short or long term, with or without treatment | 0·132 (0·085–0·195) |
| Fractures: treated, long term | 0·003 (0·001–0·008) |
| Injured nerves: short term | 0·065 (0·040–0·096) |
| Injured nerves: long term | 0·136 (0·092–0·189) |
| Injury to eyes: short term | 0·079 (0·050–0·118) |
| Severe traumatic brain injury: short term, with or without treatment | 0·235 (0·156–0·331) |
| Traumatic brain injury: long-term consequences, minor, with or without treatment | 0·106 (0·072–0·147) |
| Traumatic brain injury: long-term consequences, moderate, with or without treatment | 0·224 (0·153–0·314) |
| Traumatic brain injury: long-term consequences, severe, with or without treatment | 0·625 (0·444–0·789) |
| Open wound: short term, with or without treatment | 0·005 (0·002–0·013) |
| Poisoning: short term, with or without treatment | 0·171 (0·116–0·239) |
| Severe chest injury: long term, with or without treatment | 0·056 (0·036–0·082) |
| Severe chest injury: short term, with or without treatment | 0·352 (0·229–0·484) |
| Spinal cord lesion below neck: treated | 0·047 (0·029–0·072) |
| Spinal cord lesion below neck: untreated | 0·440 (0·290–0·588) |
| Spinal cord lesion at neck: treated | 0·369 (0·243–0·513) |
| Spinal cord lesion at neck: untreated | 0·673 (0·475–0·837) |
| Other | |
| Abdominopelvic problem: mild | 0·012 (0·005–0·023) |
| Abdominopelvic problem: moderate | 0·123 (0·083–0·176) |
| Abdominopelvic problem: severe | 0·326 (0·219–0·451) |
| Anaemia: mild | 0·005 (0·002–0·011) |
| Anaemia: moderate | 0·058 (0·038–0·086) |
| Anaemia: severe | 0·164 (0·112–0·228) |
| Periodontitis | 0·008 (0·003–0·017) |
| Dental caries: symptomatic | 0·012 (0·005–0·023) |
| Severe tooth loss | 0·072 (0·048–0·103) |
| Disfigurement: level 1 | 0·013 (0·006–0·025) |
| Disfigurement: level 2 | 0·072 (0·048–0·103) |
| Disfigurement: level 3 | 0·398 (0·271–0·543) |
| Disfigurement: level 1 with itch or pain | 0·029 (0·016–0·048) |
| Disfigurement: level 2, with itch or pain | 0·187 (0·125–0·264) |
| Disfigurement: level 3, with itch or pain | 0·562 (0·394–0·725) |
| Generic uncomplicated disease: worry and daily medication | 0·031 (0·017–0·050) |
| Generic uncomplicated disease: anxiety about diagnosis | 0·054 (0·033–0·082) |
| Iodine-deficiency goitre | 0·200 (0·134–0·283) |
| Kwashiorkor | 0·055 (0·033–0·085) |
| Severe wasting | 0·127 (0·081–0·183) |
| Speech problems | 0·054 (0·034–0·081) |
| Motor impairment: mild | 0·012 (0·005–0·022) |
| Motor impairment: moderate | 0·076 (0·050–0·109) |
| Motor impairment: severe | 0·377 (0·251–0·518) |
| Motor plus cognitive impairments: mild | 0·054 (0·033–0·084) |
| Motor plus cognitive impairments: moderate | 0·221 (0·141–0·314) |
| Motor plus cognitive impairments: severe | 0·425 (0·286–0·587) |
| Rectovaginal fistula | 0·492 (0·330–0·660) |
| Vesicovaginal fistula | 0·338 (0·228–0·467) |
COPD=chronic obstructive pulmonary disease.
Figure 4: Frequency distribution of disability weights for 220 health states.
We identified 126 states in the present study that had corresponding sequelae in WHO’s update of the GBD for 2004.14 Some were directly comparable because the health states were specified consistently in the two studies. For the remainder, health-state definitions did vary between the new and old versions (eg, the old study had one sequela for multiple sclerosis but ours included mild, moderate, and severe multiple sclerosis states), which implies that the comparisons are between outcomes that are similar but not identical (appendix).
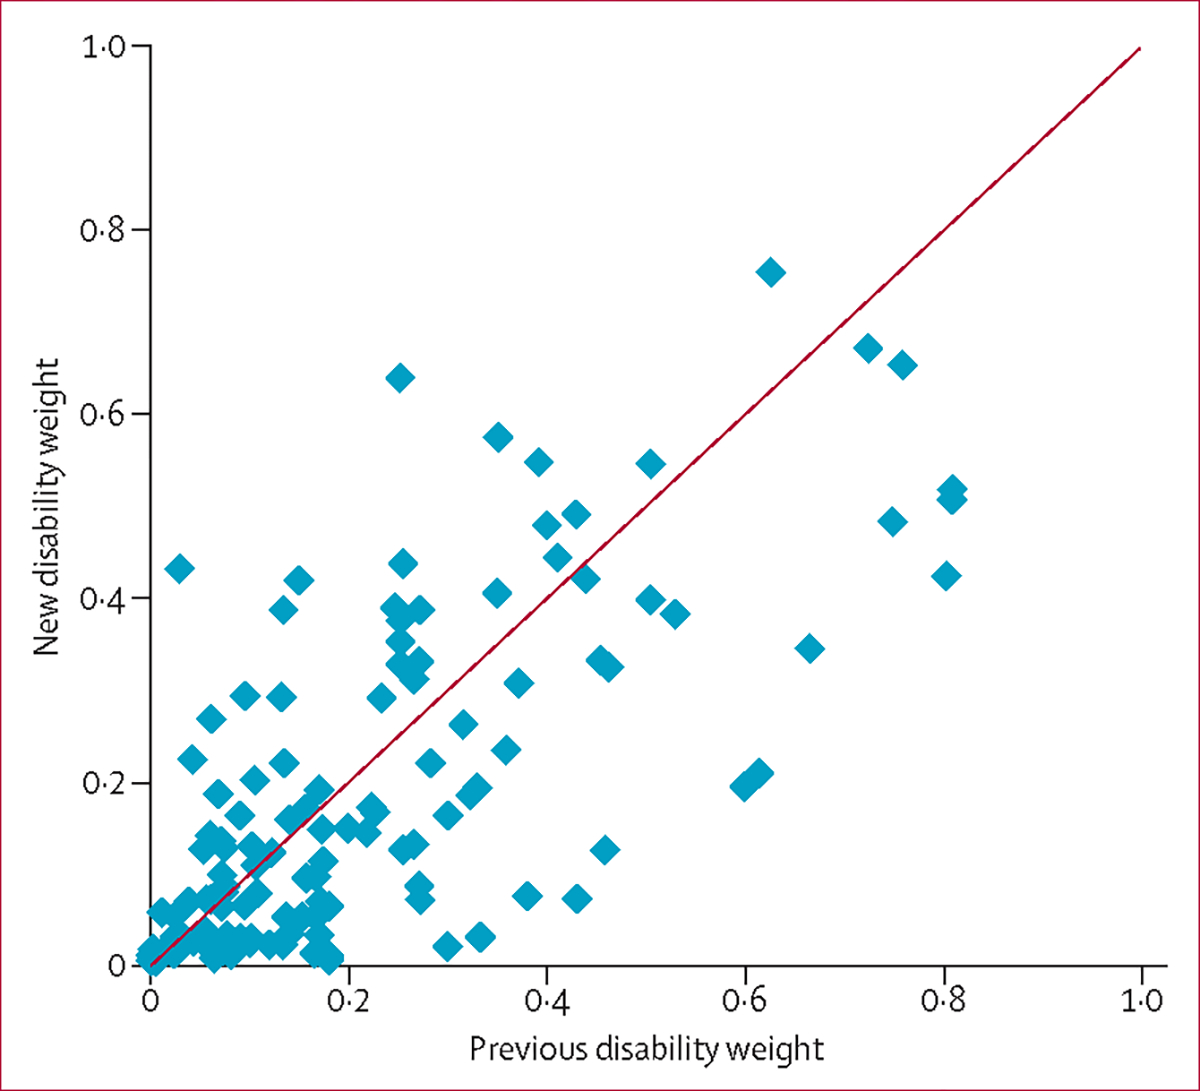
There is a broad pattern of agreement between the old and new weights, particularly in the moderate to severe range (figure 5). Overall, the correlation between the old and new weights was 0·70 (figure 5). However, in the range below 0·2—where most of the new weights reside—many states have substantially lower weights in our analysis than previously, which could have important implications for estimates of the overall burden asso ciated with specific causes. In some cases, decreased weights in our study reflect a more detailed disaggregation of mild outcomes. For example, WHO’s update for 200414 combined mild and moderate chronic obstructive pulmonary disease (with a weight of 0·17), whereas we have recorded large differences in the disability weight for mild (0·015) versus moderate disease (0·19). In other cases when the description of outcomes is fairly unamb iguous, we nevertheless have reported substantially lower weights than previously—eg, infertility (previously 0·18; cur rently 0·01), amputated fingers (previously 0·10; currently 0·03), moderate to profound hearing loss (previously 0·12–0·33; currently 0·02–0·03), and blindn ess (prev iously 0·60, currently 0·20). However, several states are associated with substantially higher weights in our study—eg, untreated epilepsy (previously 0·15; currently 0·42), illicit drug use disorders (previously 0·25 overall, with no dis aggre gation for specific drugs; currently ranging as high as 0·64 for opioid dependence), and acute low back pain (previously 0·06, currently 0·27).
Figure 5: Comparison of disability weights in this study and from WHO’s update of the Global Burden of Disease Study for 2004.
Discussion
This study, to our knowledge, is the largest empirical effort to date to measure disability weights for a wide array of health outcomes across a diverse range of populations. Several important findings emerged. First, we have demonstrated that it is feasible to elicit assessments about a wide variety of health outcomes in virtually any population, even where educational attain ment is low. Second, we have established the utility of a new approach to elicit this information with much simpler questions than have been used before and fairly straight-forward methods of data analysis. Third—and perhaps most importantly—we have reported compelling evidence that contradicts the prevailing hypothesis that assessments of disability must vary widely across samples with diverse cultural, educational, environmental, or demographic circumstances.
The design of this new study responds to critiques of past efforts to measure disability weights for the GBD in several ways. The main way to elicit assessments of health in our study was simple paired comparison questions, which were comprehensible by people with little or no formal schooling who were well represented in our sample. This method creates opportunities to acquire input from a broad cross-section of respondents who are usually excluded from such measurement exercises. Indeed, a major strength that distinguishes this study from others is that the new approach accommodates data collection through population-based household surveys rather than from expert panels. The reliance on health professionals has been a frequent target for criticism of existing disability weights,27,38,39 which is consistent with the premise that these weights should reflect a broad social understanding of the relative importance of different aspects of health. Respondents in this study were asked to compare lay descriptions that emphasised the consequences of one condition. By contrast, health-care professionals might unwittingly take into account the typical comorbidities seen with particular conditions; their judgments of severity could reflect not only the health state being described, but also what usually goes alongside because of related conditions.
Data from these surveys provide extensive empirical evidence for critical questions about the extent of variation in comparative health assessments across different settings. Recent discussions about disability have emphasised the importance of recognising the effects of contextual differences on levels of disability experienced by people with a particular health condition in various settings. Our findings suggest that concerns about pervasive variations in health assessments across settings due to these differences in contextual factors could be overstated. In our study, a high degree of cons istency was reported in paired comparison responses across surveys with highly heterogeneous respondents. For example, the web-based survey was done in a non-random, self-selected, highly educated sample, and yet the analyses of these results showed that the correlation with the representative population sample from Tanz ania where educational attainment was lowest was strong. Although some variation between the results of individual surveys and those from the pooled analysis of data from all respondents remained, even the lowest correlation was roughly 0·75.
This high degree of consistency contrasts with arguments and results in several commentaries and small empirical studies.27,28,38 One previous study27 compared condition rankings elicited from 241 key informants in 14 countries and showed that some differences between countries and types of informant groups were large enough to question the universality of disability assessments. Our study—with larger samples in representative household surveys—yielded higher correlation coefficients overall than did this previous investigation. While the somewhat different outcomes in these two studies might elude definitive explanation, we could speculate that the selection of key informants can introduce important heterogeneities across settings that are magnified in relatively small samples, whereas larger, population-based samples are less likely to show biases from selection. Likewise, our focus on the con struct of health loss as opposed to welfare loss might have been an important driver of the consistency of results. A further potential contributor to the high level of agreement in our study was the focus of the lay descriptions on functional consequences rather than on the aetiological cause. Another major exercise in the comparative evaluation of disability assessments across countries showed fairly high levels of agreement bet ween western European countries.68 Our study rei nforces this finding in a more diverse array of settings.
There are important limitations of our study. First, while we included surveys in a set of countries that reflect widely divergent cultural perspectives and levels of economic development, and did the household surveys on the basis of stratified random sampling within particular locations, we do not suggest that the five household surveys in this study comprise a random sample of the world’s population, and we certainly make no such claims about the web-based survey. Results might have been different had we chosen another set of countries for the household surveys. Likewise, the web-based survey includes many respondents from North America, Australia, and western Europe, but few respondents from Africa or the Middle East; results could change with a different geographical concentration of respondents. In terms of individual respondent characteristics, our sample included fairly few respondents aged 70 years or older, and the web survey had a heavy skew towards female respondents.
While the high correlations across settings give support to the proposition that there is a broadly shared set of common values for health losses that transcends narrow cultural and geographical boundaries, replication of this study in other settings will undoubtedly add nuance to the understanding of which aspects of judgments about health are most closely shared across settings and which are most variable. Indeed, the broad patterns of consistency overall could mask important examples of specific conditions for which ratings do vary across settings. More detailed examination of this variation on a case-by-case basis and reports of further empirical evidence will no doubt lead to interesting findings and generate new hypotheses about specific notions of health that are shared broadly versus those that diverge in important ways. In terms of the measures of consistency examined, it is also important to note that while our results point to a high degree of consistency in responses on direct comparisons between health states, the study did not include population health equivalence questions in the household surveys. Therefore, we are not able to draw conclusions about whether respondents make similar trade-offs between fatal and non-fatal outcomes across countries.
One of the most important limitations is that our study assigns weights to conditions presented as brief descriptions in lay language. With the aim to develop accurate but parsimonious lay descriptions for all conditions, some aspects of health states were inevitably omitted in the interest of simplicity, comprehensibility, and feasibility. While we made great efforts in this study to ensure consistency in language across conditions and to avoid ambiguous terms, some variability remained; differences in disability weights could be sensitive to this variation. For some examples such as illicit drug use disorders, we recorded notably higher results than in previous studies. We suspect that part of the reason for this result was that the descriptions of illicit drug use disorders attributed a functional outcome to a particular cause, which was deliberately avoided in other health states. Other work has indicated that labelling of alternatives in discrete choice experiments can substantially alter respondent choice.95 In our study, explicit reference to drug use disorders as the cause of the functional outcomes described could have biased disability weights upwards partly by introducing confounding considera tions of comorbidities that could be more common in individuals with drug use disorders than in those with out. Moreover, with references to behaviours that might invoke moral or legal judgments or social disapproval, the descriptions could have led some respondents to regard the outcome less favourably than if they had focused exclusively on health consequences.
In some cases when disability weights were surprisingly low (eg, for profound hearing loss), the result might have been sensitive to omission of aspects of the health state that were pertinent to assessments about the severity of health loss, such as anxiety or depression. Further empirical work is needed to know whether addition of aspects like depression would bridge the difference between the existing weights and the new ones. In addition to affecting the average weights estimated in the study, parsimony in description of health outcomes could have exaggerated the consistency of responses across settings—eg, by eliminating additional variation in the weighing of omitted elements. Parsimony could also produce an opposite effect, namely inflation of variation, by introducing cultural differences in the ways that respondents impute omitted aspects of the health outcomes on the basis of their own knowledge and local circumstances.
In other cases, we noted differences from previous GBD weights that are harder to explain in terms of specific aspects of the lay descriptions. For example, intellectual impairments and development disorders were rated more mildly here than previously. The general public might consider intellectual disability to be less of a reduction in health than does a group of highly educated professionals. The disability weight for blindness is also substantially lower in our study than in previous GBD iterations. The decreased weight could be partly related to the use of a health construct rather than a welfare construct. In cases such as these when the difference between old and new weights is large, further empirical work to try to identify the reasons for these differences would be of high interest.
In the future, it will be worthwhile to consider extending the approach used to elicit comparisons for outcomes described in a generically standardised way—eg, with one of the many popular health status meas urement instruments such as SF-12 or EQ-5D.40,96–99 A drawback of such an approach is that these instru ments tend to focus parsimoniously on a few core dimensions of health, which might not capture the most salient functional consequences and symptoms assoc iated with the wide array of health outcomes in the GBD. Nevertheless, the approach would allow linkage with representative household surveys that elicit both generic functional health descriptors and specific diag noses, which would in turn allow the characterisation of the distribution of health states associated with particular sequelae in the population. In our study, a focus on one typical case description or at most a small number of discrete severity levels could have obscured important variation in the range of health states associated with particular sequelae. Another benefit of linking descript ions to generic health status measurement systems is that it would allow correction of functional health information associated with a specified health problem for the presence of comorbidities. In GBD 2010, a related method has been used in a more limited way to determine the distribution of individuals with a part icular diagnosis across different health states as well as the fraction of time spent asymptomatic.100
Despite these limitations, we emphasise that this study provides an uncommonly extensive empirical basis for understanding views of health across a diverse set of populations. It establishes a new set of disability weights that we hope will supply a crucial resource for assessments of burden of disease and for analyses of the comparative effectiveness and cost-effectiveness of interventions. We suggest that the new set of weights offer a substantially more rigorous and credible basis for weighing outcomes in these analyses than did the weights that were measured previously, which continue to be widely used. Data in this study offer new opport unities for empirically based inquiry into the possibility of substantial cross-cultural heterogeneity in assessm ents of disability relating to specific health conditions. Notably, we did not observe evidence to support the hypothesis that comparative assessments of health at a global level are undermined by extensive cultural vari ation. On the contrary, we have reported strong evidence that many aspects of individuals’ assessments of health outcomes seem to reflect common values, affirming universal aspirations for averting negative health out comes such as pain or depression and for enjoying high levels of functioning in domains of health such as mobility.
Supplementary Material
Acknowledgments
We thank all the survey respondents who participated in the study and the survey field staff who did the interviews. We acknowledge institutions that were pivotal in implementation of the survey around the world, providing administrative and logistical support to data collection: Shimantik, Bangladesh; Instituto Cuanto, Peru; the Public Health Laboratory Ivo de Carneri, Pemba Island, Tanzania; ICF International (formerly ICF Macro); and the National Institute of Health Research and Development at the Ministry of Health, Indonesia. We thank the many individuals who have contributed to GBD 2010 in various capacities, and particularly recognise the important contributions to this work from many WHO staff members. We are grateful for guidance and feedback from participants at the Expert Consultation on Disability Weights (Seattle, WA, USA; September, 2008): Laura Damschroder, Dean Jamison, Jennifer Jelsma, Steven Kymes, Donald L Patrick, Michael Schoenbaum, and Michael Wolfson. We give special thanks to Dan Brock, Daniel M Hausman, and Dan Wikler for many enlightening discussions around the topic of disability weights over many years. We thank Colin Mathers and Gretchen Stevens for their particular contributions to many aspects of the study; Farah Chowdhury, Makame H Mohammed, Haidong Wang, Andres I Vecino Ortiz, Rebecca Myerson, and Zhongwei Jia for their assistance in translation of survey instruments; Lebogang Ramma, for insights from adapting the survey in South Africa; Ben Wikler, Jill Oviatt, Corwyn Ellison, and William Heisel for promoting the survey and helping it reach a widespread audience; Emmanuela Gakidou for many helpful suggestions; Erin C Mullany, Kate Muller, and Diana Haring for coordinating, reviewing, and editing the report; and Michael F MacIntyre for his steadfast management of innumerable elements in the overall GBD 2010 enterprise. J A Salomon acknowledges funding from the Burke Global Health Fellowship Program at the Harvard Global Health Institute. K Bhalla’s primary source of support was the World Bank Global Road Safety Facility. R Bourne acknowledges support from the Vision and Eye Research Unit (Postgraduate Medical Institute, Anglia Ruskin University, Cambridge, UK). T S Brugha acknowledges funding from the Department of Health London for the National Health Service Information Centre and from the University of Leicester for the Estimating the Prevalence of Autism Spectrum Conditions in Adults: Extending the 2007 Adult Psychiatric Morbidity Survey. C Bryan-Hancock received funding from the Bill & Melinda Gates Foundation to pay for time as a Research Officer on this project. R Buchbinder was partially funded by an Australian National Health and Medical Research Council (NHMRC) Practitioner Fellowship, Monash University, and Cabrini Health. P Burney and D Jarvis acknowledge that the Chronic Respiratory Disease group received funding from the BUPA Foundation; they had no role in study design, data collection, data analysis, data interpretation, decision to submit for publication, or preparation of the report. H Chen acknowledges that his role in the study was partly supported by the intramural research program of the National Institutes of Health (NIH)—the National Institute of Environmental Health Sciences—USA. M Cross and L March acknowledge the support of the Royal North Shore Hospital and the Institute of Bone and Joint Research, (University of Sydney). N Dahodwala was supported by NIH grant K23 AG034236 and the Parkinson Council while working on this project. L Degenhardt was supported by an Australian National Health and Medical Research Council (NHMRC) Senior Research Fellowship. T Driscoll was supported partly by funding from the National Occupational Health and Safety Commission (now Safework Australia). R Havmoeller was supported by a grant from the Swedish Research Council (#2011–1071). H W Hoek acknowledges support from three institutions: Parnassia Psychiatric Institute, The Hague, Netherlands; the Department of Psychiatry, University Medical Center Groningen, Netherlands; and the Department of Epidemiology, Columbia University, New York, NY, USA. D Hoy was supported by the Bill & Melinda Gates Foundation and the Australian National Health and Medical Research Council. K Pesudovs acknowledges institutional support from Flinders University. R Room’s position at the University of Melbourne and Turning Point Alcohol and Drug Centre is funded by the Foundation for Alcohol Research and Education and the Victorian Department of Health. U Sampson was supported by funding by the Harold Amos Medical Faculty Development Award of the Robert Wood Johnson Foundation and the Vanderbilt Clinical and Translational Scholars Award. L Sanchez-Riera acknowledges the Spanish Society of Rheumatology (Sociedad Española de Reumatología). M Segui-Gomez’s participation was partly supported by funding from the European Center for Injury Prevention, Universidad de Navarra. E Smith acknowledges the Department of Health and Ageing, Commonwealth Government of Australia, and Institute of Bone and Joint Research (IBJR; University of Sydney). W A Stolk received financial support from the Africa Programme for Onchocerciasis Control (WHO/APOC) for the work on onchocerciasis. D J Weatherall is supported by the Wellcome Trust UK, the Medical Research Council UK, and the Anthony Cerami and Ann Dunne Research Trust.
Footnotes
Conflicts of interest
A Davis is employed by the UK National Health Service and works for the UK Department of Health as lead adviser on audiology. E R Dorsey has been a consultant to Lundbeck and Medtronic and receives research support from Lundbeck and Prana Biotechnology. M Ezzati chaired a session and gave a talk at the World Cardiology Congress (WCC), with his travel cost reimbursed by the World Heart Federation; he also gave a talk at a session organized by PepsiCo with no financial or other remuneration. H Hoffman is a US Federal Government employee of the National Institutes of Health. G A Mensah is a former employee of PepsiCo. F Perez-Ruiz has been an adviser for Ardea, Menarini, Novartis, Metabolex; has been a member of a speaker’s bureau for Menarini and Novartis; has been an adviser on educational issues for Savient; has received investigation grants from the Spanish Health Ministry and Hospital de Cruces Rheumatology Association; and is the principal investigator in clinical trials for Ardea. The other authors declare that they have no conflicts of interest.
Contributor Information
Joshua A Salomon, Harvard School of Public Health, Harvard University, Boston, MA, USA.
Theo Vos, School of Population Health, University of Queensland, Brisbane, QLD, Australia.
Daniel R Hogan, Harvard School of Public Health, Harvard University, Boston, MA, USA.
Michael Gagnon, Harvard School of Public Health, Harvard University, Boston, MA, USA.
Mohsen Naghavi, Institute for Health Metrics and Evaluation, University of Washington, Seattle, WA, USA.
Ali Mokdad, Institute for Health Metrics and Evaluation, University of Washington, Seattle, WA, USA.
Nazma Begum, Johns Hopkins University, Baltimore, MD, USA.
Razibuzzaman Shah, Projahnmo-Shimantik, Dhaka, Bangladesh.
Mario Reyna Farje, Instituto Cuánto, Lima, Peru.
Gilberto Moncada, Instituto Cuánto, Lima, Peru.
Arup Dutta, Bloomberg School of Public Health, Johns Hopkins University, Baltimore, MD, USA.
Sunil Sazawal, Bloomberg School of Public Health, Johns Hopkins University, Baltimore, MD, USA.
Andrew Dyer, ICF International, Fairfax, VA, USA.
Jason Seiler, ICF International, Fairfax, VA, USA.
Victor Aboyans, Department of Cardiology, Dupuytren University Hospital, Limoges, France.
Lesley Baker, Institute for Health Metrics and Evaluation, University of Washington, Seattle, WA, USA.
Amanda Baxter, Queensland Centre for Mental Health Research, University of Queensland, Brisbane, QLD, Australia.
Emelia J Benjamin, Boston University, Boston, MA, USA.
Kavi Bhalla, Harvard University, Boston, MA, USA.
Aref Bin Abdulhak, King Fahad Medical City, Riyadh, Saudi Arabia.
Fiona Blyth, University of Sydney, Sydney, NSW, Australia.
Rupert Bourne, Vision and Eye Research Unit, Anglia Ruskin University, Cambridge, UK.
Tasanee Braithwaite, Moorfields Eye Hospital, London, UK.
Peter Brooks, University of Melbourne, Melbourne, VIC, Australia.
Traolach S Brugha, University of Leicester, Leicester, UK.
Claire Bryan-Hancock, Flinders University, Adelaide, SA, Australia.
Rachelle Buchbinder, Cabrini Institute, Malvern, VIC, Australia; Department of Epidemiology and Preventive Medicine, Monash University, Melbourne, VIC, Australia.
Peter Burney, Imperial College London, London, UK.
Bianca Calabria, National Drug and Alcohol Research Centre, University of New South Wales Sydney, NSW, Australia.
Honglei Chen, National Institute for Environmental Health Sciences, Research Triangle Park, NC, USA.
Sumeet S Chugh, Cedars-Sinai Medical Center, Los Angeles, CA, USA.
Rebecca Cooley, Institute for Health Metrics and Evaluation, University of Washington, Seattle, WA, USA.
Michael H Criqui, University of California San Diego, San Diego, CA, USA.
Marita Cross, University of Sydney, Sydney, NSW, Australia.
Kaustubh C Dabhadkar, Emory University, Atlanta, GA, USA.
Nabila Dahodwala, University of Pennsylvania, Philadelphia, PA, USA.
Adrian Davis, MRC Hearing and Communication Group, Manchester, UK.
Louisa Degenhardt, National Drug and Alcohol Research Centre, University of New South Wales Sydney, NSW, Australia; Centre for Health Policy, Programs, and Economics, University of Melbourne, Melbourne, VIC, Australia.
Cesar Díaz-Torné, Hospital de la Santa Creu i Sant Pau, Barcelona, Spain.
E Ray Dorsey, Johns Hopkins University, Baltimore, MD, USA.
Tim Driscoll, School of Population Health, University of Sydney, Sydney, NSW, Australia.
Karen Edmond, London School of Hygiene and Tropical Medicine, London, UK.
Alexis Elbaz, Inserm, Paris, France.
Majid Ezzati, MRC-HPA Centre for Environment and Health, London, UK; Department of Epidemiology and Biostatistics, School of Public Health, Imperial College London, London, UK.
Valery Feigin, National Institute for Stroke and Applied Neurosciences, Auckland University of Technology, Auckland, New Zealand.
Cleusa P Ferri, Federal University of São Paulo, São Paulo, Brazil.
Abraham D Flaxman, Institute for Health Metrics and Evaluation, University of Washington, Seattle, WA, USA.
Louise Flood, Flinders University, Adelaide, SA, Australia.
Marlene Fransen, Department of Rheumatology, Northern Clinical School, Faculty of Health Sciences, University of Sydney, Sydney, NSW, Australia.
Kana Fuse, National Institute of Population and Social Security Research, Department of Population Structure Research, Tokyo, Japan.
Belinda J Gabbe, Monash University, Melbourne, VIC, Australia.
Richard F Gillum, Howard University College of Medicine, Washington DC, USA.
Juanita Haagsma, Erasmus MC, University Medical Center Rotterdam, Netherlands.
James E Harrison, Flinders University, Adelaide, SA, Australia.
Rasmus Havmoeller, Cedars-Sinai Medical Center, Los Angeles, CA, USA; Karolinska University Hospital, Stockholm, Sweden.
Roderick J Hay, King’s College Hospital NHS Foundation Trust, King’s College London, London, UK.
Abdullah Hel-Baqui, Bloomberg School of Public Health, Johns Hopkins University, Baltimore, MD, USA.
Hans W Hoek, Parnassia Psychiatric Institute, The Hague, Netherlands.
Howard Hoffman, National Institute on Deafness and Other Communication Disorders, National Institutes of Health, Bethesda, MD, USA.
Emily Hogeland, University of California, San Francisco, San Francisco, CA, USA.
Damian Hoy, Department of Epidemiology and Preventive Medicine, Monash University, Melbourne, VIC, Australia.
Deborah Jarvis, Imperial College London, London, UK.
Jost B Jonas, Department of Ophthalmology, Medical Faculty Mannheim, Ruprecht Karls University, Heidelberg, Germany.
Ganesan Karthikeyan, All India Institute of Medical Sciences, New Delhi, India.
Lisa Marie Knowlton, Harvard Humanitarian Initiative, Harvard University, Boston, MA, USA.
Tim Lathlean, Flinders University, Adelaide, SA, Australia.
Janet L Leasher, Nova Southeastern University, Fort Lauderdale, FL, USA.
Stephen S Lim, Institute for Health Metrics and Evaluation, University of Washington, Seattle, WA, USA.
Steven E Lipshultz, Leonard M Miller School of Medicine, University of Miami, Miami, FL, USA.
Alan D Lopez, School of Population Health, University of Queensland, Brisbane, QLD, Australia.
Rafael Lozano, Institute for Health Metrics and Evaluation, University of Washington, Seattle, WA, USA.
Ronan Lyons, Swansea University, Swansea, UK.
Reza Malekzadeh, Digestive Disease Research Center, Tehran University of Medical Sciences, Tehran, Iran.
Wagner Marcenes, Queen Mary University of London, London, UK.
Lyn March, Institute of Bone and Joint Research, University of Sydney, Sydney, NSW, Australia.
David J Margolis, University of Pennsylvania, Philadelphia, PA, USA.
Neil McGill, University of Sydney, Sydney, NSW, Australia.
John McGrath, Queensland Brain Institute, University of Queensland, Brisbane, QLD, Australia.
George A Mensah, Department of Medicine, University of Cape Town, Cape Town, South Africa.
Ana-Claire Meyer, University of California, San Francisco, San Francisco, CA, USA.
Catherine Michaud, China Medical Board, Boston, MA, USA.
Andrew Moran, Columbia University, New York, NY, USA.
Rintaro Mori, National Center for Child Health and Development, Tokyo, Japan.
Michele E Murdoch, Watford General Hospital, Watford, UK.
Luigi Naldi, Centro Studi GISED, Bergamo, Italy.
Charles R Newton, University of Oxford, Oxford, UK.
Rosana Norman, School of Population Health, University of Queensland, Brisbane, QLD, Australia.
Saad B Omer, Emory University School of Public Health and Medicine, Atlanta, GA, USA.
Richard Osborne, Deakin University, Burwood, NSW, Australia.
Neil Pearce, London School of Hygiene and Tropical Medicine, London, UK.
Fernando Perez-Ruiz, Hospital Universitario Cruces, Barakaldo, Spain.
Norberto Perico, Mario Negri Institute for Pharmacological Research, Bergamo, Italy.
Konrad Pesudovs, Flinders University, Adelaide, SA, Australia.
David Phillips, Institute for Health Metrics and Evaluation, University of Washington, Seattle, WA, USA.
Farshad Pourmalek, Faculty of Medicine, School of Population and Public Health, University of British Columbia, Vancouver, BC, Canada.
Martin Prince, Institute of Psychiatry, King’s College London, London, UK.
Jürgen T Rehm, Centre for Addiction and Mental Health, Toronto, ON, Canada.
Guiseppe Remuzzi, Mario Negri Institute for Pharmacological Research, Bergamo, Italy.
Kathryn Richardson, Cambridge University, Cambridge, UK.
Robin Room, Centre for Alcohol Policy Research, Turning Point Alcohol and Drug Centre, Fitzroy, SA, Australia; School of Population Health, University of Melbourne, Melbourne, VIC, Australia.
Sukanta Saha, Queensland Centre for Mental Health Research, University of Queensland, Brisbane, QLD, Australia.
Uchechukwu Sampson, Vanderbilt University, Nashville, TN, USA.
Lidia Sanchez-Riera, Institut d’Investigacio Biomedica de Bellvitge, Barcelona, Spain; Institute of Bone and Joint Research, University of Sydney, Sydney, NSW, Australia.
Maria Segui-Gomez, Ministry of Interior, Government of Spain, Madrid, Spain.
Saeid Shahraz, Brandeis University, Waltham, MA, USA.
Kenji Shibuya, Department of Global Health Policy, University of Tokyo, Tokyo, Japan.
David Singh, Queens Medical Center, Honolulu, HI, USA.
Karen Sliwa, Hatter Institute, University of Cape Town, Cape Town, South Africa.
Emma Smith, Department of Rheumatology, Northern Clinical School, Faculty of Health Sciences, University of Sydney, Sydney, NSW, Australia.
Isabelle Soerjomataram, Public Health Department, University Medical Center Rotterdam, Netherlands.
Timothy Steiner, Norwegian University of Science and Technology, Trondheim, Norway.
Wilma A Stolk, Erasmus MC, University Medical Center Rotterdam, Netherlands.
Lars Jacob Stovner, Department of Neuroscience, Norwegian University of Science and Technology, Trondheim, Norway.
Christopher Sudfeld, Harvard School of Public Health, Harvard University, Boston, MA, USA.
Hugh R Taylor, University of Melbourne, Melbourne, VIC, Australia.
Imad M Tleyjeh, King Fahad Medical City, Riyadh, Saudi Arabia.
Marieke J van der Werf, KNCV Tuberculosis Foundation, The Hague, Netherlands.
Wendy L Watson, National Drug and Alcohol Research Centre, University of New South Wales Sydney, NSW, Australia.
David J Weatherall, University of Oxford, Oxford, UK.
Robert Weintraub, Critical Care and Neurosciences Theme, Murdoch Children’s Research Institute, Melbourne, VIC, Australia; Department of Pediatrics, Royal Children’s Hospital, University of Melbourne, Melbourne, VIC, Australia.
Marc G Weisskopf, Harvard School of Public Health, Harvard University, Boston, MA, USA.
Harvey Whiteford, Queensland Centre for Mental Health Research, University of Queensland, Brisbane, QLD, Australia.
James D Wilkinson, Leonard M Miller School of Medicine, University of Miami, Miami, FL, USA.
Anthony D Woolf, Royal Cornwall Hospital, Truro, UK.
Zhi-Jie Zheng, School of Public Health, Shanghai Jiao Tong University, Shanghai, China.
Christopher J L Murray, Institute for Health Metrics and Evaluation, University of Washington, Seattle, WA, USA.
References
- 1.Chamie M What does morbidity have to do with disability? Disabil Rehabil 1995; 17: 323–37. [DOI] [PubMed] [Google Scholar]
- 2.Grosse SD, Lollar DJ, Campbell VA, Chamie M. Disability and disability-adjusted life years: not the same. Public Health Rep 2009; 124: 197–202. [DOI] [PMC free article] [PubMed] [Google Scholar]
- 3.Leonardi M, Bickenbach J, Ustun TB, Kostanjsek N, Chatterji S, on behalf of the MHADIE Consortium. The definition of disability: what is in a name? Lancet 2006; 368: 1219–21. [DOI] [PubMed] [Google Scholar]
- 4.Thomas C How is disability understood? An examination of sociological approaches. Disabil Soc 2004; 19: 569–83. [Google Scholar]
- 5.Salomon JA, Mathers CD, Chatterji S, Sadana R, Ustun TB, Murray CJL. Quantifying individual levels of health: definitions, concepts and measurement issues. In: Murray CJL, Evans DB, eds. Health systems performance assessment: debates, methods and empiricism. Geneva: World Health Organization, 2003: 301–18. [Google Scholar]
- 6.Murray CJL, Ezzati M, Flaxman AD, et al. The Global Burden of Disease Study 2010: design, definitions, and metrics. Lancet 2012; 380: 2063–66. [DOI] [PubMed] [Google Scholar]
- 7.Murray CJL. Rethinking DALYs. In: Murray CJL, Lopez AD, eds. The global burden of disease: a comprehensive assessment of mortality and disability from diseases, injuries and risk factors in 1990 and projected to 2020. Cambridge, MA: Harvard School of Public Health, 1996: 1–98. [Google Scholar]
- 8.WHO. The world health report 1999—making a difference. Geneva: World Health Organization, 1999. [Google Scholar]
- 9.WHO. The world health report 2000—health systems: improving peformance. Geneva: World Health Organization, 2000. [Google Scholar]
- 10.WHO. The world health report 2001—mental health: new understanding, new hope. Geneva: World Health Organization, 2001. [Google Scholar]
- 11.WHO. The world health report 2002—reducing risks, promoting healthy life. Geneva: World Health Organization, 2002. [DOI] [PubMed] [Google Scholar]
- 12.WHO. The world health report 2003—shaping the future. Geneva: World Health Organization, 2003. [Google Scholar]
- 13.WHO. The world health report 2004—changing history. Geneva: World Health Organization, 2004. [Google Scholar]
- 14.WHO. The global burden of disease: 2004 update. Geneva: World Health Organization, 2008. [Google Scholar]
- 15.Mathers CD, Vos ET, Stevenson CE, Begg SJ. The Australian Burden of Disease Study: measuring the loss of health from diseases, injuries and risk factors. Med J Aust 2000; 172: 592–96. [DOI] [PubMed] [Google Scholar]
- 16.Mathers CD, Vos ET, Stevenson CE, Begg SJ. The burden of disease and injury in Australia. Bull World Health Organ 2001; 79: 1076–84. [PMC free article] [PubMed] [Google Scholar]
- 17.Chapman G, Hansen KS, Jelsma J, et al. The burden of disease in Zimbabwe in 1997 as measured by disability-adjusted life years lost. Trop Med Int Health 2006; 11: 660–71. [DOI] [PubMed] [Google Scholar]
- 18.Jankovic S, Vlajinac H, Bjegovic V, et al. The burden of disease and injury in Serbia. Eur J Public Health 2007; 17: 80–85. [DOI] [PubMed] [Google Scholar]
- 19.Stevens G, Dias RH, Thomas KJ, et al. Characterizing the epidemiological transition in Mexico: national and subnational burden of diseases, injuries, and risk factors. PLoS Med 2008; 5: e125. [DOI] [PMC free article] [PubMed] [Google Scholar]
- 20.Naghavi M, Abolhassani F, Pourmalek F, et al. The burden of disease and injury in Iran 2003. Popul Health Metr 2009; 7: 9. [DOI] [PMC free article] [PubMed] [Google Scholar]
- 21.Phua HP, Chua AV, Ma S, Heng D, Chew SK. Singapore’s burden of disease and injury 2004. Singapore Med J 2009; 50: 468–78. [PubMed] [Google Scholar]
- 22.Bundhamcharoen K, Odton P, Phulkerd S, Tangcharoensathien V. Burden of disease in Thailand: changes in health gap between 1999 and 2004. BMC Public Health 2011; 11: 53. [DOI] [PMC free article] [PubMed] [Google Scholar]
- 23.Stouthard ME, Essink-Bot ML, Bonsel G, Barendregt J, Kramers P. Disability weights for diseases in the Netherlands. Rotterdam: Erasmus University, 1997. [Google Scholar]
- 24.Stouthard MEA, Essink-Bot ML, Bonsel GJ. Disability weights for diseases: a modified protocol and results for a Western European region. Eur J Public Health 2000; 10: 24–30. [Google Scholar]
- 25.Melse JM, Essink-Bot ML, Kramers PG, Hoeymans N, on behalf of the Dutch Burden of Disease Group. A national burden of disease calculation: Dutch disability-adjusted life-years. Am J Public Health 2000; 90: 1241–47. [DOI] [PMC free article] [PubMed] [Google Scholar]
- 26.Arnesen T, Nord E. The value of DALY life: problems with ethics and validity of disability adjusted life years. BMJ 1999; 319: 1423–25. [DOI] [PMC free article] [PubMed] [Google Scholar]
- 27.Bedirhan Üstün T, Rehm J, Chatterji S, et al. Multiple-informant ranking of the disabling effects of different health conditions in 14 countries. Lancet 1999; 354: 111–15. [DOI] [PubMed] [Google Scholar]
- 28.Bedirhan Üstün T, Saxena S, Rehm J, Bickenbach J, on behalf of the WHO/NIH Joint Project CAR Study Group. Are disability weights universal?. Lancet 1999; 354: 1306. [PubMed] [Google Scholar]
- 29.Groce NE. Disability in cross-cultural perspective: rethinking disability. Lancet 1999; 354: 756–57. [DOI] [PubMed] [Google Scholar]
- 30.Jelsma J, Chivaura VG, Mhundwa K, De Weerdt W, de Cock P. The global burden of disease disability weights. Lancet 2000; 355: 2079–80. [DOI] [PubMed] [Google Scholar]
- 31.AbouZahr C, Vaughan JP. Assessing the burden of sexual and reproductive ill-health: questions regarding the use of disability-adjusted life years. Bull World Health Organ 2000; 78: 655–66. [PMC free article] [PubMed] [Google Scholar]
- 32.Bastian H A consumer trip into the world of the DALY calculations: an Alice-in-Wonderland experience. Reprod Health Matters 2000; 8: 113–16. [DOI] [PubMed] [Google Scholar]
- 33.Metts RL. The fatal flaw in the disability adjusted life year. Disabil Soc 2001; 16: 449–52. [Google Scholar]
- 34.Jelsma J, De Weerdt W, De Cock P. Disability Adjusted Life Years (DALYs) and rehabilitation. Disabil Rehabil 2002; 24: 378–82. [DOI] [PubMed] [Google Scholar]
- 35.Mansley EC, Elbasha EH. Preferences and person trade-offs: forcing consistency or inconsistency in health-related quality of life measures? Health Econ 2003; 12: 187–98. [DOI] [PubMed] [Google Scholar]
- 36.Allotey P, Reidpath D, Kouame A, Cummins R. The DALY, context and the determinants of the severity of disease: an exploratory comparison of paraplegia in Australia and Cameroon. Soc Sci Med 2003; 57: 949–58. [DOI] [PubMed] [Google Scholar]
- 37.Reidpath DD, Allotey PA, Kouame A, Cummins RA. Measuring health in a vacuum: examining the disability weight of the DALY. Health Policy Plan 2003; 18: 351–56. [DOI] [PubMed] [Google Scholar]
- 38.Mont D Measuring health and disability. Lancet 2007; 369: 1658–63. [DOI] [PubMed] [Google Scholar]
- 39.King CH, Bertino AM. Asymmetries of poverty: why global burden of disease valuations underestimate the burden of neglected tropical diseases. PLoS Negl Trop Dis 2008; 2: e209. [DOI] [PMC free article] [PubMed] [Google Scholar]
- 40.Rehm J, Frick U. Valuation of health states in the US study to establish disability weights: lessons from the literature. Int J Methods Psychiatr Res 2010; 19: 18–33. [DOI] [PMC free article] [PubMed] [Google Scholar]
- 41.Brouwer WB, Koopmanschap MA. On the economic foundations of CEA: ladies and gentlemen, take your positions! J Health Econ 2000; 19: 439–59. [DOI] [PubMed] [Google Scholar]
- 42.Brouwer WB, Culyer AJ, van Exel NJ, Rutten FF. Welfarism vs extra-welfarism. J Health Econ 2008; 27: 325–38. [DOI] [PubMed] [Google Scholar]
- 43.Hausman DM. Valuing health: a new proposal. Health Econ 2010; 19: 280–96. [DOI] [PubMed] [Google Scholar]
- 44.Brock DW. Separate spheres and indirect benefits. Cost Eff Resour Alloc 2003; 1: 4. [DOI] [PMC free article] [PubMed] [Google Scholar]
- 45.UN General Assembly. International Covenant on Economic, Social and Cultural Rights. New York, NY: UN General Assembly, 1966. [Google Scholar]
- 46.Backman G, Hunt P, Khosla R, et al. Health systems and the right to health: an assessment of 194 countries. Lancet 2008; 372: 2047–85. [DOI] [PubMed] [Google Scholar]
- 47.Perehudoff S. Health, essential medicines, human rights and national constitutions. Amsterdam: Vrije Universiteit Amsterdam, 2008. [Google Scholar]
- 48.Broome J Measuring the burden of disease by aggregating well-being. In: Murray CJL, Salomon JA, Mathers CD, Lopez AD, eds. Summary measures of population health: concepts, ethics, measurement and applications. Geneva: World Health Organization, 2002: 91–113. [Google Scholar]
- 49.Brock D The separability of health and well-being. In: Murray CJL, Salomon JA, Mathers CD, Lopez AD, eds. Summary measures of population health: concepts, ethics, measurement and applications. Geneva: World Health Organization, 2002: 115–20. [Google Scholar]
- 50.Hausman DM. Health, well-being, and measuring the burden of disease. Popul Health Metr 2012; 10: 13. [DOI] [PMC free article] [PubMed] [Google Scholar]
- 51.Murray CJ, Salomon JA, Mathers C. A critical examination of summary measures of population health. Bull World Health Organ 2000; 78: 981–94. [PMC free article] [PubMed] [Google Scholar]
- 52.Richardson J Cost utility analysis: what should be measured? Soc Sci Med 1994; 39: 7–21. [DOI] [PubMed] [Google Scholar]
- 53.Torrance GW. Measurement of health state utilities for economic appraisal. J Health Econ 1986; 5: 1–30. [DOI] [PubMed] [Google Scholar]
- 54.Nord E Methods for quality adjustment of life years. Soc Sci Med 1992; 34: 559–69. [DOI] [PubMed] [Google Scholar]
- 55.Froberg DG, Kane RL. Methodology for measuring health-state preferences—II: scaling methods. J Clin Epidemiol 1989; 42: 459–71. [DOI] [PubMed] [Google Scholar]
- 56.Krabbe PF, Essink-Bot ML, Bonsel GJ. The comparability and reliability of five health-state valuation methods. Soc Sci Med 1997; 45: 1641–52. [DOI] [PubMed] [Google Scholar]
- 57.Osterdal LP. The lack of theoretical support for using person trade-offs in QALY-type models. Eur J Health Econ 2009; 10: 429–36. [DOI] [PubMed] [Google Scholar]
- 58.van Osch SM, Wakker PP, van den Hout WB, Stiggelbout AM. Correcting biases in standard gamble and time tradeoff utilities. Med Decis Making 2004; 24: 511–17. [DOI] [PubMed] [Google Scholar]
- 59.Doctor JN, Bleichrodt H, Lin HJ. Health utility bias: a systematic review and meta-analytic evaluation. Med Decis Making 2010; 30: 58–67. [DOI] [PubMed] [Google Scholar]
- 60.Froberg DG, Kane RL. Methodology for measuring health-state preferences—III: population and context effects. J Clin Epidemiol 1989; 42: 585–92. [DOI] [PubMed] [Google Scholar]
- 61.Gold M, Siegel J, Russell L, Weinstein M. Cost-effectiveness in health and medicine: report of the Panel on Cost-Effectiveness in Health and Medicine. New York, NY: Oxford University Press, 1996. [Google Scholar]
- 62.Dolan P Whose preferences count? Med Decis Making 1999; 19: 482–86. [DOI] [PubMed] [Google Scholar]
- 63.Dolan P, Olsen JA, Menzel P, Richardson J. An inquiry into the different perspectives that can be used when eliciting preferences in health. Health Econ 2003; 12: 545–51. [DOI] [PubMed] [Google Scholar]
- 64.Dolan P The effect of experience of illness on health state valuations. J Clin Epidemiol 1996; 49: 551–64. [DOI] [PubMed] [Google Scholar]
- 65.Salomon JA, Murray CJL. A conceptual framework for understanding adaptation, coping and adjustment in health state evaluations. In: Murray CJL, Salomon JA, Mathers CD, Lopez AD, eds. Summary measures of population health: concepts, ethics, measurement and applications. Geneva: World Health Organization, 2002: 619–26. [Google Scholar]
- 66.Menzel P, Dolan P, Richardson J, Olsen JA. The role of adaptation to disability and disease in health state valuation: a preliminary normative analysis. Soc Sci Med 2002; 55: 2149–58. [DOI] [PubMed] [Google Scholar]
- 67.Hadorn DC. The role of public values in setting health care priorities. Soc Sci Med 1991; 32: 773–81. [DOI] [PubMed] [Google Scholar]
- 68.Schwarzinger M, Stouthard ME, Burstrom K, Nord E. Cross-national agreement on disability weights: the European Disability Weights Project. Popul Health Metr 2003; 1: 9. [DOI] [PMC free article] [PubMed] [Google Scholar]
- 69.Essink-Bot ML, Pereira J, Packer C, Schwarzinger M, Burstrom K. Cross-national comparability of burden of disease estimates: the European Disability Weights Project. Bull World Health Organ 2002; 80: 644–52. [PMC free article] [PubMed] [Google Scholar]
- 70.Kruijshaar ME, Barendregt JJ. The breast cancer related burden of morbidity and mortality in six European countries: the European Disability Weights project. Eur J Public Health 2004; 14: 141–46. [DOI] [PubMed] [Google Scholar]
- 71.McKenna MT, Michaud CM, Murray CJ, Marks JS. Assessing the burden of disease in the United States using disability-adjusted life years. Am J Prev Med 2005; 28: 415–23. [DOI] [PubMed] [Google Scholar]
- 72.Yoon SJ, Bae SC, Lee SI, et al. Measuring the burden of disease in Korea. J Korean Med Sci 2007; 22: 518–23. [DOI] [PMC free article] [PubMed] [Google Scholar]
- 73.Lai T, Habicht J, Kiivet RA. Measuring burden of disease in Estonia to support public health policy. Eur J Public Health 2009; 19: 541–47. [DOI] [PubMed] [Google Scholar]
- 74.Baltussen RM, Sanon M, Sommerfeld J, Wurthwein R. Obtaining disability weights in rural Burkina Faso using a culturally adapted visual analogue scale. Health Econ 2002; 11: 155–63. [DOI] [PubMed] [Google Scholar]
- 75.Sadana R Measurement of variance in health state valuations in Phnom Penh, Cambodia. In: Murray CJL, Salomon JA, Mathers CD, Lopez AD, eds. Summary measures of population health: concepts, ethics, measurement and applications. Geneva: World Health Organization, 2002: 593–618. [Google Scholar]
- 76.Mahapatra P, Salomon JA, Nanda L. Measuring health state values in developing countries: results from a community survey in Andhra Pradesh. In: Murray CJ, Salomon JA, Mathers CD, Lopez AD, eds. Summary measures of population health: concepts, ethics, measurement and applications. Geneva: World Health Organization, 2002: 473–85. [Google Scholar]
- 77.Kruijshaar ME, Hoeymans N, Spijker J, Stouthard ME, Essink-Bot ML. Has the burden of depression been overestimated? Bull World Health Organ 2005; 83: 443–48. [PMC free article] [PubMed] [Google Scholar]
- 78.van Spijker BA, van Straten A, Kerkhof AJ, Hoeymans N, Smit F. Disability weights for suicidal thoughts and non-fatal suicide attempts. J Affect Disord 2011; 134: 341–47. [DOI] [PubMed] [Google Scholar]
- 79.Hong KS, Saver JL. Quantifying the value of stroke disability outcomes: WHO global burden of disease project disability weights for each level of the modified Rankin Scale. Stroke 2009; 40: 3828–33. [DOI] [PMC free article] [PubMed] [Google Scholar]
- 80.Haagsma JA, van Beeck EF, Polinder S, Hoeymans N, Mulder S, Bonsel GJ. Novel empirical disability weights to assess the burden of non-fatal injury. Inj Prev 2008; 14: 5–10. [DOI] [PubMed] [Google Scholar]
- 81.Haagsma JA, Polinder S, van Beeck EF, Mulder S, Bonsel GJ. Alternative approaches to derive disability weights in injuries: do they make a difference? Qual Life Res 2009; 18: 657–65. [DOI] [PubMed] [Google Scholar]
- 82.Brennan DS, Spencer AJ. Mapping oral health related quality of life to generic health state values. BMC Health Serv Res 2006; 6: 96. [DOI] [PMC free article] [PubMed] [Google Scholar]
- 83.Brennan DS, Spencer AJ, Roberts-Thomson KF. Quality of life and disability weights associated with periodontal disease. J Dent Res 2007; 86: 713–17. [DOI] [PubMed] [Google Scholar]
- 84.King CH, Dickman K, Tisch DJ. Reassessment of the cost of chronic helmintic infection: a meta-analysis of disability-related outcomes in endemic schistosomiasis. Lancet 2005; 365: 1561–69. [DOI] [PubMed] [Google Scholar]
- 85.Jia TW, Zhou XN, Wang XH, Utzinger J, Steinmann P, Wu XH. Assessment of the age-specific disability weight of chronic schistosomiasis japonica. Bull World Health Organ 2007; 85: 458–65. [DOI] [PMC free article] [PubMed] [Google Scholar]
- 86.Finkelstein JL, Schleinitz MD, Carabin H, McGarvey ST. Decision-model estimation of the age-specific disability weight for schistosomiasis japonica: a systematic review of the literature. PLoS Negl Trop Dis 2008; 2: e158. [DOI] [PMC free article] [PubMed] [Google Scholar]
- 87.Qian MB, Chen YD, Fang YY, et al. Disability weight of Clonorchis sinensis infection: captured from community study and model simulation. PLoS Negl Trop Dis 2011; 5: e1377. [DOI] [PMC free article] [PubMed] [Google Scholar]
- 88.Baqui AH, El-Arifeen S, Darmstadt GL, et al. Effect of community-based newborn-care intervention package implemented through two service-delivery strategies in Sylhet district, Bangladesh: a cluster-randomised controlled trial. Lancet 2008; 371: 1936–44. [DOI] [PubMed] [Google Scholar]
- 89.Sazawal S, Black RE, Ramsan M, et al. Effects of routine prophylactic supplementation with iron and folic acid on admission to hospital and mortality in preschool children in a high malaria transmission setting: community-based, randomised, placebo-controlled trial. Lancet 2006; 367: 133–43. [DOI] [PubMed] [Google Scholar]
- 90.Mokdad AH. The Behavioral Risk Factors Surveillance System: past, present, and future. Annu Rev Public Health 2009; 30: 43–54. [DOI] [PubMed] [Google Scholar]
- 91.Campeau L Grading of angina pectoris. Circulation 1976; 54: 522–23. [PubMed] [Google Scholar]
- 92.The Criteria Committee of the New York Heart Association. Nomenclature and critera for diagnosis of diseases of the heart and great vessels, 9th edn. Boston, MA: Little Brown, 1994. [Google Scholar]
- 93.Bradley RA. Science, statistics, and paired comparisons. Biometrics 1976; 32: 213–39. [PubMed] [Google Scholar]
- 94.Salomon JA, Murray CJL, Ustun TB, Chatterji S. Health state valuations in summary measures of population health. In: Murray CJL, Evans DB, eds. Health systems performance assessment: debate, methods, and empiricism. Geneva: World Health Organization, 2003: 409–36. [Google Scholar]
- 95.de Bekker-Grob EW, Hol L, Donkers B, et al. Labeled versus unlabeled discrete choice experiments in health economics: an application to colorectal cancer screening. Value Health 2010; 13: 315–23. [DOI] [PubMed] [Google Scholar]
- 96.Sullivan PW, Ghushchyan V. Mapping the EQ-5D index from the SF-12: US general population preferences in a nationally representative sample. Med Decis Making 2006; 26: 401–09. [DOI] [PMC free article] [PubMed] [Google Scholar]
- 97.McIntosh CN, Gorber SC, Bernier J, Berthelot JM. Eliciting Canadian population preferences for health states using the Classification and Measurement System of Functional Health (CLAMES). Chronic Dis Can 2007; 28: 29–41. [PubMed] [Google Scholar]
- 98.Nyman JA, Barleen NA, Dowd BE, Russell DW, Coons SJ, Sullivan PW. Quality-of-life weights for the US population: self-reported health status and priority health conditions, by demographic characteristics. Med Care 2007; 45: 618–28. [DOI] [PubMed] [Google Scholar]
- 99.Sullivan PW, Slejko JF, Sculpher MJ, Ghushchyan V. Catalogue of EQ-5D scores for the United Kingdom. Med Decis Making 2011; 31: 800–04. [DOI] [PubMed] [Google Scholar]
- 100.Vos T, Flaxman AD, Naghavi M, et al. Years lived with disability (YLD) for 1160 sequelae of 289 diseases and injuries 1990–2010: a systematic analysis for the Global Burden of Disease Study 2010. Lancet 2012; 380: 2163–96. [DOI] [PMC free article] [PubMed] [Google Scholar]
Associated Data
This section collects any data citations, data availability statements, or supplementary materials included in this article.