

Abstract
The study aimed to characterize the natural history of pain experience, concurrently considering intermittent and constant pain over 4 years and determine baseline factors associated with unfavorable trajectories in individuals with chronic knee pain. The OAI (Osteoarthritis Initiative) is a prospective, observational study of people with or at higher risk for knee osteoarthritis. The Intermittent and Constant Osteoarthritis Pain (ICOAP) was assessed annually at 48-to-96-month OAI visits. Twenty-eight baseline sociodemographic, knee-specific, and health-related characteristics were assessed. Group-based dual-trajectory modeling identified pain experience patterns indicated by ICOAP intermittent and constant pain scores over 4 years. Multivariable multinomial logistic regression models determined baseline factors associated with membership in each dual-trajectory group. Four longitudinal pain experience patterns were identified [n=3584, mean age=64.8 (SD 9.0) years, BMI=28.6 (5.0) kg/m2; 57.9% women]. Group 1 (37.7%) had minimal intermittent and no constant pain; Group 2 (35.1%) mild intermittent and no constant pain; Group 3 (18.5%) mild intermittent and low-grade constant pain; and Group 4 (8.7%) moderate intermittent and constant pain. Baseline widespread pain, knee stiffness, back pain, hip pain, ankle pain, obesity, depressive symptoms, more advanced radiographic disease, and analgesic use were each associated with an increased risk of membership in less favorable Groups 2–4. These distinct courses of pain experience may be driven by different underlying pain mechanisms. The benchmarked ICOAP scores could be used to stratify patients and tailor management. Addressing and preventing the development of modifiable risks (e.g., widespread pain, knee joint stiffness), may reduce the chance of belonging to unfavorable dual-trajectory groups.
Keywords: Knee Osteoarthritis, Pain, Natural History, Dual Trajectory, Intermittent and constant osteoarthritis pain
INTRODUCTION
Pain is the most common symptom of knee osteoarthritis (OA). The pain experience in persons with chronic knee symptoms is complex, multidimensional, variable, and individualized1. Large inter-person variability in the response to exercises, analgesics, and surgeries may be attributable to heterogeneous pain characteristics and underlying pain mechanisms in affected individuals2.
Persons with knee OA typically experience two distinct types of pain: (1) intermittent/episodic pain that comes and goes and (2) constant background pain this is punctuated by short, more intense episodes of intermittent pain3. However, longitudinal studies of natural history of knee pain have generally overlooked this and have solely focused on pain intensity assessed by the Numeric Pain Rating Scale (NPRS)4 or the Pain Subscale of the Western Ontario and McMaster Universities OA Index (WOMAC)5,6. Additionally, the single dimension of pain intensity does not fully capture the complexity of what a person with chronic knee pain experiences.
The Intermittent and Constant OA Pain (ICOAP) instrument comprehensively evaluates the pain experience in persons with knee OA by assessing pain intensity and frequency as well as its impact on mood, sleep, and quality of life, separately for intermittent and constant pain3,7. The ICOAP is the only instrument that considers these two distinct types of pain experience and has been found to be a reliable and responsive measure for both8,9. Intermittent and constant pain may be driven by different mechanisms and need to be managed differently10,11. For example, intermittent pain may arise from peripherally driven nociceptive input, whereas constant pain may suggest central sensitization11.
To understand the natural history of pain experience in persons with chronic knee symptoms, we employed an innovative approach that modeled co-occurring trajectories of intermittent knee pain experience and constant knee pain experience, using data from the longitudinal Osteoarthritis Initiative (OAI). Our objectives were to characterize dual (co-occurring) pain experience trajectories – using ICOAP intermittent pain score and ICOAP constant pain score - over a 4-year follow-up period and to identify baseline factors associated with unfavorable trajectories in persons with or at higher risk for knee OA.
METHODS
Study Sample.
The Osteoarthritis Initiative (OAI) is a multicenter, prospective, longitudinal observational cohort study including 4796 men and women, ages 45–79 years, with or at increased risk to develop symptomatic, radiographic knee OA. To be eligible for the OAI, participants were required to have, at enrollment, symptomatic knee OA [defined as the presence in at least one knee at baseline: pain, aching, or stiffness in or around the knee on most days for at least one month during the past 12 months; and a definite tibiofemoral osteophyte, i.e., Kellgren Lawrence grade (K/L) ≥ 2] or characteristics that placed them at increased risk for developing symptomatic knee OA. Annual OAI evaluations began in 2004 at four study sites: Baltimore, MD; Columbus, OH; Pittsburgh, PA; and Pawtucket, RI. The Institutional Review Board at each site approved the OAI, and all participants gave written informed consent. OAI data are publicly available at https://nda.nih.gov/oai/. Our analysis sample included OAI participants who had ICOAP intermittent and constant pain scores at the 48-month visit (our study baseline) and at least two follow-up scores at 60-, 72-, 84-, and 96-month visits.
Assessment of Intermittent and Constant Osteoarthritis Pain (ICOAP).
The ICOAP questionnaire is a multi-dimensional measure designed to evaluate the intermittent and constant pain experience, such as pain intensity and frequency, and its impact on mood (e.g., “frustrated or annoyed” and “upset or worried”), sleep, and quality of life, in persons with knee OA. It is a valid3,12,13, reliable3,13,14, and responsive3,15,16 measure to capture pain experience in people with knee OA. The ICOAP questionnaire was administered at the 48-, 60-, 72-, 84-, and 96-month OAI visits, separately assessing the right and left knees.
The 6-item ICOAP intermittent pain component queries the intermittent knee pain experience in the past week, each scored on a Likert scale of 0 to 4 (0 indicating the best and 4 the worst pain experience), with a raw score range of 0 to 24. The raw score is then transformed to a final score out of 100 (score range 0–100, a higher score indicating a worse intermittent pain experience). The 5-item ICOAP constant pain component queries the constant knee pain experience in the past week, each scored on a Likert scale of 0 to 4, with a raw score range of 0 to 20. Similarly, the ICOAP constant pain raw score is transformed to a final score of 0 to 100 with a higher score indicating worse constant pain experience. Recognizing that knee OA frequently affects both knees and that which knee is more painful may shift from one side to the other, we focused on the more painful knee as driving the person’s pain experience at a given time. For each participant, the worse of the ICOAP intermittent pain scores between two knees and the worse of the ICOAP constant pain scores between two knees at 48-, 60-, 72-, 84-, and 96-month OAI visits were used to determine the dual-trajectory patterns over 4 years.
Assessment of Baseline Sociodemographic, Knee-specific, and Health-related Characteristics.
OAI participants were comprehensively characterized at our baseline (48-month OAI visit) for this analysis. Race (White or Caucasian, Black or African American, Asian, and Other non-White) and ethnicity (Hispanic/Latino vs. nonHispanic/Latino) were by self-report; educational level by self-report (less than high school, high school graduate, some college, college graduate, some graduate school, and graduate degree); marital status by self-report (married, widowed, separated, divorced, and never married). Employment status (yes vs. no) was assessed by questions on whether respondents currently do any paid or unpaid work. BMI (kg/m2) was computed using measured body weight and height. Comorbidity was assessed by an adapted, self-report version of Charlson Comorbidity Index (range: 0–10, with higher scores indicating a greater number of comorbidities)17; depressive symptoms by the Center for Epidemiologic Studies Depression Scale (CES-D) (range: 0–60, ≥16 defined as having depressive symptoms)18.
Knee OA disease severity by Kellgren/Lawrence (K/L) grade (range: 0–4) was evaluated centrally by two experts, blinded to each other’s reading and all other data. Knee pain severity was scored with the Western Ontario and McMaster Universities Osteoarthritis Index (WOMAC)19 Pain subscale (range: 0–20, with high scores indicating more severe pain), stiffness was scored using the WOMAC Stiffness subscale (range: 0–8, with high scores indicating more severe stiffness, physical function was scored using the WOMAC Physical Function subscale (range: 0–68, with high scores indicating worse function). Knee pain, symptoms, and quality of life were measured by the Knee Injury and Osteoarthritis Outcome Score (KOOS)20 (range for each: 0–100, with a higher score indicating worse status).
Widespread pain is the presence of self-reported symptoms in each of the 5 body regions (i.e., right upper extremity, left upper extremity, right lower extremity, left lower extremity, and axial skeleton)21,22. The OAI questionnaire included body maps for participants to identify other joint symptoms (pain, aching, or stiffness) occurring at least half of the days in the past month. These body maps covered the axial skeleton of the neck, upper back, middle back, and lower back; the right/left upper extremity of the shoulder, elbow, wrist, and hand/finger, and the right/left lower extremity of the ankle and foot. The presence (vs. absence) of right/left knee pain and right/left hip pain were separately assessed. Participants who reported pain in at least one site of each of the 5 body regions at the 48-month OAI visit (our study baseline) were considered having widespread pain.
Individual items in the KOOS knee-related quality of life subscale assessed the presence of lacking knee confidence and modifying lifestyle to avoid potentially knee-damaging activities20. Restless sleep was assessed using an item in CES-D questionnaire18,23. Gait speed (m/s) was quantified during a 20-meter walk. Chair stand rate (# per minute) was calculated based on the time required for 5 repetitions of rising from a chair and sitting down. The presence of back pain (yes vs. no) was defined as having neck or upper/middle/lower back pain, aching, or stiffness for at least half of the days in the past month. Similar questions were used for hip, ankle, and foot pain. Pain medication use (yes vs. no) was queried by “Have you used medication for knee pain, aching, or stiffness more than half the days of a month in the past 12 months?”. Weekly hours spent in 5 activity categories (walking, strength/endurance exercises, light, moderate, and strenuous sport/recreation) were derived from items in the Physical Activity Scale for the Elderly (PASE) questionnaire24.
Statistical Analyses.
We included OAI participants who had baseline (48-month OAI visit) and at least two subsequent follow-up ICOAP scores in the analysis and assumed missing at random for those who did not have a least 2 follow-up ICOAP scores. First, we conducted group-based dual-trajectory modeling to identify distinct pain experience trajectories indicated by continuous scores of ICOAP intermittent and constant pain, using the traj package in Stata (Stata/SE17 for Windows, StataCorp LLC)25,26. Group-based dual-trajectory modeling tracks the course of multiple measures related to the same underlying construct (pain experience, in this case) jointly over time and identifies latent clusters of individuals following similar trajectories across these measures25. It is an application of finite mixture modeling with maximum likelihood estimation, assuming missing happens at random. The model selection was based on both goodness-of-fit and model parsimony. We started the selection process by fitting models with one to five groups with a cubic polynomial model over time for all groups for each pain outcome. A zero Inflated Poisson model was applied to account for a large number of zeros in ICOAP pain measures. The optimal number of groups was then decided based on the Bayesian Information Criterion (BIC), trajectory shapes for similarity, and the proportion of cohort members in each class. To obtain a parsimonious model, the level of the polynomial for each group was reduced until a parameter estimate in the highest polynomial function had a p-value < 0.01 (see Supplemental Table 1). Finally, following Nagin27, we verified the adequacy of the selected model by examining whether the following criteria were met: the average posterior probabilities of trajectory membership for each group ≥ 0.7, odds of correct classification ≥ 5, and the proportion of a sample assigned to a certain group is close to the proportion estimated from the model.
Second, we identified baseline factors associated with membership in each of the pain experience dual-trajectory patterns, using a multivariable multinomial logistic regression model with group 1 as reference. The initial multivariable model was created by including variables with a p-value ≤ 0.20 in the univariable model for each baseline factor, adjusting for age, sex, and BMI. We checked for multicollinearity, included clinically meaningful/important variables, and applied backward selection model building to develop the final most parsimonious model. Relative risk ratios and 95% confidence intervals were used to summarize model findings.
RESULTS
The study sample consisted of 3584 OAI participants who had baseline and at least 2 follow-up ICOAP scores over the 4-year follow-up period. See Figure 1 for study sample derivation. The sample mean age was 64.8 (SD 9.0) years, BMI 28.6 (5.0) kg/m2; 57.9% were women. We identified four distinct dual-trajectory patterns of ICOAP intermittent and constant pain experience scores over the 4-year follow-up period (Figure 2). Scores remained relatively stable over the 4-year follow-up period. Group 1 (n = 1349, 37.7%) included participants with minimal intermittent pain and no constant pain experience; Group 2 (n = 1259, 35.1%), mild (i.e., around 20 on the 0–100 scale) intermittent pain and no constant pain experience; Group 3 (n = 664, 18.5%), mild (i.e., around 20 on the 0–100 scale) intermittent pain and low-grade constant pain experience (i.e., around 10 on the 0–100 scale); and Group 4 (n = 312, 8.7%), moderate intermittent pain experience (i.e., around 40 on the 0–100 scale) and moderate constant pain experience (i.e., 30 to 40 on the 0–100 scale). Table 1 summarizes baseline demographic and health-related variables for the full study sample and by four ICOAP dual-trajectory patterns.
Figure 1.

Study Sample Derivations
Figure 2. Four distinct dual-trajectory patterns of ICOAP Intermittent Pain and ICOAP Constant Pain over a 4-year follow-up period (n = 3584).
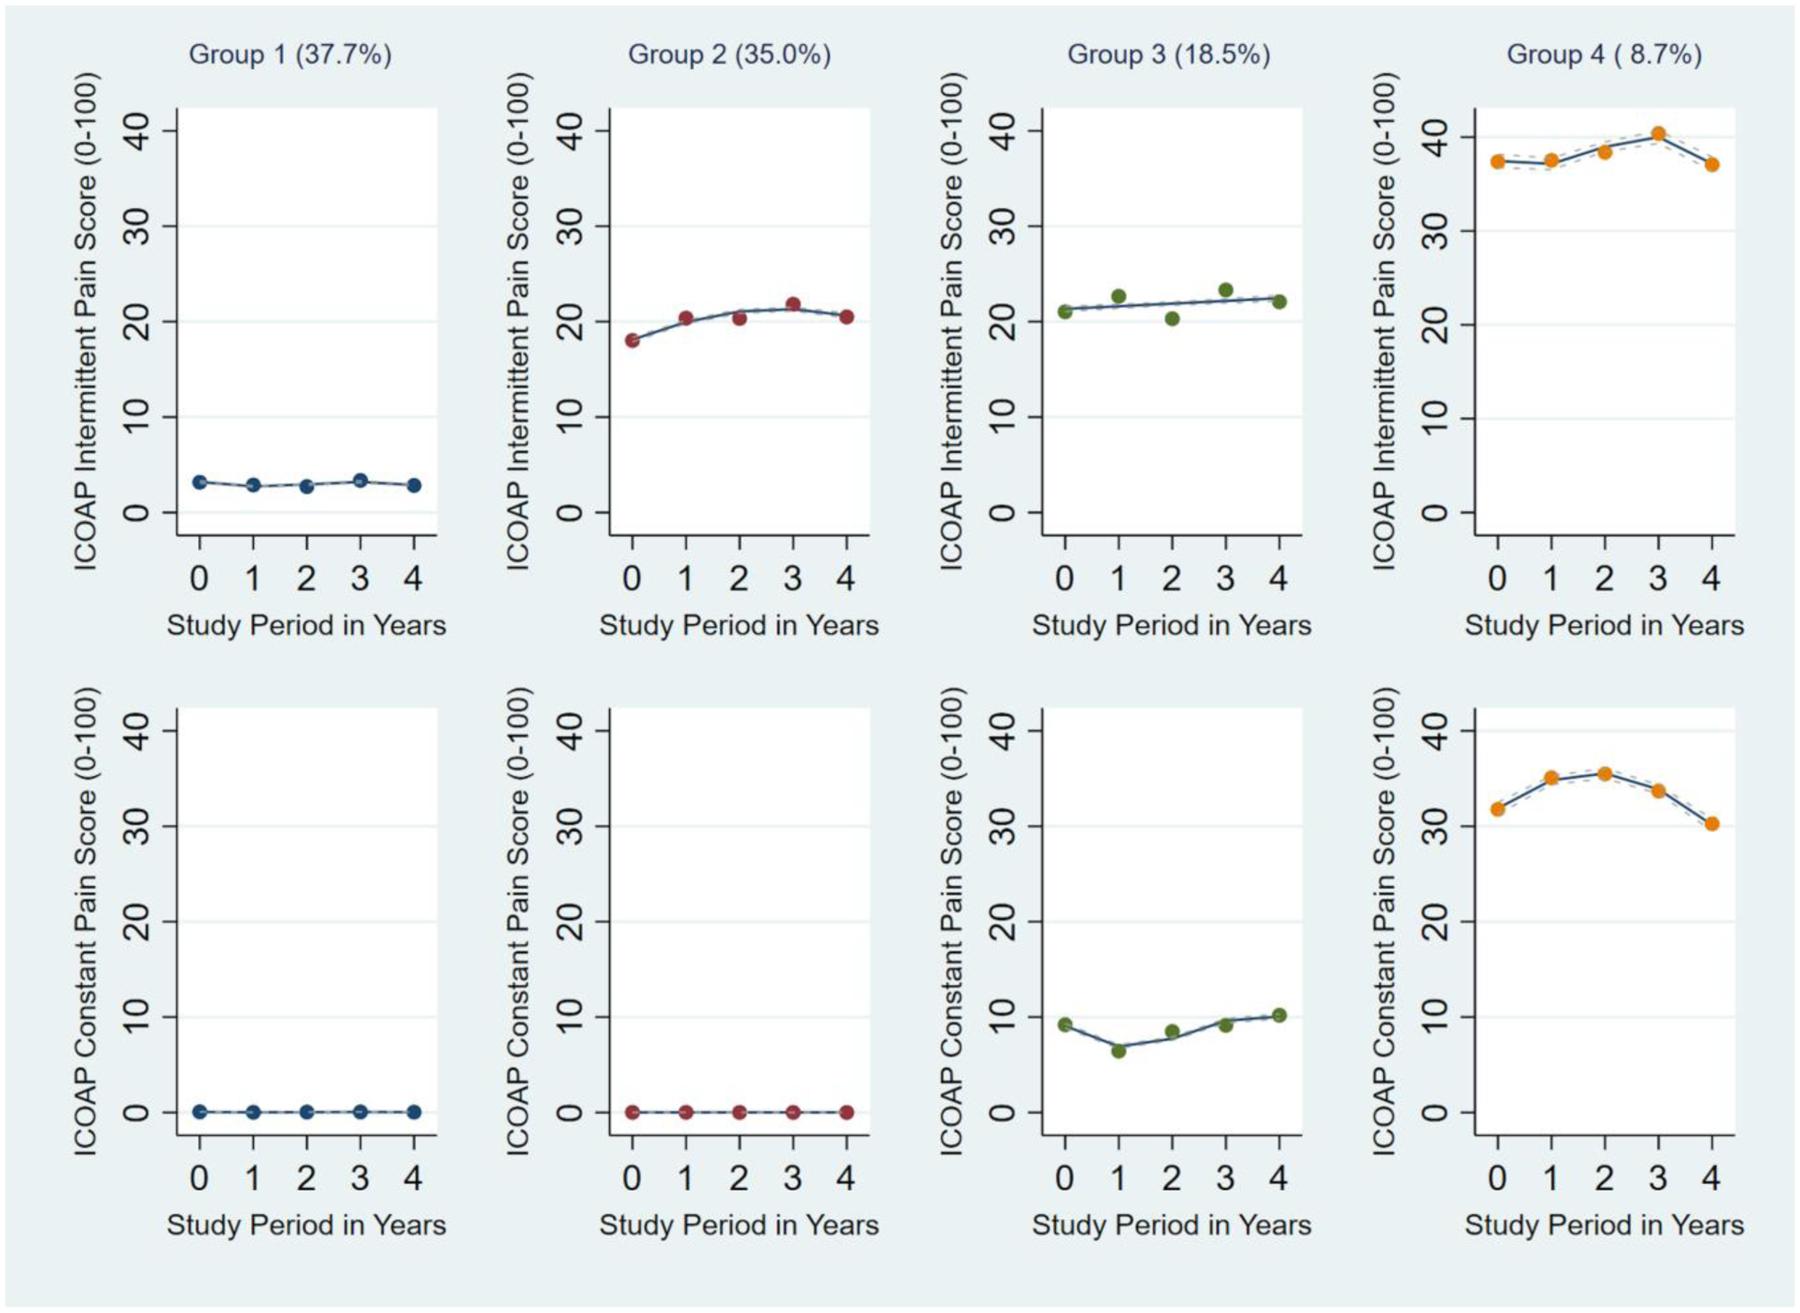
The top panels display trajectories of intermittent pain experience; the bottom panels display trajectories of constant pain experience. Actual (dot) and estimated (solid line) ICOAP scores are plotted at each time point. The associated 95% confidence intervals (CIs) for each line are shown in dotted lines. Group 1 (n = 1349, 37.7%) includes participants with minimal intermittent pain and no constant pain; Group 2 (n = 1259, 35.1%), mild (i.e., around 20 on the 0–100 scale) intermittent pain and no constant pain; Group 3 (n = 664, 18.5%), mild (i.e., around 20) intermittent pain and low-grade constant pain (i.e., around 10); and Group 4 (n = 312, 8.7%), moderate intermittent pain (i.e., around 40) and mild-to-moderate constant pain (i.e., 30 to 40). All 95% CI widths were relatively narrow. For example, on the 0–100 scale, the 95% CI widths for Group 1 intermittent pain ranged from 0.18 to 0.20, constant pain from 0.02 to 0.03; Group 2 intermittent pain from 0.47 to 0.52, constant pain from 0.01 to 0.01; Group 3 intermittent pain from 0.70 to 0.74, constant pain from 0.39 to 0.50; Group 4 intermittent pain from 1.36 to 1.43, constant pain from 1.25 to 1.36.
Table 1.
Baseline demographic and health-related variables, mean (standard deviation) or number (%)
| By ICOAP dual trajectory subgroup | ||||||
|---|---|---|---|---|---|---|
| Variable | Entire sample (n = 3584) |
Group 1 n = 1349 (37.7%) |
Group 2 n = 1259 (35.1%) |
Group 3 n = 664 (18.5%) |
Group 4 n = 312 (8.7%) |
P values |
| Age (years) | 64.84 (8.99) | 65.97 (9.12) | 64.88 (8.93) | 63.56 (8.90) | 62.51 (8.09) | <.0001 |
| Women | 2075 (57.9%) | 751 (55.7%) | 756 (60.1%) | 368 (55.4%) | 200 (64.1%) | .0084 |
| BMI (kg/m2) | 28.62 (4.97) | 27.27 (4.50) | 28.78 (4.82) | 29.59 (5.02) | 31.76 (5.43) | <.0001 |
| Education (≥ college graduate) | 2245 (62.9%) | 931 (69.2%) | 800 (63.8%) | 393 (59.5%) | 121 (39.3%) | <.0001 |
| Race | <.0001 | |||||
| White/Caucasian | 2911 (81.3%) | 1160 (86.1%) | 1065 (84.7%) | 516 (77.7%) | 170 (54.5%) | |
| Black or African American | 595 (16.6%) | 164 (12.2%) | 163 (13.0%) | 140 (21.1%) | 128 (41.0%) | |
| Asian | 24 (0.7%) | 13 (1.0%) | 7 (0.6%) | 1 (0.2%) | 3 (1.0%) | |
| Other non-white | 51 (1.4%) | 11 (0.8%) | 22 (1.8%) | 7 (1.1%) | 11 (3.5%) | |
| Ethnicity | ||||||
| Hispanic/Latino | 39 (1.1%) | 12 (0.9%) | 17 (1.4%) | 8 (1.2%) | 2 (0.6%) | 0.5800 |
| Marital status (married) | 2404 (67.2%) | 946 (70.2%) | 833 (66.2%) | 458 (69.1%) | 167 (53.5%) | <.0001 |
| Employment (employed) | 2003 (56.0%) | 746 (55.5%) | 688 (54.7%) | 400 (60.2%) | 169 (54.2%) | .10 |
| Comorbidities (≥ 2) | 460 (12.8%) | 145 (10.8%) | 157 (12.5%) | 79 (11.9%) | 79 (25.4%) | <.0001 |
| Depressive symptoms (yes) | 417 (11.7%) | 78 (5.8%) | 152 (12.1%) | 83 (12.5%) | 104 (33.3%) | <.0001 |
| K/L grade | <.0001 | |||||
| 0 | 982 (27.5%) | 476 (35.5%) | 316 (25.2%) | 138 (20.8%) | 52 (16.8%) | |
| 1 | 580 (16.3%) | 277 (20.7%) | 188 (15.0%) | 84 (12.7%) | 31 (10.0%) | |
| 2 | 1043 (29.2%) | 369 (27.5%) | 383 (30.6%) | 204 (30.7%) | 87 (28.2%) | |
| 3 | 703 (19.7%) | 182 (13.6%) | 268 (21.4%) | 164 (24.7%) | 89 (28.8%) | |
| 4 | 259 (7.3%) | 37 (2.8%) | 98 (7.8%) | 74 (11.1%) | 50 (16.2%) | |
| WOMACa pain (0–20) | 2.81 (3.47) | 0.61 (1.25) | 2.78 (2.59) | 4.50 (3.32) | 8.94 (4.11) | <.0001 |
| WOMAC stiffness (0–8) | 1.63 (1.71) | 0.59 (0.98) | 1.78 (1.55) | 2.38 (1.61) | 3.96 (1.67) | <.0001 |
| WOMAC function (0–68) | 8.63 (11.24) | 1.82 (4.11) | 8.41 (8.76) | 13.52 (10.65) | 28.56 (13.46) | <.0001 |
| KOOSb pain (0–100) | 82.56 (18.24) | 95.28 (7.33) | 81.76 (13.51) | 72.97 (16.89) | 51.02 (18.97) | <.0001 |
| KOOS symptoms (0–100) | 84.03 (16.29) | 94.07 (7.85) | 83.26 (13.73) | 76.54 (16.13) | 59.69 (17.84) | <.0001 |
| KOOS quality of life (0–100) | 72.51 (22.00) | 88.38 (13.83) | 69.07 (16.95) | 62.05 (19.07) | 39.99 (19.43) | <.0001 |
| Lack of knee confidence (yes) | 598 (16.7%) | 40 (3.0%) | 186 (14.8%) | 172 (25.9%) | 200 (64.1%) | <.0001 |
| Modified lifestyle to avoid knee damaging activities (yes) | 862 (24.1%) | 98 (7.3%) | 314 (24.9%) | 237 (35.7%) | 213 (68.3%) | <.0001 |
| Restless sleep (yes) | 600 (16.8%) | 145 (10.8%) | 221 (17.6%) | 135 (20.4%) | 99 (31.7%) | <.0001 |
| Gait speed (m/s) | 1.31 (0.22) | 1.35 (0.21) | 1.31 (0.21) | 1.31 (0.21) | 1.16 (0.23) | <.0001 |
| Chair stand rate (# per min) | 30.07 (11.51) | 32.98 (10.79) | 29.58 (11.43) | 28.33 (11.09) | 23.12 (11.83) | <.0001 |
| Back pain (yes) | 2116 (59.2%) | 625 (46.5%) | 813 (64.7%) | 431 (64.9%) | 247 (79.4%) | <.0001 |
| Hip pain (yes) | 862 (24.1%) | 206 (15.3%) | 329 (26.2%) | 202 (30.4%) | 125 (40.1%) | <.0001 |
| Ankle pain (yes) | 735 (20.5%) | 146 (10.8%) | 271 (21.5%) | 185 (27.9%) | 133 (42.6%) | <.0001 |
| Foot pain (yes) | 773 (21.6%) | 176 (13.1%) | 283 (22.5%) | 175 (26.4%) | 139 (44.6%) | <.0001 |
| Widespread pain (yes) | 573 (16.0%) | 69 (5.1%) | 231 (18.4%) | 161 (24.3%) | 112 (35.9%) | <.0001 |
| Pain medication use (yes) | 1581 (44.1%) | 254 (18.8%) | 627 (49.8%) | 440 (66.3%) | 260 (83.3%) | <.0001 |
| Self-reported physical activity (hr/wk) | ||||||
| Walking | 4.32 (5.44) | 4.73 (5.50) | 3.96 (5.10) | 4.32 (5.69) | 4.01 (5.88) | .0028 |
| Strength/endurance ex. | 1.27 (2.36) | 1.36 (2.54) | 1.31 (2.36) | 1.22 (2.16) | 0.90 (1.94) | .0201 |
| Light sport/recreation | 0.85 (2.89) | 0.79 (2.72) | 0.81 (2.51) | 1.09 (3.70) | 0.78 (3.00) | .14 |
| Moderate sport/recreation | 0.60 (2.26) | 0.71 (2.55) | 0.57 (2.08) | 0.52 (2.02) | 0.46 (2.19) | .17 |
| Strenuous sport/recreation | 1.22 (2.90) | 1.43 (3.09) | 1.15 (2.87) | 1.19 (2.80) | 0.68 (2.30) | .0003 |
WOMAC (Western Ontario and McMaster Universities Osteoarthritis Index), high scores indicate worse status;
KOOS (Knee Injury and Osteoarthritis Outcome Score), high scores indicate better status.
Group 1: minimal intermittent pain and no constant pain
Group 2: mild intermittent pain and no constant pain
Group 3: mild intermittent pain and low-grade constant pain
Group 4: moderate constant pain and moderate intermittent pain
Table 2 shows the results of the multivariable multinomial logistic regression model for baseline predictors associated with membership in each of the four dual-trajectory patterns. Having widespread pain, knee joint stiffness, back pain, hip pain, ankle pain, obesity, depressive symptoms, more advanced radiographic disease (≥ K/L grade 3), and use of pain medication were each associated with an increased likelihood of membership in the less favorable Groups 2–4 (reference group: Group 1); and older age and female sex with a reduced likelihood. Depressive symptoms, comorbidities, and slow walking speed were each associated with an increased likelihood of membership in the worst group (Group 4 vs. 1). Supplemental Tables 2 and 3 show the logistic regression results when using alternative reference groups, such as Group 2 (Supplemental Table 2) and Group 3 (Supplemental Table 3).
Table 2. Associations of baseline predictors (independent variables) with membership in each of the four dual trajectory groups.
Adjusted relative risk ratios (95% confidence intervals) from multivariable multinomial logistic regression models (Reference group: Group 1) n = 3584
| Baseline predictors | Group 2 | Group 3 | Group 4 |
|---|---|---|---|
| Age (per 5-year increase) | 0.90 (0.85, 0.95) | 0.82 (0.77, 0.88) | 0.71 (0.64, 0.79) |
| Sex (women vs. men) | 0.97 (0.80, 1.16) | 0.70 (0.56, 0.88) | 0.64 (0.46, 0.90) |
| BMI | |||
| overweight vs. normal | 1.23 (0.99, 1.53) | 1.40 (1.05, 1.89) | 1.58 (0.94, 2.65) |
| obese vs. normal | 1.32 (1.03, 1.68) | 1.50 (1.10, 2.06) | 1.95 (1.17, 3.25) |
| Widespread pain (yes vs. no) | 1.85 (1.35, 2.56) | 2.30 (1.60, 3.29) | 2.48 (1.59, 3.85) |
| Pain in other body regions | |||
| Back pain (yes vs. no) | 1.58 (1.31, 1.89) | 1.39 (1.10, 1.77) | 2.16 (1.47, 3.17) |
| Hip pain (yes vs. no) | 1.35 (1.08, 1.70) | 1.56 (1.19, 2.04) | 1.60 (1.11, 2.31) |
| Ankle pain (yes vs. no) | 1.48 (1.15, 1.90) | 1.86 (1.39, 2.48) | 2.32 (1.60, 3.38) |
| Pain medication use (yes vs. no) | 2.49 (2.05, 3.04) | 4.01 (3.15, 5.09) | 6.26 (4.25, 9.23) |
| WOMACa stiffness (per unit increase) | 1.70 (1.57, 1.83) | 2.03 (1.87, 2.22) | 3.11 (2.76, 3.51) |
| Depressive symptoms (yes vs. no) | 1.60 (1.15, 2.23) | 1.48 (1.003, 2.19) | 2.82 (1.79, 4.43) |
| Comorbidity (≥ vs. < 2) | 1.20 (0.90, 1.59) | 1.22 (0.86, 1.75) | 2.21 (1.41, 3.44) |
| Gait speed (per 0.1 m/s increase) | 0.96 (0.92, 1.01) | 0.95 (0.90, 1.01) | 0.77 (0.71, 0.84) |
| K/L grade | |||
| 1 vs. 0 | 0.91 (0.70, 1.18) | 0.94 (0.66, 1.33) | 0.82 (0.46, 1.47) |
| 2 vs. 0 | 1.23 (0.97, 1.55) | 1.38 (1.02, 1.87) | 1.11 (0.69, 1.78) |
| 3&4 vs. 0 | 1.70 (1.31, 2.21) | 2.22 (1.60, 3.06) | 2.32 (1.44, 3.74) |
Bold fonts indicate statistically significant odds ratio with associated 95% confidence interval that excludes 1.0.
WOMAC (Western Ontario and McMaster Universities Osteoarthritis Index), high scores indicate worse status.
Group 1: minimal intermittent pain and no constant pain
Group 2: mild intermittent pain and no constant pain
Group 3: mild intermittent pain and low-grade constant pain
Group 4: moderate constant pain and moderate intermittent pain
WOMAC pain, stiffness, and function were not included in the same model due to their strong correlation with each other (Pearson correlation coefficients were 0.85 for pain/function, 0.74 for stiffness/function, and 0.70 for pain/stiffness). Sensitivity analyses of models replacing WOMAC stiffness with WOMAC pain or function yielded similar findings (data not shown).
DISCUSSION
Four longitudinal pain experience patterns in 3584 participants with or at elevated risk for knee OA were identified. Group 1 (37.7%) had minimal intermittent and constant pain experience; Group 2 (35.1%) had mild intermittent pain, but no constant pain experience; Group 3 (18.5%) had mild intermittent pain and low-grade constant pain experience; Group 4 (8.7%) had moderate intermittent pain and moderate constant pain experience. To our knowledge, this is the first study that has profiled the natural history of pain experience in knee OA by concurrently characterizing intermittent and constant pain, using group-based dual-trajectory modeling.
In contrast to those in Group 1, who did not experience intermittent or constant pain, individuals in less favorable dual-trajectory groups (Groups 2–4) demonstrated a higher likelihood of widespread pain, knee joint stiffness, obesity, advanced radiographic disease, back pain, hip pain, ankle pain, and analgesic use. Compared to Groups 1, 2, or 3, participants with moderate intermittent pain plus moderate constant pain (i.e., Group 4) were more likely to experience worse joint stiffness, increased analgesic use, depressive symptoms, comorbidities, and slower walking speed. Addressing and preventing development of modifiable risks, such as widespread pain and knee joint stiffness, may reduce the chance of belonging to unfavorable dual-trajectory groups.
The longitudinal course of knee pain has traditionally been studied by assessing pain intensity using tools such as the WOMAC pain score5,6,28 or NPRS4. Acknowledging the multi-dimensional nature and temporal patterns of chronic pain, the present study aimed to go beyond the limitations of previous research and provide a more comprehensive understanding of individuals’ pain experience over time. By taking into account various dimensions of pain (i.e., pain experience that encompasses intensity, frequency, and their impact on mood, sleep, and quality of life) and temporal pain patterns, our study used a fresh approach of concurrently tracking intermittent and constant pain experience over 4 years. Consistent with other studies examining the evolution of pain intensity over time5,6, we found relatively stable dual-trajectory patterns of the intermittent and constant pain experience, over a 4-year follow-up, suggesting these patterns may be slow to change. The knee pain experience may be influenced by factors such as physical activity levels, self-efficacy, coping strategies, and other psychological, social, and environmental variables. Individuals may develop adaptive strategies or coping mechanisms to keep their pain experience at an acceptable level. They may avoid or limit activities that exacerbate pain, use assistive devices or knee braces, take more analgesics, or seek medical management or support groups. Individuals living with chronic pain frequently encounter episodic flares that typically last between 5 to 8 days before subsiding and returning to their pre-flare state29,30. Since ICOAP pain experience was assessed annually in the OAI, we were unable to examine more granular pain patterns. Nevertheless, the stable patterns identified in our findings may reflect the enduring consistency of chronic pain over the long term, despite periodic interruptions caused by acute flares.
Considerable variations in clinical presentations and mechanisms underlying disease development and progression, coupled with the availability of large cohort data have motivated an ongoing endeavor in identifying knee OA subgroups and associated mechanisms and outcomes. Using latent class analysis of cross-sectional data, several studies31–35 have suggested a chronic/persistent pain phenotype characterized by central sensitization and alterations in pain neurobiology (e.g., lower pressure pain thresholds, inefficient conditioned pain modulation, or facilitated temporal summation). A recent study showed that the presence of ICOAP-measured constant pain in older adults with knee OA was cross-sectionally related to greater pain sensitivity and potential nociplastic pain mechanism, manifested by lower pressure pain thresholds at the knee and the wrist11. These data offer mechanistic insights into chronic/persistent pain phenotype, although pain was measured at only one time point. Our approach enabled a better understanding of how pain experience evolved or persisted over time by tracking pain experience across 5 time points over 4 years. Among the 4 dual-trajectory patterns identified, one group (Group 3, 18.5% of the analysis sample) had persistent low-grade constant pain at 10 out of 100, and the other (Group 4, 8.7%) had persistent moderate constant pain at 30–40 out of 100, possibly signifying greater pain sensitization in 27.2% in this cohort.
We found that baseline widespread pain was consistently associated with membership in the unfavorable dual-trajectory groups, when compared to Group 1. While knee-specific pain is extensively investigated, multi-site musculoskeletal pain and its mechanisms and impacts have attracted growing interest22,36. Widespread pain was present in 16% of our full analysis sample; the prevalence incrementally increased by groups (Group 1: 5%, Group 2: 18%; Group 3: 24%, Group 4: 36%), highlighting the potential significance of widespread pain in people with chronic knee symptoms. Widespread pain could be caused by knee OA-related gait alterations that overload ipsilateral lower limb joints and/or the contralateral side. Our analysis showed a high prevalence of hip and ankle pain, and it progressively increased with worsening ICOAP dual-trajectory groups. However, this postulation does not explain the presence of bilateral upper limb pain. On the other hand, the spread of pain could stem from heightened sensitivity in the central nervous system, leading to diffuse hyperalgesia and/or allodynia37. Elevated psychological distress and poor sleep could also contribute to greater pain sensitivity and spreading. This is supported by our finding of an independent association between the presence of depressive symptoms and a greater risk of worse pain experience. We did not find a link between restless sleep (assessed by one question in our study) and worse pain experience. A more comprehensive measure of sleep quality and quantity may better elucidate this relationship.
There was a dose-response relationship between baseline joint stiffness and worse ICOAP pain experience. For example, for every unit increase in the WOMAC stiffness score, we found a 1.7 times increased risk (compared to Group 1) of belonging to Group 2, 2.03 increased risk to Group 3, and 3.11 increased risk to Group 4. Joint stiffness is a common and potentially debilitating symptom that can impact an individual’s quality of life38. It can be particularly noticeable after periods of inactivity. Osteophytes, synovial thickening, and decreased flexibility of articular and surrounding tissues may lead to discomfort and reduced range of motion39. Our results emphasize the importance of addressing joint stiffness in addition to knee pain to improve the pain experience. Stretching, joint mobilization, regular movement breaks to prevent stiff joints, and normalizing knee motion during gait and functional activities may help improve stiffness and maintain mobility.
Those in the moderate intermittent and constant pain experience group (Group 4) had significantly reduced walking speed (mean:1.16 m/s, SD:0.23) compared to the other three groups. For every 0.1 m/s increase in gait speed, there was about a 23% reduction in the risk of belonging to Group 4 (reference: Group 1). Similarly, about a 20% lower risk was observed when comparing Group 4 vs. 2 and Group 4 vs. 3, respectively. Walking speed is a functional vital sign for general health40,41. Our results that slower gait speed predicted the worst dual trajectory are noteworthy, as walking speed has been primarily linked to mortality and poor function40–42, but not to the longitudinal pain experience. Slow gait speed may indicate functional impairments, comorbidities, lower limb symptoms, or low levels of physical activity. Slow gait speed remained a strong, independent predictor after accounting for these factors in the multivariable models. Routine clinical assessment of gait speed may aid in identifying patients at risk for poor course of pain experience and facilitate early management.
Younger age was associated with less favorable trajectories. This may relate to a longer duration of chronic pain with greater acceptance of it as part of daily life in older vs. younger participants. Younger participants may have been more troubled by their knee pain than older participants. Further, older participants may have more frequently adapted activity choices and level to avoid pain. Next, univariable analysis suggested that women may be more likely to belong to the unfavorable trajectory groups. However, multivariable models suggested that women were less likely to belong to these trajectory groups. Prior research has not consistently demonstrated a clear and clinically meaningful pattern of sex differences in sensitivity to experimentally induced pain43. Differences between men and women may relate to other factors, such as the presence of a robust social support system44, individual choice to downplay their pain to avoid being perceived as weak or to prevent inconveniencing other people45.
Chronic knee pain is complex and heterogeneous. Different pain mechanisms may underlie variations in pain experience tracked over time. Stratifying pain experience may guide toward tailored treatment strategy and/or intensity of care and away from the oversimplified approach of managing pain as a homogeneous condition. The benchmarked ICOAP scores in these dual trajectories could assist clinical decision-making regarding overall management strategy and intensity of care. For instance, an individual with an intermittent pain score at around 40 and a constant pain score greater than 30 may signify a maladaptive pain mechanism and psychological features that require more resource allocation and multimodal biopsychosocial interventions. Whereas those with zero constant pain and 0-to-20 intermittent pain may only need a brief intervention that includes education, self-management instructions/advice, and exercise programs. A stratified care model has been advocated for other chronic musculoskeletal conditions, such as low back pain46,47.
Our study has significant strengths. This is the first investigation of the natural history of knee pain experience identified by modeling the concurrent evolution of both intermittent and constant pain experience. The 95% confidence intervals for each dual trajectory were relatively narrow, indicating high precision for the estimated trajectories in our study. Clinicians could use the established ICOAP scores in these dual trajectories to classify patients and determine an appropriate level of care and resource allocation. Additionally, the study leveraged the data from the OAI, a well-characterized, comprehensively assessed, multiple community–recruited cohort followed over an extended period.
There are limitations in this study. Pain catastrophizing48 and self-efficacy49 have been linked to elevated pain intensity, but these features were not collected in the OAI, precluding us from assessing their independent role in the natural history of pain experience. There is likely a bidirectional relationship between sleep disturbance and pain experience23. In our study, the presence of restless sleep (yes vs. no) was used as a basic indicator of poor sleep. A more comprehensive sleep assessment, such as the Pittsburgh Sleep Quality Index50, may better elucidate the sleep-pain connection. Although quantitative sensory testing (QST) measures were not collected in the OAI cohort, the presence of widespread pain may be a clinical manifestation of central sensitization37. Our findings that widespread pain was associated with worse pain experience trajectories is in keeping with a possible role for central sensitization in the natural history of the pain experience in knee OA. Finally, a follow-up period greater than 4 years would allow for a more extensive assessment of longer-term progression of pain experience.
In this study of 3584 participants with or at elevated risk for knee OA, four distinct patterns of longitudinal pain experience were identified. To our knowledge, this is the first investigation that has profiled the pain experience in knee OA by concurrently characterizing intermittent and constant pain using group-based dual-trajectory modeling. These four patterns may be driven by different underlying mechanisms and need to be managed differently. The benchmarked ICOAP intermittent and constant pain experience scores in each dual-trajectory pattern could potentially be a valuable tool for clinical decision-making and implementing a stratified care model. Addressing and preventing development of modifiable risks, such as widespread pain, knee joint stiffness, and slow walking speed, may reduce the chance of belonging to unfavorable dual-trajectory groups.
Supplementary Material
HIGHLIGHTS.
Prior research on the natural history of chronic knee pain solely focused on pain intensity.
Intermittent and Constant OA Pain (ICOAP) captures multi-dimensional and temporal pain experience.
Group-based dual trajectory modeled concurrent intermittent vs. constant ICOAP scores over 4 yrs.
Four longitudinal ICOAP pain experience dual trajectories were identified.
Benchmarked ICOAP scores could aid in stratifying patients for tailored management strategy.
PERSPECTIVE.
Concurrently tracking intermittent versus constant pain experience, group-based dual-trajectory modeling identified 4 distinct pain experience patterns over 4 years. The benchmarked Intermittent and Constant OA Pain (ICOAP) scores in these dual trajectories could aid in stratifying patients for tailored management strategy and intensity of care.
DISCLOSURES
The authors would like to thank OAI participants and study site investigators and coordinators for their contribution to the study.
Dr. Alison Chang had full access to all the data in the study and takes responsibility for the integrity of the data and the accuracy of the data analysis.
Concept and design: Chang and Sharma.
Acquisition, analysis, or interpretation of data: All authors.
Drafting of the manuscript: Chang.
Critical revision of the manuscript for important intellectual content: All authors.
Statistical analysis: Almagor, Lee, and Song.
The work was supported in part by grants from the National Institute of Arthritis and Musculoskeletal and Skin Diseases, National Institute of Health (P30-AR072579).
The authors declare no conflict of interest in work related to this manuscript.
OAI data are publicly available at https://nda.nih.gov/oai/.
Footnotes
Publisher's Disclaimer: This is a PDF file of an article that has undergone enhancements after acceptance, such as the addition of a cover page and metadata, and formatting for readability, but it is not yet the definitive version of record. This version will undergo additional copyediting, typesetting and review before it is published in its final form, but we are providing this version to give early visibility of the article. Please note that, during the production process, errors may be discovered which could affect the content, and all legal disclaimers that apply to the journal pertain.
REFERENCES
- 1.Hurley M, Dickson K, Hallett R, et al. Exercise interventions and patient beliefs for people with hip, knee or hip and knee osteoarthritis: a mixed methods review. Cochrane Database Syst Rev. 2018;4:CD010842. doi: 10.1002/14651858.CD010842.pub2 [DOI] [PMC free article] [PubMed] [Google Scholar]
- 2.Edwards RR, Dworkin RH, Turk DC, et al. Patient phenotyping in clinical trials of chronic pain treatments: IMMPACT recommendations. Pain. 2016;157(9):1851–1871. doi: 10.1097/j.pain.0000000000000602 [DOI] [PMC free article] [PubMed] [Google Scholar]
- 3.Hawker GA, Stewart L, French MR, et al. Understanding the pain experience in hip and knee osteoarthritis--an OARSI/OMERACT initiative. Osteoarthritis and Cartilage. 2008;16(4):415–422. doi: 10.1016/j.joca.2007.12.017 [DOI] [PubMed] [Google Scholar]
- 4.Bastick AN, Wesseling J, Damen J, et al. Defining knee pain trajectories in early symptomatic knee osteoarthritis in primary care: 5-year results from a nationwide prospective cohort study (CHECK). Br J Gen Pract. 2016;66(642):e32–e39. doi: 10.3399/bjgp15X688129 [DOI] [PMC free article] [PubMed] [Google Scholar]
- 5.Collins JE, Katz JN, Dervan EE, Losina E. Trajectories and risk profiles of pain in persons with radiographic, symptomatic knee osteoarthritis: data from the osteoarthritis initiative. Osteoarthritis and Cartilage. 2014;22(5):622–630. doi: 10.1016/j.joca.2014.03.009 [DOI] [PMC free article] [PubMed] [Google Scholar]
- 6.Nicholls E, Thomas E, van der Windt DA, Croft PR, Peat G. Pain trajectory groups in persons with, or at high risk of, knee osteoarthritis: findings from the Knee Clinical Assessment Study and the Osteoarthritis Initiative. Osteoarthritis and Cartilage. 2014;22(12):2041–2050. doi: 10.1016/j.joca.2014.09.026 [DOI] [PMC free article] [PubMed] [Google Scholar]
- 7.Hawker GA, Davis AM, French MR, et al. Development and preliminary psychometric testing of a new OA pain measure--an OARSI/OMERACT initiative. Osteoarthritis and Cartilage. 2008;16(4):409–414. doi: 10.1016/j.joca.2007.12.015 [DOI] [PMC free article] [PubMed] [Google Scholar]
- 8.Turner KV, Moreton BM, Walsh DA, Lincoln NB. Reliability and responsiveness of measures of pain in people with osteoarthritis of the knee: a psychometric evaluation. Disabil Rehabil. 2017;39(8):822–829. doi: 10.3109/09638288.2016.1161840 [DOI] [PMC free article] [PubMed] [Google Scholar]
- 9.Moreton BJ, Wheeler M, Walsh DA, Lincoln NB. Rasch analysis of the intermittent and constant osteoarthritis pain (ICOAP) scale. Osteoarthritis Cartilage. 2012;20(10):1109–1115. doi: 10.1016/j.joca.2012.06.011 [DOI] [PMC free article] [PubMed] [Google Scholar]
- 10.Crow JA, Fillingim RB. Working toward mechanistic pain phenotyping in osteoarthritis. Osteoarthritis Cartilage. 2022;30(4):495–497. doi: 10.1016/j.joca.2021.11.018 [DOI] [PubMed] [Google Scholar]
- 11.Carlesso LC, Law LF, Wang N, et al. Association of Pain Sensitization and Conditioned Pain Modulation to Pain Patterns in Knee Osteoarthritis. Arthritis Care Res (Hoboken). 2022;74(1):107–112. doi: 10.1002/acr.24437 [DOI] [PMC free article] [PubMed] [Google Scholar]
- 12.Hawker GA, Mian S, Kendzerska T, French M. Measures of adult pain. Arthritis Care Res (Hoboken). 2011;63 Suppl 11:S240–252. doi: 10.1002/acr.20543 [DOI] [PubMed] [Google Scholar]
- 13.Manolarakis GE, Kontodimopoulos N, Sifaki-Pistolla D, Niakas D. Establishing the Psychometric Properties of the ICOAP Questionnaire through Intra-Articular Treatment of Osteoarthritic Pain: Implementation for the Greek Version. Arthritis. 2016;2016:6201802. doi: 10.1155/2016/6201802 [DOI] [PMC free article] [PubMed] [Google Scholar]
- 14.Singh JA, Luo R, Landon GC, Suarez-Almazor M. Reliability and Clinically Important Improvement Thresholds for Osteoarthritis Pain and Function scales: A Multicenter study. J Rheumatol. 2014;41(3):509–515. doi: 10.3899/jrheum.130609 [DOI] [PMC free article] [PubMed] [Google Scholar]
- 15.Davis AM, Lohmander LS, Wong R, Venkataramanan V, Hawker GA. Evaluating the responsiveness of the ICOAP following hip or knee replacement. Osteoarthritis and Cartilage. 2010;18(8):1043–1045. doi: 10.1016/j.joca.2010.04.013 [DOI] [PubMed] [Google Scholar]
- 16.Risser RC, Hochberg MC, Gaynor PJ, D’Souza DN, Frakes EP. Responsiveness of the Intermittent and Constant Osteoarthritis Pain (ICOAP) scale in a trial of duloxetine for treatment of osteoarthritis knee pain. Osteoarthritis and Cartilage. 2013;21(5):691–694. doi: 10.1016/j.joca.2013.02.007 [DOI] [PubMed] [Google Scholar]
- 17.Katz JN, Chang LC, Sangha O, Fossel AH, Bates DW. Can comorbidity be measured by questionnaire rather than medical record review? Med Care. 1996;34(1):73–84. [DOI] [PubMed] [Google Scholar]
- 18.Vilagut G, Forero CG, Barbaglia G, Alonso J. Screening for depression in the general population with the Center for Epidemiologic Studies Depression (CES-D): A systematic review with meta-analysis. PLoS One. 2016;11(5). doi: 10.1371/journal.pone.0155431 [DOI] [PMC free article] [PubMed] [Google Scholar]
- 19.Bellamy N, Buchanan WW, Goldsmith CH, Campbell J, Stitt LW. Validation study of WOMAC: a health status instrument for measuring clinically important patient relevant outcomes to antirheumatic drug therapy in patients with osteoarthritis of the hip or knee. J Rheumatol. 1988;15(12):1833–1840. [PubMed] [Google Scholar]
- 20.Roos EM, Lohmander LS. The Knee injury and Osteoarthritis Outcome Score (KOOS): from joint injury to osteoarthritis. Health and Quality of Life Outcomes. 2003;1:64. doi: 10.1186/1477-7525-1-64 [DOI] [PMC free article] [PubMed] [Google Scholar]
- 21.Wolfe F, Smythe HA, Yunus MB, et al. The American College of Rheumatology 1990 Criteria for the Classification of Fibromyalgia. Report of the Multicenter Criteria Committee. Arthritis Rheum. 1990;33(2):160–172. doi: 10.1002/art.1780330203 [DOI] [PubMed] [Google Scholar]
- 22.Vina ER, Ran D, Ashbeck EL, Kwoh CK. Widespread Pain Is Associated with Increased Risk of No Clinical Improvement After TKA in Women. Clin Orthop Relat Res. 2020;478(7):1453. doi: 10.1097/CORR.0000000000001001 [DOI] [PMC free article] [PubMed] [Google Scholar]
- 23.Song J, Lee J, Lee YC, et al. Sleep Disturbance Trajectories in Osteoarthritis. J Clin Rheumatol. 2021;27(8):e440–e445. doi: 10.1097/RHU.0000000000001512 [DOI] [PMC free article] [PubMed] [Google Scholar]
- 24.Washburn RA, Smith KW, Jette AM, Janney CA. The Physical Activity Scale for the Elderly (PASE): development and evaluation. J Clin Epidemiol. 1993;46(2):153–162. [DOI] [PubMed] [Google Scholar]
- 25.Nagin DS, Jones BL, Passos VL, Tremblay RE. Group-based multi-trajectory modeling. Stat Methods Med Res. 2018;27(7):2015–2023. doi: 10.1177/0962280216673085 [DOI] [PubMed] [Google Scholar]
- 26.Jones B, Nagin DS. A note on a Stata plugin for estimating group-based trajectory models. Sociological Methods & Research. 2013;42:608–613. doi: 10.1177/0049124113503141 [DOI] [Google Scholar]
- 27.Nagin DS. Group-Based Modeling of Development. Harvard University Press; 2005. [Google Scholar]
- 28.Radojcic MR, Arden NK, Yang X, et al. Pain trajectory defines knee osteoarthritis subgroups: a prospective observational study. Pain. 2020;161(12):2841–2851. doi: 10.1097/j.pain.0000000000001975 [DOI] [PMC free article] [PubMed] [Google Scholar]
- 29.Thomas MJ, Rathod-Mistry T, Parry EL, Pope C, Neogi T, Peat G. Triggers for acute flare in adults with, or at risk of, knee osteoarthritis: a web-based case-crossover study in community-dwelling adults. Osteoarthritis and Cartilage. 2021;29(7):956–964. doi: 10.1016/j.joca.2021.04.007 [DOI] [PMC free article] [PubMed] [Google Scholar]
- 30.Parry E, Ogollah R, Peat G. “Acute flare-ups” in patients with, or at high risk of, knee osteoarthritis: a daily diary study with case-crossover analysis. Osteoarthritis and Cartilage. 2019;27(8):1124–1128. doi: 10.1016/j.joca.2019.04.003 [DOI] [PubMed] [Google Scholar]
- 31.Egsgaard LL, Eskehave TN, Bay-Jensen AC, Hoeck HC, Arendt-Nielsen L. Identifying specific profiles in patients with different degrees of painful knee osteoarthritis based on serological biochemical and mechanistic pain biomarkers: a diagnostic approach based on cluster analysis. Pain. 2015;156(1):96–107. doi: 10.1016/j.pain.0000000000000011 [DOI] [PubMed] [Google Scholar]
- 32.Kittelson AJ, Schmiege SJ, Maluf K, George SZ, Stevens-Lapsley JE. Determination of Pain Phenotypes in Knee Osteoarthritis Using Latent Profile Analysis. Pain Med. 2021;22(3):653–662. doi: 10.1093/pm/pnaa398 [DOI] [PMC free article] [PubMed] [Google Scholar]
- 33.Carlesso LC, Feldman DE, Vendittoli PA, et al. Use of IMMPACT Recommendations to Explore Pain Phenotypes in People with Knee Osteoarthritis. Pain Med. 2022;23(10):1708–1716. doi: 10.1093/pm/pnac044 [DOI] [PubMed] [Google Scholar]
- 34.Kittelson AJ, Stevens-Lapsley JE, Schmiege SJ. Determination of Pain Phenotypes in Knee Osteoarthritis: A Latent Class Analysis Using Data From the Osteoarthritis Initiative. Arthritis Care Res (Hoboken). 2016;68(5):612–620. doi: 10.1002/acr.22734 [DOI] [PMC free article] [PubMed] [Google Scholar]
- 35.Carlesso LC, Segal NA, Frey-Law L, et al. Pain Susceptibility Phenotypes in Those Free of Knee Pain With or at Risk of Knee Osteoarthritis: The Multicenter Osteoarthritis Study. Arthritis Rheumatol. 2019;71(4):542–549. doi: 10.1002/art.40752 [DOI] [PMC free article] [PubMed] [Google Scholar]
- 36.Felson DT, Niu J, Quinn EK, et al. Multiple Nonspecific Sites of Joint Pain Outside the Knees Develop in Persons With Knee Pain. Arthritis Rheumatol. 2017;69(2):335–342. doi: 10.1002/art.39848 [DOI] [PMC free article] [PubMed] [Google Scholar]
- 37.Carlesso LC, Niu J, Segal NA, et al. The Effect of Widespread Pain on Knee Pain Worsening, Incident Knee Osteoarthritis and Incident Knee Pain: The Multicenter Osteoarthritis (MOST) Study. J Rheumatol. 2017;44(4):493–498. doi: 10.3899/jrheum.160853 [DOI] [PMC free article] [PubMed] [Google Scholar]
- 38.Sharma L Osteoarthritis of the Knee. N Engl J Med. 2021;384(1):51–59. doi: 10.1056/NEJMcp1903768 [DOI] [PubMed] [Google Scholar]
- 39.Campbell TM, Trudel G, Laneuville O. Knee flexion contractures in patients with osteoarthritis: clinical features and histologic characterization of the posterior capsule. PM R. 2015;7(5):466–473. doi: 10.1016/j.pmrj.2014.12.001 [DOI] [PubMed] [Google Scholar]
- 40.Fritz S, Lusardi M. White paper: “walking speed: the sixth vital sign.” J Geriatr Phys Ther. 2009;32(2):46–49. [PubMed] [Google Scholar]
- 41.Middleton A, Fritz SL, Lusardi M. Walking speed: the functional vital sign. J Aging Phys Act. 2015;23(2):314–322. doi: 10.1123/japa.2013-0236 [DOI] [PMC free article] [PubMed] [Google Scholar]
- 42.Master H, Neogi T, Callahan LF, et al. The association between walking speed from short- and standard-distance tests with the risk of all-cause mortality among adults with radiographic knee osteoarthritis: Data from three large United States cohort studies. Osteoarthritis Cartilage. 2020;28(12):1551–1558. doi: 10.1016/j.joca.2020.08.009 [DOI] [PMC free article] [PubMed] [Google Scholar]
- 43.Racine M, Tousignant-Laflamme Y, Kloda LA, Dion D, Dupuis G, Choinière M. A systematic literature review of 10 years of research on sex/gender and experimental pain perception - part 1: are there really differences between women and men? Pain. 2012;153(3):602–618. doi: 10.1016/j.pain.2011.11.025 [DOI] [PubMed] [Google Scholar]
- 44.Che X, Cash R, Ng SK, Fitzgerald P, Fitzgibbon BM. A Systematic Review of the Processes Underlying the Main and the Buffering Effect of Social Support on the Experience of Pain. Clin J Pain. 2018;34(11):1061–1076. doi: 10.1097/AJP.0000000000000624 [DOI] [PubMed] [Google Scholar]
- 45.Boring BL, Walsh KT, Nanavaty N, Ng BW, Mathur VA. How and Why Patient Concerns Influence Pain Reporting: A Qualitative Analysis of Personal Accounts and Perceptions of Others’ Use of Numerical Pain Scales. Front Psychol. 2021;12:663890. doi: 10.3389/fpsyg.2021.663890 [DOI] [PMC free article] [PubMed] [Google Scholar]
- 46.Hill JC, Whitehurst DGT, Lewis M, et al. Comparison of stratified primary care management for low back pain with current best practice (STarT Back): a randomised controlled trial. Lancet. 2011;378(9802):1560–1571. doi: 10.1016/S0140-6736(11)60937-9 [DOI] [PMC free article] [PubMed] [Google Scholar]
- 47.Hodges PW. Hybrid Approach to Treatment Tailoring for Low Back Pain: A Proposed Model of Care. J Orthop Sports Phys Ther. 2019;49(6):453–463. doi: 10.2519/jospt.2019.8774 [DOI] [PubMed] [Google Scholar]
- 48.Birch S, Stilling M, Mechlenburg I, Hansen TB. The association between pain catastrophizing, physical function and pain in a cohort of patients undergoing knee arthroplasty. BMC Musculoskeletal Disorders. 2019;20(1):421. doi: 10.1186/s12891-019-2787-6 [DOI] [PMC free article] [PubMed] [Google Scholar]
- 49.Degerstedt Å, Alinaghizadeh H, Thorstensson CA, Olsson CB. High self-efficacy – a predictor of reduced pain and higher levels of physical activity among patients with osteoarthritis: an observational study. BMC Musculoskeletal Disorders. 2020;21(1):380. doi: 10.1186/s12891-020-03407-x [DOI] [PMC free article] [PubMed] [Google Scholar]
- 50.Buysse DJ, Reynolds CF, Monk TH, Berman SR, Kupfer DJ. The Pittsburgh Sleep Quality Index: a new instrument for psychiatric practice and research. Psychiatry Res. 1989;28(2):193–213. doi: 10.1016/0165-1781(89)90047-4 [DOI] [PubMed] [Google Scholar]
Associated Data
This section collects any data citations, data availability statements, or supplementary materials included in this article.