

Abstract
Altered thermal solubility measurement techniques are emerging as powerful tools to assess ligand binding, post-translational modification, protein–protein interactions, and many other cellular processes that affect protein state under various cellular conditions. Thermal solubility or stability profiling techniques are enabled on a global proteomic scale by employing isobaric tagging reagents that facilitate multiplexing capacity required to measure changes in the proteome across thermal gradients. Key among these is thermal proteomic profiling (TPP), which requires 8–10 isobaric tags per gradient and generation of multiple proteomic datasets to measure different replicates and conditions. Furthermore, using TPP to measure protein thermal stability state across different conditions may also require measurements of differential protein abundance. Here, we use the proteome integral stability alteration (PISA) assay, a higher throughput version of TPP, to measure global changes in protein thermal stability normalized to their protein abundance. We explore the use of this approach to determine changes in protein state between logarithmic and stationary phase Escherichia coli as well as glucose-starved human Hek293T cells. We observed protein intensity-corrected PISA changes in 290 and 350 proteins due to stationary phase transition in E. coli and glucose starvation, respectively. These data reveal several examples of proteins that were not previously associated with nutrient states by abundance alone. These include E. coli proteins such as putative acyl-CoA dehydrogenase (aidB) and chaperedoxin (cnoX) as well as human RAB vesicle trafficking proteins and many others which may indicate their involvement in metabolic diseases such as cancer.
Keywords: E. coli stationary phase, isobaric peptide tagging, glucose starvation, ligand-protein interactions, proteome integral stability alteration assay
1 |. INTRODUCTION
Understanding the changes in protein state that exert biological function in different growth conditions and in response to environmental stimuli is a key challenge in biology. Changes in protein thermal stability, have been measured to detect differences in protein state, in response to, for example, ligand or protein binding [1] and/or post-translational modification [2]. These approaches include methods such as the cellular thermal shift assay (CETSA) that exposes cell lysates to a thermal gradient to determine target engagement in the presence or absence of a small molecule, drug, or ligand of interest [3]. More recently, proteomic multiplexing approaches using tandem mass tag (TMT) isobaric peptide labeling reagents have enabled changes in protein thermal stability to be measured on a global proteome scale by thermal proteomic profiling (TPP) [1, 4, 5]. Initial experimental setups for TPP had relatively poor throughput due to the requirement for a unique TMT channel for each temperature such that 2 10-plex proteomics experiments were required for a single analysis [5]. Although these issues may be partly alleviated by 2 8-plex-enabled thermal gradients using higher-order, 16-plex, and 18-plex multiplexing reagents [6, 7], performing these experiments across many conditions and replicates is cumbersome. To meet this need, the proteome integral solubility alteration (PISA) assay [8] uses pooling of samples from across a temperature gradient to increase throughput and provide a greater number of conditions and replicates.
Although TPP and PISA experimental setups aimed at measuring thermal stability differences to survey ligand-protein binding usually benefit by starting from a single lysate per experiment, determining the protein thermal stability shifts across different cellular conditions must be normalized to protein abundance between samples. This issue is particularly important in PISA experiments since the shape of the thermal stability curves becomes obscured when samples from each temperature are combined. Measuring thermal stability that is corrected for the protein’s abundance may be analyzed in separate experiments as has recently been performed across 122 mutant strains of Escherichia coli using TMT experiments analyzed by 1D-LC-MS/MS to reveal changes in protein state apart from changes in abundance [9], however, this approach has low throughput and does not allow comprehensive proteome coverage. Alternatively, PISA, enabled by 16- or 18-plex TMT-based multiplexing, provides enough replicates and conditions to determine both thermal stability and protein abundance changes while using 2D-LC-MS/MS to allow in-depth proteomic coverage for complex proteomes such as in human cells. Recently, a modified PISA method called PISA-Express was used to measure changes in both thermal stability and protein expression in pluripotent stem cells to detect alterations in proteins during cell type transitions [10]. Here, we show that a similar approach may be used to determine differences in protein thermal stability between nutrient-replete (logarithmic phase) and nutrient-limited (stationary phase) E. coli as well as glucose replete and glucose-starved human Hek293T cells. In the logarithmic to stationary shift in E. coli, we observed 290 protein-abundance-corrected differences in thermal stability whereas in glucose starved human cells we observed 350 differences, many of which were associated with changing growth and nutrient states that were not previously reported. These include shifts E. coli proteins, such as putative acyl-CoA dehydrogenase (aidB) and chaperedoxin (cnoX), as well as human proteins such as RAB vesicle trafficking proteins. These data demonstrate the utility of combining PISA and protein abundance measurements to discover alterations in protein state across differing nutrient conditions that may be associated with important metabolic and metabolism-related diseases such as cancer and diabetes. The dataset can be explored at https://murphy-lab.shinyapps.io/MLDV/.
2 |. MATERIALS AND METHODS
2.1 |. Mammalian and bacterial cell culture
E. coli cells (DH5α New England Biolabs, Ipswich, MA) were grown in Luria-Bertani (LB) (Bio-Basic, Markham, ON) liquid media at 37°C while agitating. Cells were harvested at OD 0.789 for logarithmic growth phase samples and at OD 1.76 for stationary growth phase samples. Samples were centrifuged at 2500 × g for 15 min and the supernatant was discarded. Cells were lysed using NP-40 based lysis buffer (1 mM MgCl2, 0.5% NP-40, 1× PBS) containing protease inhibitor tablets (Roche, Basel, Switzerland). Hek293T cells were cultured in 15 cm plates (37°C at 5% CO2) in Roswell Park Memorial Institute (RPMI)-1640 complete medium (Invitrogen, Carlsbad, CA) supplemented with 10% fetal bovine serum (Invitrogen, Carlsbad, CA), 100 units/ml penicillin, 100 μg/ml streptomycin, and 0.25 μg/ml amphotericin B (Invitrogen, Carlsbad, CA). Once cells reached 50% confluency, media was changed to RPMI-1640 medium containing either 11 or 0 mM glucose (Invitrogen, Carlsbad, CA) and harvested after 24 h by scraping into the aforementioned NP-40 based lysis buffer (on ice).
2.2 |. Lysate preparation and protein quantification
All lysates (from bacterial and mammalian cells) were sonicated using Branson SLPe Digital Sonifier at continuous mode with amplitude of 20% using 3, 20 s pulses, resting for 1 min on ice in between. Lysates were then centrifuged at 20,000 × g for 15 min. The supernatant was collected into a new tube and total protein concentration was measured using a bicinchoninic acid (BCA) assay (Pierce, Rochford, IL).
2.3 |. Thermal gradient, SP3-digest, and TMT labeling
Aliquots of 40 μg of protein in 40 μl of lysis buffer were subjected to thermal proteome profiling (TPP) with a temperature gradient of 43.0°C to 59.0°C for 3 min in a BioRad T100 thermal cycler (BioRad, Hercules, CA). Samples were allowed to rest at room temperature for 5 min, then centrifuged at 13,000 × g for 2 h. For each sample, 20 μl from each temperature was pooled together into new tubes then reduced using 5 mM DTT for 30 min at room temperature and alkylated using 12 mM iodoacetamide for 30 min in the dark.
Aliquots containing 25 μg of protein was also reduced and alkylated and all samples were cleaned and digested using the single-pot, solid-phase-enhanced sample-preparation (SP3) protocol [11]. Following release from SP3 magnetic beads, peptides were suspended in 30% acetonitrile, and 5 μl of TMT16 reagents (Thermo-Fisher Scientific, Waltham, MA) pre-aliquoted at a concentration of 12.5 μg/μl in anhydrous acetonitrile. The reaction was quenched with 5% hydroxylamine (Sigma-Aldrich, St Louis, MO), and all 16 TMT-labeled samples were combined.
2.4 |. High pH reversed phase fractionation
The combined, TMT labeled, peptide samples were adjusted to pH <3 using formic acid (FA). Samples were then desalted using a 100 mg tC18 Sep-Pakcartridge (Waters, Milford, MA) and eluted with 70% ACN/1% FA then dried using a centrifugal vacuum concentrator overnight. Peptides were resuspended in 5% ACN, 10 mM ammonium formate (pH 8), and sonicated twice for 12 s at continuous mode with amplitude of 20%. Peptides were then centrifuged at 20,000 × g for 5 min and subjected to HPLC using an Agilent 300Extend, 2.1 × 100 mm, 3.5-μm C18 column (Agilent, SantaClara, CA) at a flow rate of 250μl/min using an elution gradient of 5% to 40% ACN (10 mM ammonium formate, pH 8). A total of 96 fractions were collected and combined to a total of 12 fractions. Combined fractions were dried using a vacuum concentrator then suspended in 100 μl of 1% FA, and desalted using in-house packed Stage-tips [12].
2.5 |. LC-FAIMS-MS2
Samples were analyzed using an Orbitrap Fusion Lumos mass spectrometer (Thermo-Fisher Scientific, San Jose, CA) coupled with a Proxeon EASY-nLC 1200 LC pump (Thermo-Fisher Scientific, San Jose, CA) using an FAIMS-HRMS2 method as described previously [6]. Briefly, each sample was resuspended in 4 μl of 5% ACN/0.1% FA and 1 μl was injected onto a 100 μm inner diameter microcapillary column packed in-house with a 35 cm of Accucore C18 resin (2.6 μm, 150 Å) using a 90 min method with an elution gradient of 0%–25% ACN/0.1% FA over 82 min at a flow rate of 575 nl/min. MS1 scans (400–1600 m/z) were collected at 3 FAIMS CVs (−40, −60, and −80) using the Orbitrap at 60,000 resolution with maximum injection time of 50 ms, and AGC 4e5. For each CV, MS2 scans were collected by HCD fragmentation at 36%, with a resolution of 50,000 and isolation window of 0.5.
2.6 |. Database searching and analysis
Spectra were analyzed using MSFragger (version 3.4) implemented in Fragpipe software (version 17.0) [13]. Trypsin was specified as the proteolytic enzyme allowing up to two missed cleavages. Fixed modification on lysine and static modification of peptide N-termini were set to 304.2071 Da. Static modification was set to 57.0215 Da on cysteines. Variable modification on methionine was set at 15.9949 Da. The precursor mass tolerance was set to ±10 ppm and fragment mass tolerance to 0.02 Da. Data were searched against a protein sequence databases downloaded from UniProt (December 2021) (human or E. coli). Peptide and protein false discovery rates were filtered to <1% using Philosopher (version 4.1) [14] implemented in Fragpipe. Reporter ions were analyzed using TMT Integrator implemented in Fragpipe using a minimum isolation specificity of 0.5 and using the summed intensities for all peptides matching each protein. All TMT channels were normalized using RStudio by equalizing the summed reporter ion intensity for all proteins in each channel. For each protein, thermal stability (PISA) TMT channels were corrected for differences in protein abundance by multiplying by a correction factor for each protein that equated the mean summed intensity of logarithmic and stationary phase (E. coli) or starved and unstarved (Hek293T) protein channels. Analysis and visualization was done using R Studio where t-test p-values were calculated using the genefilter package and adjusted using the Benjamini-Hochberg (B-H) algorithm. Significance was defined as: B-H-corrected p-values <0.05 and log2 fold change <-1 or > 1 (for E. coli) or log2 fold change <- 0.5 or > 0.5 (for Hek293T).
3 |. RESULTS AND DISCUSSION
3.1 |. PISA and proteome abundance measurements comparing logarithmic and stationary phase E. coli
Techniques that measure protein thermal stability have the potential to reveal altered protein states in response to environmental perturbations such as nutrient stress and potentially reveal those associated with disease states [15]. To assess whether protein thermal shifts could be determined in a single PISA experiment, we first measured changes in thermal stability and protein abundance of E. coli cells collected at logarithmic growth and stationary phase growth (Figure 1A). These cell states are a model for proliferative growth on replete nutrient media versus quiescence in nutrient-deplete conditions and result in dynamic proteomic and metabolic changes in microbes [16] but in which thermal stability states have not previously been assessed. To enable the detection of thermal stability-specific changes in proteins corrected for changes in protein abundance, we used 16-plex TMT-based sample multiplexing on logarithmic versus stationary phase E. coli cells to perform 4 PISA replicates with four protein abundance replicates as controls for each condition (Figure 1B). Using 2D-LC-FAIMS-MS2 we quantified 2402 proteins, of which 186 and 686 proteins were respectively up- or down-regulated at the protein level (Benjamini-Hochberg-adjusted p-value <0.05 and log2 fold change < –1 or > 1) in stationary phase (Figure S1A and S1B).
FIGURE 1.

Integrated PISA and proteome abundance measurements comparing logarithmic and stationary phase E. coli. (A) Growth curve of E. coli measured by OD600. Circles represent samples used for logarithmic and stationary phases. (B) Experimental layout for preparing both global proteome and PISA analysis of E. coli protein lysates from the logarithmic and stationary phases of growth. PISA samples were subjected to a thermal gradient (43° to 59° C) (n = 4) and samples from each temperature were pooled, after which they were labeled using TMT reagents alongside proteome samples without thermal treatment (n = 4). All labeled samples were combined and analyzed by 2D-LC-FAIMS-MS2. (C) Comparison of mean log2 ratios of protein abundance to mean log2 PISA ratios (proteins significantly different in abundance are shown in yellow (Benjamini-Hochberg-adjusted p-value <0.05 and log2 fold change <- 1 or > 1)). (D) GO term analysis of proteins with significantly up- and down-regulated protein abundance in stationary phase (Benjamini-Hochberg-adjusted p-value <0.05 and log2 fold change < –1 or > 1). (E) Comparison of summed TMT intensities of arginine catabolism pathway proteins. (F) Comparison of summed TMT signal intensities of several ribosomal proteins.
Mean log2 ratios (stationary/logarithmic phase) of protein intensity were highly correlated with that of log2 ratios of PISA intensity, suggesting an overall high degree of reproducibility in the dataset (Figure 1C). GO term analysis of all significantly different proteins revealed over-represented functions among the proteins upregulated in stationary phase, such as arginine catabolism to succinate or glutamate (Figure 1D), most of which showed similar differences at the PISA level. This includes the arginine succinyl transferase proteins astA, astB, astC, and astD (Figure 1E) which are known to be induced following nutrient-depleted conditions [17]. Matching the ribosomal-related GO-terms, the ribosomal subunit proteins, rpsB, rpsE, rpsH, rpsN, and rpsP decreased in protein intensity, but less at the PISA intensity level (Figure 1F), suggesting they also underwent a thermal shift due to a change in protein state. Decreasing ribosomal protein abundance to halt translation during nutrient scarcity is a consistent strategy observed across prokaryotes and eukaryotes transitioning from proliferative to quiescent states [18–20]. These data confirm that our proteomic dataset from the E. coli model of logarithmic and stationary growth aligns well with predicted phenotypes of proliferative and quiescent growth states. As such, it forms the basis to use the PISA portion of the dataset to reveal thermally-shifted proteins associated with these states.
3.2 |. Thermally-shifted proteins between logarithmic and stationary phase E. coli
To assess thermal stability changes in the proteome during the shift from logarithmic to stationary phase growth, PISA values were corrected for protein abundances. We further refer to these values as normalized PISA (nPISA). Following re-analysis of the nPISA data we observed 61, 642, and 229 proteins significant in nPISA-only, protein abundance-only, and both (nPISA and protein abundance), respectively (Figure 2A) (adjusted p-value ←0.05 and log2 ratio ±1) indicative of altered protein states. Of the thermally shifted proteins, the clearest differences between nPISA and abundance measurements were those proteins that had positive nPISA in stationary phase but negatively regulated or unchanged protein abundance such as xdhA, tsr, and zapB (top left quadrant of Figure 2A).
FIGURE 2.

Comparison of thermally shifted proteins to their protein abundances in logarithmic and stationary phase E. coli. (A) Comparison of mean log2 normalized nPISA ratios to mean log2 ratios of protein abundance. Proteins significantly different by nPISA, abundance, or both (Benjamini-Hochberg-adjusted p-value <0.05 and log2 fold change <- 1 or > 1) appear as indicated. (B) Summed TMT intensities for several proteins with significant differences by nPISA. (C) Heatmap of normalized thermal stability (nPISA) and protein abundance (Protein) of proteins from A. (D) Summed TMT intensities for several proteins with in the heatmap from C.
Among the all quantified proteins, we observed 61 nPISA-specific proteins which did not change in protein abundance (Supplementary Data). These include the putative acyl-CoA dehydrogenase (aidB) (Figure 2B), which has well-appreciated roles in E. coli DNA repair under alkylation damage [21], but has not been specifically reported to change protein state or activity in stationary phase. Another protective protein we observed was chaperedoxin cnoX (Figure 2B) which has been shown to protect against stress-induced oxidative damage in E. coli [22]. We also observed nPISA changes in chaperone SurA (Figure 2B), a protein that has been previously reported to be essential for survival of E. coli in stationary phase [23] as well as 3-deoxy-D-manno-octulosonic acid transferase kdtA (Figure 2B) another essential protein for E.coli cell growth [24]. Furthermore we observed nPISA changes in proteins with putative roles in methyltransferase activity (tam) and nitrate reduction (napB) (Figure 2B) which have roles in stationary-phase specific metabolism [25] but have not previously been shown to change state in stationary phase. Interestingly, we observed 23 proteins with significantly different nPISA but insignificant differences in protein abundance and protein intensity fold changes less than 0.5 (Figure 2C). No significantly enriched GO terms were observed among these proteins but they were associated with a wide range of known and unknown functional association with logarithmic growth and stationary phase transition. For example, in this group we observed nPISA changes in two poorly described proteins, the PF03966 family protein, ycaR, and ygfX (Figure 2D) which may have unappreciated roles in stationary phase transition. This group also included xanthine dehydrogenase (xdhA), and DUF892 domain-containing protein yciE (Figure 2D) which have putative roles in nucleotide and anaerobic metabolism respectively [26] but which we here link to stationary phase transition without a change in protein abundance.
3.3 |. Comparison of nPISA of logarithmic to stationary phase with E. coli mutant thermal shifts
To gain additional mechanistic insight into the regulation of the nPISA shifts we observed, we compared our dataset to a previous study of thermal stability changes across 122 deletion mutant E. coli strains(9). Of all 290 nPISA significant proteins that we observed in our study, 96 of them were also measured in the mutant study (Figure S2). To further focus the comparison, we examined 12 of those matched proteins (Figure 3A) which had positive nPISA intensity levels in stationary phase but negatively regulated or unchanged protein abundance (top left quadrant of Figure 2A). This includes methyl-accepting chemotaxis protein I (tsr) which had an nPISA (stationary/log phase) of 6.81 and was also shifted by ompF, mipA, and ydhF in the mutant study (Figure 3B) suggesting these proteins may alter tsr state during stationary phase shift.
FIGURE 3.
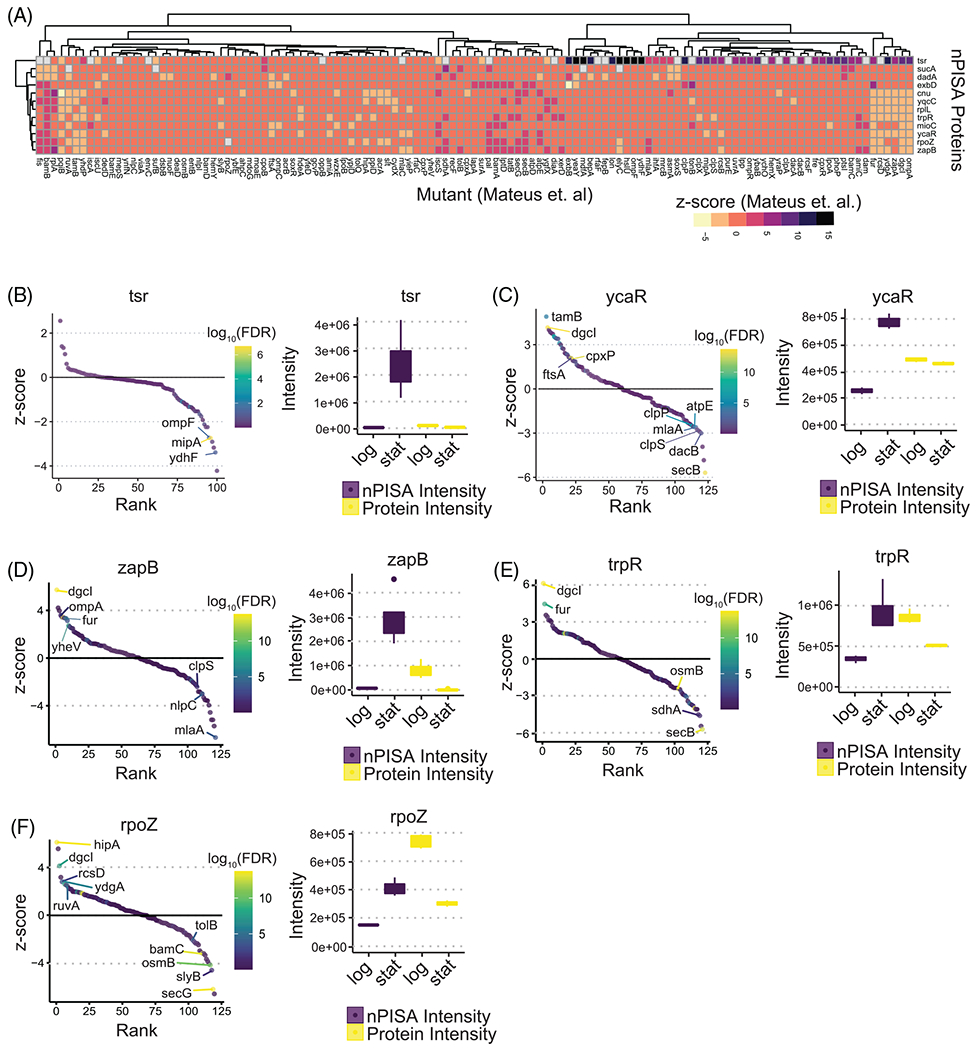
Comparison of nPISA-specific protein differences in stationary phase to Mateus et al. (A) Heatmap showing thermal stability differences across 122 E. coli mutant strains for 12 matched nPISA changes. Shown also are significantly different proteins with respect to thermal stability in this study. (B–F) and the rank of mutants according to their effect on the protein’s stability in Mateus et al. (labeled proteins are mutant strains from Mateus et al. which showed a significant effect on the indicated proteins also observed to have thermal stability differences in this study).
Interestingly, the functionally obscure protein, ycaR, for which we observed an nPISA (stationary/log phase) of 1.61 in our dataset, were also significantly altered in diguanylate cyclase (dgcI), ATP synthase subunit C (atpE), ATP-dependent Clp protease proteolytic subunit (clpP), and cell-division protein ftsA mutants (Figure 3C). Interestingly, the dgcI mutant altered thermal stability in three other proteins we observed to have significant different nPISA: cell division protein zapB (Figure 3D), trp operon repressor trpR (Figure 3E), and DNA-directed RNA polymerase subunit omega rpoZ (Figure 3F). Together, these data point to several new explorable links between proteins such as ompF and dgcI in regulating the protein state of tsr, ycaR, and others we observe in our dataset that may have functions in stationary phase transitions.
3.4 |. Thermal stability and proteome abundance changes in glucose-starved human cells
Since the shift from logarithmic to stationary phase growth involves vastly changing nutrient conditions we next explored changes in protein abundance and thermal stability in a more controlled setting using 24 h of glucose starvation in human (Hek293T) cells. We again combined PISA and proteome abundance measurements in the same TMT16-plex based multiplexing experiment but performed PISA with five replicates and proteome abundance measurements with three replicates (Figure 4A). Using 2D-LC-FAIMS-MS2 we quantified 6902 proteins of which we observed 27 and 217 proteins that were significantly increased or decreased in abundance (Benjamini-Hochberg adjusted p-value <0.05 and log2 fold change ±0.5) in glucose-starved cells (Figures 4B, S3A and S3B). Like the E. coli experiment, we also observed general agreement between the PISA intensity and protein intensity log2 ratios (glucose starved/unstarved). GO term analysis of the decreased proteins showed over-representation of ribosomal RNA processing and translation functions (Figure 4C), exemplified by the proteins NSA2, RPL7A, RPS6, RPL31, RPL7L1, and RSL1D1 (Figure 4D). Interestingly, like the E. coli data, some ribosomal proteins (such as NSA2, RPL7A, and RPS6, Figure 4D) showed decreased log2 ratios for PISA intensity compared to protein intensity, suggesting they also change in thermal stability. Decreased ribosomal protein abundance is an established response during nutrient stress to minimize energy intensive processes such as translation [27] but these data suggest they also change in protein state. We also observed enrichment of unexpected GO terms such as ubiquitin ligase activity (Figure 4C), exemplified by the proteins CDC20 and UBE2C (Figure 4D). Although the link between ubiquitin ligase activity and glucose starvation is not fully clear, several ubiquitin ligases interact with autophagy proteins [28] and others regulate the abundance of the cellular energy sensor, AMPK [29]. Interestingly, we also observed changes in proteins involved in antigen presentation, exemplified by the human leukocyte antigen proteins HLA-A, HLA-B, and HLA-C (Figure 4D), which also may be regulated by autophagy during the stress response [30].
FIGURE 4.

Integrated PISA and global proteome abundance measurements in glucose-starved Hek293T cells. (A) Experimental layout for integrating PISA proteomic abundance measurements in Hek293T cells cultured with and without glucose for 24 h. Lysates for PISA were subjected to a thermal gradient (43° to 59°C) and pooled, after which they were labeled using TMT reagents as in Figure 1A. (B) Scatter plot comparing mean log2 changes in PISA versus protein abundance. Yellow dots signify the significant changes in protein abundance intensity (Benjamini-Hochberg-adjusted p-value <0.05 and log2 fold change < –0.5 or > 0.5). (C) GO term analysis of proteins that were significantly decreased in abundance in glucose starved cells (Benjamini-Hochberg-adjusted p-value <0.05 and log2 fold change < 0.5). (D) Examples of summed TMT signal intensities for proteins significantly shifted in abundance having ubiquitin ligase activity, ribosomal biogenesis/translation, (six proteins) and antigen presentation functions in the dataset.
Similar to E. coli dataset, in order to assess on thermal stability changes alone, nPISA values were generated, correcting PISA to protein differences. We then plotted the mean protein fold changes versus the mean nPISA fold changes following glucose starvation in Hek293T cells where we observed 304, 197, and 46 proteins significant in nPISA-only, protein abundance-only, and both (nPISA and protein abundance), respectively (Figure 5A) (adjusted p-value < - 0.05 and log2 ratio ±0.5). The 304 proteins that changed in thermal stability only are shown in Figure 5B and Supplementary Data. GO term analysis of nPISA-specific changes following glucose starvation revealed significantly enriched GO terms such as Rab signal transduction, cellular protein localization, RNA processing, and transport (Figure 5C). These include the RAB proteins RAB21, RAB35, RAB9A, and RAB33B which all showed significantly different PISA log2 ratios (starved/unstarved) of approximately −0.6 (Figure 5D).
FIGURE 5.

Thermally-shifted, but stably-abundant, proteins between starved and unstarved Hek293T cells. (A) Scatter plot comparing nPISA versus mean log2 changes in protein abundance. Significant differences in nPISA, abundance, or both (Benjamini-Hochberg-adjusted p-value <0.05 and log2 fold change < −0.5 or >0.5) are indicated as shown. (B) Heatmap of nPISA and protein abundance (Protein) of proteins with significant differences by PISA-level only. (C) Enriched GO terms among proteins significantly shifted by nPISA only (Benjamini-Hochberg-adjusted p-value <0.05 and log2 fold change < −0.5 or >0.5). Also shown are comparisons of summed TMT signal intensities for several RAB signal transduction pathway proteins (D).
Among the proteins with nPISA differences but no protein abundance differences, we observed nPISA log2 fold changes (starved/unstarved phase) of −0.53 and −0.84 (Figure 6A,E) in the glycolysis and pentose phosphate pathway proteins, GAPDH and TKT, respectively. Since these changes may indicate a change in protein state due to altered metabolic activity, we validated their thermal stability across a temperature gradient by Western blot (Figure 6B,F). Albeit not fitting to the typical thermal stability curve, summed intensity of the bands showed that GAPDH was more thermally stable in unstarved cells and agreed well with the nPISA data (Figure 6C,D) suggesting that alterations in GAPDH protein states due to the lack of glycolytic flux could be detected by PISA. Similarly, TKT was stabilized in unstarved cells (Figure 6F) and analysis of the summed band intensities agreed well nPISA data (Figure 6G,H). Together these data demonstrate the ability of PISA to detect changes in protein states in response to nutrient stresses such as glucose starvation and may be used to measure other nutrient-based protein state shifts apart from changes in protein abundance.
FIGURE 6.

Validation of GAPDH and TKT thermal shifts following glucose starvation in Hek293T cells. (A) Comparison of summed TMT signal intensities for GAPDH protein from nPISA. (B) Western blotting analysis of GAPDH in glucose-starved and unstarved Hek293T lysates across a temperature gradient of 43 to 60.4°C. (C) Plot of Western blot band intensities from (B). (D) Summed intensities across all bands from C. (E) Comparison of summed TMT signal intensities for TKT from our PISA experiment. (F) Western blotting analysis of TKT in glucose-starved and unstarved Hek293T lysates across a temperature gradient of 37–52.1°C. (G) Plot of Western blot band intensities from (F). (H) Summed intensities across all bands from (G).
4 |. CONCLUDING REMARKS
Here, we show the applicability of the PISA enabled by TMT-based multiplexing for measuring thermal stability in cells grown under different nutrient conditions. This approach provided a unique opportunity to determine putative differences in protein state that occur in models of severe nutrient deprivation. Although such experiments could be designed in shorter time frames that do not allow enough time for protein abundance changes to occur, we here focused on longer term (24 h) responses that may be under tight regulation and revealed many changes in protein state not previously associated with nutrient shifts by protein abundance alone. Importantly this approach could be combined with ligand- or drug-protein interactions that differ across nutrient states to identify conditional ligand interactions potentially leading to new insights into the mode of action functional metabolites and small molecule drugs.
Supplementary Material
SIGNIFICANCE STATEMENT.
Isobaric tagging approaches enable the global analysis of protein thermal stability, which reveals changes in protein state across different cellular conditions. Here, we measure protein thermal stability changes alongside protein abundance in changing nutrient conditions using log/stationary phase transition in E. coli and glucose starvation of a human cell line as models. We reveal protein abundance-normalized changes in protein thermal stability state for many proteins not previously associated with nutrient-limited conditions in E. coli and human cells.
ACKNOWLEDGMENTS
We would like to thank Dr. Steve P. Gygi and the Taplin Facility at Harvard Medical School for use of their mass spectrometer. This work was funded in part by NIH/NIGMS grant R01 GM132129 (J.A.P.). M.S and B.B receive funding from the MITACS Accelerate program. O.P and J.P.M receive funds from the Cancer Research Training Program of the Beatrice Hunter Cancer Research Institute, with funds provided by the Canadian Cancer Society’s JD Irving, Limited – Excellence in Cancer Research Fund.
Funding information
Canadian Cancer Society, Grant/Award Number: 707196; Mitacs, Grant/Award Number: IT25508; National Institutes of Health, Grant/Award Number: GM132129; Beatrice Hunter Cancer Research Institute
Abbreviations:
- CETSA
cellular thermal shift assay
- FA
formic acid
- FAIMS
field asymmetric waveform ion-mobility spectrometry
- PISA
proteome integral stability alteration assay
- TMT
tandem mass tag
- TPP
thermal proteomic profiling
Footnotes
CONFLICT OF INTEREST
The authors declare no conflict of interest.
SUPPORTING INFORMATION
Additional supporting information may be found online https://doi.org/10.1002/pmic.202100254 in the Supporting Information section at the end of the article.
DATA AVAILABILITY STATEMENT
The mass spectrometry proteomics data have been deposited to MASSIVE and the ProteomeXChange Consortium via the PRIDE repository with the dataset identifiers PXD031756 (E. coli dataset) and PXD031754 (Hek293T cell dataset). Protein intensities at the abundance and PISA (thermal stability) levels can be explored with an online viewer for the dataset (https://murphy-lab.shinyapps.io/MLDV/).
REFERENCES
- 1.Huber KVM, Olek KM, Müller AC, Tan CSH, Bennett KL, Colinge J, & Superti-Furga G (2015). Proteome-wide drug and metabolite interaction mapping by thermal-stability profiling. Nature Methods, 12, 1055–1057. [DOI] [PMC free article] [PubMed] [Google Scholar]
- 2.Huang JX, Lee G, Cavanaugh KE, Chang JW, Gardel ML, & Moellering RE (2019). High throughput discovery of functional protein modifications by Hotspot Thermal Profiling. Nature Methods, 16, 894–901. [DOI] [PMC free article] [PubMed] [Google Scholar]
- 3.Molina DM, Jafari R, Ignatushchenko M, Seki T, Larsson EA, Dan C, Sreekumar L, Cao Y, & Nordlund P (2013). Monitoring drug target engagement in cells and tissues using the cellular thermal shift assay. Science, 341, 84–87. [DOI] [PubMed] [Google Scholar]
- 4.Franken H, Mathieson T, Childs D, Sweetman GMA, Werner T, Tögel I, Doce C, Gade S, Bantscheff M, Drewes G, Reinhard FBM, Huber W, & Savitski MM (2015). Thermal proteome profiling for unbiased identification of direct and indirect drug targets using multiplexed quantitative mass spectrometry. Nature Protocols, 10, 1567–1593. [DOI] [PubMed] [Google Scholar]
- 5.Savitski MM, Reinhard FBM, Franken H, Werner T, Savitski MF, Eberhard D, Molina DM, Jafari R, Dovega RB, Klaeger S, Kuster B, Nordlund P, Bantscheff M, & Drewes G (2014). Tracking cancer drugs in living cells by thermal profiling of the proteome. Science, 346, 1255784. [DOI] [PubMed] [Google Scholar]
- 6.Li J, Van Vranken JG, Pontano Vaites L, Schweppe DK, Huttlin EL, Etienne C, Nandhikonda P, Viner R, Robitaille AM, Thompson AH, Kuhn K, Pike I, Bomgarden RD, Rogers JC, Gygi SP, & Paulo JA (2020). TMTpro reagents: A set of isobaric labeling mass tags enables simultaneous proteome-wide measurements across 16 samples. Nature Methods, 17, 399–404. [DOI] [PMC free article] [PubMed] [Google Scholar]
- 7.Li J, Cai Z, Bomgarden RD, Pike I, Kuhn K, Rogers JC, Roberts TM, Gygi SP, & Paulo JA (2021). TMTpro-18plex: The expanded and complete set of TMTpro reagents for sample multiplexing. Journal of Proteome Research, 20, 2964–2972. [DOI] [PMC free article] [PubMed] [Google Scholar]
- 8.Gaetani M, Sabatier P, Saei AA, Beusch CM, Yang Z, Lundström SL, & Zubarev RA (2019). Proteome integral solubility alteration: A high-throughput proteomics assay for target deconvolution. Journal of Proteome Research, 18, 4027–4037. [DOI] [PubMed] [Google Scholar]
- 9.Mateus A, Hevler J, Bobonis J, Kurzawa N, Shah M, Mitosch K, Goemans CV, Helm D, Stein F, Typas A, & Savitski MM (2020). The functional proteome landscape of Escherichia coli. Nature, 588, 473–478. [DOI] [PMC free article] [PubMed] [Google Scholar]
- 10.Sabatier P, Beusch CM, Saei AA, Aoun M, Moruzzi N, Coelho A, Leijten N, Nordenskjöld M, Micke P, Maltseva D, Tonevitsky AG, Millischer V, Carlos Villaescusa J, Kadekar S, Gaetani M, Altynbekova K, Kel A, Berggren P-O, Simonson O, … Zubarev RA (2021). An integrative proteomics method identifies a regulator of translation during stem cell maintenance and differentiation. Nature Communication, 12, 6558. [DOI] [PMC free article] [PubMed] [Google Scholar]
- 11.Hughes CS, Moggridge S, Müller T, Sorensen PH, Morin GB, & Krijgsveld J (2019). Single-pot, solid-phase-enhanced sample preparation for proteomics experiments. Nature Protocols, 14, 68–85. [DOI] [PubMed] [Google Scholar]
- 12.Rappsilber J, Ishihama Y, & Mann M (2003). Stop and go extraction tips for matrix-assisted laser desorption/ionization, nanoelectrospray, and LC/MS sample pretreatment in proteomics. Analytical Chemistry, 75, 663–670. [DOI] [PubMed] [Google Scholar]
- 13.Kong AT, Leprevost FV, Avtonomov DM, Mellacheruvu D, & Nesvizhskii AI (2017). MSFragger: Ultrafast and comprehensive peptide identification in mass spectrometry–based proteomics. Nature Methods, 14, 513–520. [DOI] [PMC free article] [PubMed] [Google Scholar]
- 14.da Veiga Leprevost F, Haynes SE, Avtonomov DM, Chang H-Y, Shanmugam AK, Mellacheruvu D, Kong AT, & Nesvizhskii AI (2020). Philosopher: A versatile toolkit for shotgun proteomics data analysis. Nature Methods, 17, 869–870. [DOI] [PMC free article] [PubMed] [Google Scholar]
- 15.Mateus A, Bobonis J, Kurzawa N, Stein F, Helm D, Hevler J, Typas A, & Savitski MM (2018). Thermal proteome profiling in bacteria: probing protein state in vivo. Molecular Systems Biology, 14, e8242. [DOI] [PMC free article] [PubMed] [Google Scholar]
- 16.Murphy JP, Stepanova E, Everley RA, Paulo JA, & Gygi SP (2015). Comprehensive temporal protein dynamics during the diauxic shift in Saccharomyces cerevisiae. Molecular & Cellular Proteomics, 14, 2454–2465. [DOI] [PMC free article] [PubMed] [Google Scholar]
- 17.Schneider BL, Kiupakis AK, & Reitzer LJ (1998). Arginine catabolism and the arginine succinyltransferase pathway in Escherichia coli. Journal of Bacteriology, 180, 4278–4286. [DOI] [PMC free article] [PubMed] [Google Scholar]
- 18.DeRisi JL, Iyer VR, & Brown PO (1997). Exploring the metabolic and genetic control of gene expression on a genomic scale. Science, 278, 680–686. [DOI] [PubMed] [Google Scholar]
- 19.Werner-Washburne M, Braun EL, Crawford ME, & Peck VM (1996). Stationary phase in Saccharomyces cerevisae. Molecular Microbiology, 19, 1159–1166. [DOI] [PubMed] [Google Scholar]
- 20.Navarro Llorens JM, Tormo A, & Martínez-García E (2010). Stationary phase in gram-negative bacteria. Fems Microbiology Review, 34, 476–495. [DOI] [PubMed] [Google Scholar]
- 21.Bowles T, Metz AH, O’Quin J, Wawrzak Z, & Eichman BF (2008). Structure and DNA binding of alkylation response protein AidB. Proceedings National Academy of Science United States of America, 105, 15299–15304. [DOI] [PMC free article] [PubMed] [Google Scholar]
- 22.Dupuy E, & Collet J-F (2021). Fort CnoX: Protecting bacterial proteins from misfolding and oxidative damage. Frontiers in Molecular Bioscience, 8, 681932. [DOI] [PMC free article] [PubMed] [Google Scholar]
- 23.Tormo A, Almirón M, & Kolter R (1990). surA, an Escherichia coli gene essential for survival in stationary phase. Journal of Bacteriology, 172, 4339–4347. [DOI] [PMC free article] [PubMed] [Google Scholar]
- 24.Belunis CJ, Clementz T, Carty SM, & Raetz CRH (1995). Inhibition of lipopolysaccharide biosynthesis and cell growth following inactivation of the kdtA gene in Escherichia coli. Journal of Biological Chemistry, 270, 27646–27652. [DOI] [PubMed] [Google Scholar]
- 25.Militello KT, Finnerty-Haggerty L, Kambhampati O, Huss R, & Knapp R (2020). DNA cytosine methyltransferase enhances viability during prolonged stationary phase in Escherichia coli. Fems Microbiology Letters, 367, fnaa166. [DOI] [PubMed] [Google Scholar]
- 26.Xi H, Schneider BL, & Reitzer L (2000). Purine catabolism in Escherichia coli and function of xanthine dehydrogenase in purine salvage. Journal of Bacteriology, 182, 5332–5341. [DOI] [PMC free article] [PubMed] [Google Scholar]
- 27.Leprivier G, Rotblat B, Khan D, Jan E, & Sorensen PH (2015). Stress-mediated translational control in cancer cells. Biochimica et Biophysica Acta - Gene Regulatory Mechanisms, 1849, 845–860. [DOI] [PubMed] [Google Scholar]
- 28.Regulation of MAGE-A3/6 by the CRL4-DCAF12 ubiquitin ligase and nutrient availability (2019). Embo Reports, 20, e47352. [DOI] [PMC free article] [PubMed] [Google Scholar]
- 29.Pineda CT, Ramanathan S, Fon Tacer K, Weon JL, Potts MB, Ou Y-H, White MA, & Potts PR (2015). Degradation of AMPK by a cancer-specific ubiquitin ligase. Cell, 160, 715–728. [DOI] [PMC free article] [PubMed] [Google Scholar]
- 30.Crotzer VL, & Blum JS (2005). Autophagy and intracellular surveillance: Modulating MHC class II antigen presentation with stress. Proceedings National Academy of Science United States of America, 102, 7779–7780. [DOI] [PMC free article] [PubMed] [Google Scholar]
Associated Data
This section collects any data citations, data availability statements, or supplementary materials included in this article.
Supplementary Materials
Data Availability Statement
The mass spectrometry proteomics data have been deposited to MASSIVE and the ProteomeXChange Consortium via the PRIDE repository with the dataset identifiers PXD031756 (E. coli dataset) and PXD031754 (Hek293T cell dataset). Protein intensities at the abundance and PISA (thermal stability) levels can be explored with an online viewer for the dataset (https://murphy-lab.shinyapps.io/MLDV/).