

Abstract
Cis-regulatory elements (CREs) and super cis-regulatory elements (SCREs) are non-coding DNA regions which influence the transcription of nearby genes and play critical roles in development. Dysregulated CRE and SCRE activities have been reported to alter the expression of oncogenes and tumor suppressors, thereby regulating cancer hallmarks. To address the strong need for a comprehensive catalogue of dysregulated CREs and SCREs in human cancers, we present TSCRE (http://tscre.zsqylab.com/), an open resource providing tumor-specific and cell type-specific CREs and SCREs derived from the re-analysis of publicly available histone modification profiles. Currently, TSCRE contains 1 864 941 dysregulated CREs and 68 253 dysregulated SCREs identified from 1366 human patient samples spanning 17 different cancer types and 9 histone marks. Over 95% of these elements have been validated in public resources. TSCRE offers comprehensive annotations for each element, including associated genes, expression patterns, clinical prognosis, somatic mutations, transcript factor binding sites, cancer-type specificity, and drug response. Additionally, TSCRE integrates pathway and transcript factor enrichment analyses for each study, enabling in-depth functional and mechanistic investigations. Furthermore, TSCRE provides an interactive interface for users to explore any CRE and SCRE of interest. We believe TSCRE will be a highly valuable platform for the community to discover candidate cancer biomarkers.
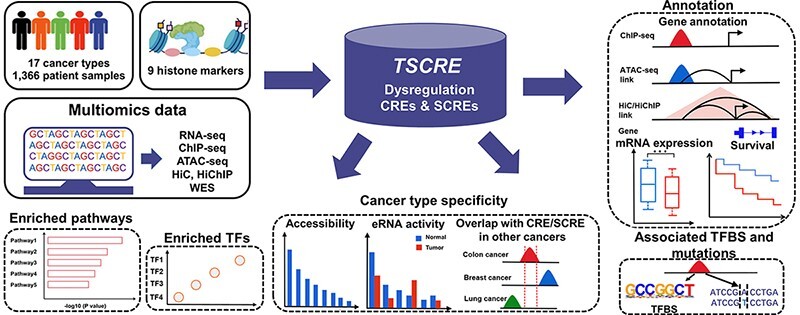
Graphical Abstract
Graphical Abstract.
Introduction
Cis-regulatory elements (CREs), including enhancers, promoters, and silencers, are crucial for controlling gene expression during development (1–3). Super cis-regulatory elements (SCREs), characterized by large clusters of regulatory regions, are essential in determining cell differentiation and identity (4–6). Numerous CREs and SCREs have been identified across human tissues and diseases. In the context of human cancers, the aberrant activity of CREs and SCREs can lead to the dysregulation of oncogenes and tumor suppressors, disrupting normal cellular processes and promoting cancer hallmarks such as proliferation, invasion and metastasis (7–9). Dysregulations in enhancers, super-enhancers, silencers, and promoters are common epigenetic alterations. For example, aberrant regulation of enhancers and super-enhancers have been frequently observed in various cancers, resulting in the upregulation of key oncogenes, such as MYC and FOXQ1 in colorectal cancer (10), as well as FOXC1 and MET in triple-negative breast cancer (11). Additionally, many silencers, characterized by extensive broad H3K27me3 modification, exhibit a significant reduction in H3K27me3 modification size in human tumors, thereby promoting the activation of oncogenes such as MYH11 and EGFR (12). Moreover, dysregulation of promoters, including promoter hypermethylation and alterations in H3K4me3 along with H3K27ac, is frequently observed in cancer (13,14). These dysregulations of CREs and SCREs exhibit specificity towards particular cancer types or subtypes, reflecting the unique epigenomic landscapes of different cells and tumors (15,16). Recent studies have highlighted the potential of dysregulated CREs and SCREs as promising targets for cancer diagnosis and treatment (17,18). For instance, the exclusive activity of the INSM1 promoter in insulinoma tumors has been leveraged for adenoviral therapy in insulinoma treatment (19). Therefore, the accumulating evidence for the essential roles of dysregulated CREs and SCREs in cancer biology, emphasizes the urgent need to comprehensively catalog dysregulated CREs and SCREs across various human cancer types.
Previous studies have demonstrated the efficiency and robustness of histone modification profiling in identifying distinct classes of regulatory elements (20–22). For example, promoters can be identified by the histone mark H3K4me3, enhancers by H3K4me1, active regulatory elements by H3K27ac, and repressive elements by either H3K27me3 or H3K9me3 (18). With the rapid accumulation of chromatin immunoprecipitation sequencing (ChIP-seq) data on histone marks, several CRE and SCRE databases have been developed, such as ENCODE (23), CistromeDB (24), ChIP-Atlas (25), SEdb v2.0 (26), SEA v3.0 (27) and dbSUPER (28). These databases serve as valuable resources for investigating cis-regulatory elements, but they primarily focus on profiling of CREs or SCREs within individual tissues and cells. There is an urgent need for the collection of feature-specific dysregulated elements in human cancers (e.g. tumor-specific, metastasis-specific, and subtype-specific elements). Additionally, besides super-enhancers, other broad regulatory elements, such as super repressive elements and broad H3K4me3 regions, have also been implicated in cancer (6,9,11,25,26), emphasizing the importance of their efficient identification and characterization. Moreover, further research on dysregulated CREs and SCREs heavily relies on reliable regulatory annotation, including genetic and epigenetic annotation, as well as association analyses involving transcription factors, cancer pathways, clinical prognosis, and response to anticancer drugs. Therefore, it is necessary to develop a comprehensive database dedicated to cancer-associated CREs and SCREs, elucidating their regulatory mechanisms in a highly cancer-specific context.
Here, we present TSCRE (http://tscre.zsqylab.com/), a comprehensive open resource of tumor-specific and cell type-specific CREs and SCREs derived through extensive re-analyses of public histone modification profiling data in human cancers (Figure 1, Supplementary Table S1). Using TSCRE, users are able to efficiently and intuitively explore dysregulated CREs or SCREs of interest in various cancer types of contrast experiments, such as ‘tumor vs. nonmalignant’, ‘metastasis vs. primary’, "mutant vs. wildtype’. We believe this platform will greatly benefit the research community by aiding in the screening of candidate CREs and SCREs, as well as facilitating the identification of relevant transcriptional regulators in human cancers.
Figure 1.

Overall design and construction of TSCRE.
Materials and methods
Data collection
A systematic search was conducted to find out cancer-associated histone modification profiles. Firstly, the GEO and SRA database were searched using keywords relating to nine of better-known histone markers (including H3K27ac, H3K4me3, H3K4me2, H3K4me1, H3K36me3, H3K9ac, H3K79me2, H3K9me3 and H3K27me3), along with the term ‘Genome binding/occupancy profiling by high throughput sequencing’. Datasets were restricted to human studies published before February 2023. Then we performed a manual screening and reserved studies that met the following criteria: 1) inclusion of tumor tissue or cancer cell lines, 2) samples in each study that could be compared based on a specific biological condition, including ‘tumor vs. non-malignant,’ ‘metastasis vs. primary,’ ‘mutant vs. wild-type’ or ‘subtype1 vs. subtype2’ and 3) presence of at least two biological replicates for each condition. In addition, matched RNA-seq data from the corresponding studies were downloaded when available.
The following additional datasets were collected: long-range interactions between genes and distal regulatory regions, including pan-cancer ‘enhancer-to-gene’ links from TCGA ATAC-seq projects (29), Hi-C loops from 3D Genome Browser (30), and HiChIP loops from matched studies. Other cis-regulatory elements were obtained from public resources, containing DNase I-hypersensitive sites (DHSs) from the ENCODE project (23), CREs from the FANTOM5 project (31), enhancers from GeneHancer (32), silencers from SilencerDB (33) and super-enhancers from a recent publication (34). Multi-omics data of pan-cancer tissues and cell lines were extracted from TCGA and DepMap projects, containing mRNA expression, somatic mutations, chromatin accessibility, clinical data and CRISPR scores (35,36). In addition, we also obtained enhancer RNA (eRNA) expression from the TCeA Portal and mutations from COSMIC (37,38). TFBSs from the ENCODE project and TF target genes from KnockTF were also included in our database (39). Lastly, we acquired pharmacogenomic data from GDSC2 and CTRP2, which involved drug response data from 198 and 545 compounds in various cancer lineages (40,41).
Data preprocessing
Raw ChIP-seq reads were trimmed using Trim-galore (version 0.6.6) and then aligned to the GRCh38 genome (ENSEMBL release 84) using BWA (version 0.7.17) with default parameters (42). Then uniquely mapped reads were extracted and sorted using SAMtools (version 1.7) program with the ‘-q 1’ option (43). PCR duplicates were removed using the Picard MarkDuplicates tool (version 2.26.2), and ENCODE blacklist regions were excluded using BEDtools (version v2.26.0) (44). MACS2 (Model-Based Analysis of ChIP-Seq, version 2.2.6) was applied to call peaks (refer to CREs) with the options ‘-q 0.01 –extsize = 146 –nomodel’ (45). Samples meeting all the following criteria are retained for further analysis: (i) duplication rates <0.5; (ii) mapping rates >0.6; (iii) at least 5 million usable fragments for narrow marks and 15 million for broad marks; (iv) peaks >500 and fraction of reads in peaks (FRiP) ≥1%.
Similarly, raw RNA-seq reads were processed to remove low-quality reads using Trim-galore (version 0.6.6) with default parameters. High-quality reads were then aligned to the GRCh38 genome using HISAT2 (version 7.2.0) and gene quantification was performed using the htseq-count program (version 0.11.3) with default settings (46,47). Samples with a mapping rate >0.6 and at least 10 million usable fragments were selected for differential gene expression analysis. The DESeq2 package or Wilcoxon test (≥8 samples in each given condition) were applied to identify differentially expressed genes, employing the criteria of ‘adjusted P-value <0.05 and absolute fold-change >1.5’ (48).
Dysregulated CRE/SCRE identification
Peaks modified by different histone markers, as identified in the previous section, were considered as CREs. DiffBind (version 3.6.5) was then used to compare CREs between two conditions and those with a fold change ≥1.5 and FDR <0.05 were selected as dysregulated CREs (49).
Among SCREs, the most extensively studied subset are super-enhancers, usually marked by H3K27ac modification. Rank Order of Super Enhancers (ROSE) is a commonly used method for identifying super-enhancers (5). Briefly, ROSE merged enhancer elements within a 12.5-kb distance and arranges them in decreasing order of intensities. Super-enhancers are then defined as stitching elements exhibiting a tangent slope with an inflection point value ≥1. ROSE (version 1.0) was also applied to identify super repressive elements enriched with H3K27me3 modification (6). Considering the potential variations in the stitching distance for different histone marks, we initially determined the most suitable distance for each histone mark by analyzing the histone modification peaks across various cell types from the ENCODE project. We merged peaks within different stitching distances for each dataset, ranging from 0.5 to 24 kb with 0.5 kb increments, and identified SCREs at each distance. We then counted the total number of peaks contained in SCREs and selected the optimal distance when the increasing number at that distance stabilized compared to the previous distance. As shown in Supplementary Figure S1, H3K27ac and H3K27me3 peaks within SCREs reached stability at 12 and 5 kb, respectively, which were close to the reported values of 12.5 and 4 kb. After obtaining the optimal distance for each histone marker (Supplementary Figure S1), we used ROSE to identify SCREs for each sample. Next, we employed the BEDtools multiinter function to find a consensus SCRE set of unique genomic intervals presenting in at least two samples for each study. Finally, DiffBind program was applied to identify the dysregulated SCREs and those with a fold change ≥1.5 and P value <0.05 were selected.
Annotations of dysregulated CRE/SCREs
We validated the accuracy of CREs and SCREs by checking whether they overlapped with regulatory regions obtained from ENCODE, FANTOM5, GeneHancer, SilencerDB and other existing literature (34). We then applied three gene annotation strategies to find the associated genes for each element. First, we mapped CREs to the nearest genes using the Homer annotatePeaks.pl function (50), while mapping SCREs to the nearest or overlapping genes with the help of ROSE_geneMapper.py function. Second, we associated distal CREs and SCREs with ATAC-seq-linked genes, which were established by the TCGA consortium based on the correlation between ATAC-Seq peaks and the expression levels of neighboring genes. Lastly, we assigned distal CREs and SCREs to their respective genes using Hi-C and HiChIP loops. To assist researchers in identifying the most relevant regulatory genes, we calculated mRNA expression level for each associated gene from available matched samples, pan-cancer tissues as well as cancer cell lines, and examine the survival outcome in cancer samples. Furthermore, associated TFBSs and somatic mutations were assigned to each CRE and SCRE using the BEDTools intersect program.
Assessing cancer-type specificity and examining associations with drug response
The cancer-type specificity of each regulatory element was determined by calculating its overlap with other elements in TSCRE, as well as by assessing the chromatin accessibility and enhancer RNA activity in the TCGA pan-cancer landscape. Additionally, we employed calcPhenotype function from the oncoPredict package to impute the drug response from GDSC and CTRP cancer cell lines to TCGA patient samples, after which we calculated the associations of each regulatory element with the imputed drug response (51). To achieve this, we trained linear ridge regression models using the expression levels and drug sensitivity scores of the cancer cell lines from GDSC and CTRP. These models were then applied to the expression levels of TCGA samples, generating predicted scores for drug sensitivity for each TCGA patient. Next, we evaluated the accessibility of each regulatory element in the corresponding TCGA patients using TCGA ATAC-seq signals, and further determined the associations between regulatory element accessibility and imputed drug response using Spearman correlation. Associations with |R| >0.3 and FDR <0.05 were considered as significant associations in each cancer type.
Identification of enriched TFs and biological functions
Enrichment analysis of TF binding sites was conducted for dysregulated elements using the Homer findMotifs.pl function and LOLA program, setting one condition's dysregulated CRE/SCREs as the foreground and the other's as the background (52). To gain a deeper understanding of the context specificity and essentiality of each significant TF (FDR < 0.01), we analyzed their corresponding expression levels in TCGA pan-cancer samples, gene dependency scores in cancer cell lines, and clinical prognosis. Furthermore, we introduced the KnockTF datasets and presented the potential downstream targets.
For biological functions, we employed the solo mode of Cistrome-GO program to perform pathway enrichment analysis by using the collections of gene sets from KEGG and GO-BP (53). A minimum-hypergeometric test was conducted to identify the enriched pathways with an FDR < 0.2. The detailed information about association analyses were listed in Supplementary Table S2.
Identification of tumor-specific and cell type-specific CREs and SCREs
To identify more CREs and SCREs that regulate oncogenes in tumor-specific and cell type-specific manners, we first selected the CREs and SCREs that demonstrated gained active modification or lost repressive modification in tumor samples compared with nonmalignant samples. We then employed a prioritization approach to select the most promising candidates from all association analyses based on the specific criteria. These criteria included: (i) enhanced expression of the associated gene, (ii) ranking within the top 5 for chromatin accessibility, (iii) ranking within the top 5 for eRNA activity and (iv) exhibiting an overlap of at least 50% in length with fewer than two cis-regulatory elements found in other cancer types. CREs and SCREs that met all these criteria were considered to have a high confidence level of tumor specificity and cancer-type specificity. Additionally, CREs and SCREs that satisfied three criteria achieved a median confidence level. Furthermore, CREs and SCREs that met two criteria were regarded as having a low confidence level.
Web interface implementation
All the metadata and analysis results were stored and managed using MySQL tables. The web interfaces were implemented using Hyper Text Markup Language (HTML), Cascading Style Sheets (CSS), and JavaScript (JS). To visualize all the analysis results, various statistical diagrams were shown by EChars and UCSC Genome Browser were implemented.
Results
Data summary
In the current release, TSCRE contains 138 carefully curated histone ChIP-seq datasets covering 1366 patient samples across 9 different histone marks and 17 different cancer types (Supplementary Table S1). Of these, 1034 samples were collected from patient tissues, while 332 samples were derived from cancer cell lines (Supplementary Table S1C). Across 17 cancer types, a total of 18 64 941 dysregulated CREs and 68 253 dysregulated SCREs were identified in one of the following conditions: ‘tumor versus nonmalignant’, ‘metastasis versus primary’, ‘mutant versus wildtype’ and ‘subtype1 versus subtype2’ (Table 1). Notably, approximately 95% of CREs and 99% of SCREs have been validated in at least one public resource, demonstrating the reproducibility and robustness of our data analyses.
Table 1.
Statistics of dysregulated CREs and SCREs in TSCRE
| Tumor versus nonmalignant | Metastasis versus primary | Mutant versus wildtype | Subtype1 versus Subtype2 | |||||
|---|---|---|---|---|---|---|---|---|

|
CRE | SCRE | CRE | SCRE | CRE | SCRE | CRE | SCRE |
| Colorectal cancer | 143 662 | 4878 | − | − | − | − | − | − |
| Uterine leiomyoma | 68 805 | 2481 | − | − | − | − | − | − |
| Gastric cancer | 58 686 | 2339 | − | − | − | − | − | − |
| Prostate cancer | 40 833 | 2422 | 68805 | 2170 | − | − | − | − |
| Liver cancer | 32 847 | 1187 | − | − | − | − | − | − |
| Kidney cancer | 32 209 | 3000 | 8 | 98 | − | − | 341 735 | 8502 |
| Glioma | 18 657 | 1481 | − | − | − | − | − | − |
| Esophageal cancer | 7841 | 442 | 2145 | 172 | − | − | 20 562 | 560 |
| Follicular lymphoma | 257 | 170 | − | − | − | − | − | − |
| Diffuse large B cell lymphoma | 339 | 82 | − | − | − | − | − | − |
| Natural killer T-cell lymphoma | 27 784 | 713 | − | − | − | − | − | − |
| Lung cancer | 25 066 | 1584 | − | − | − | − | − | − |
| Breast cancer | 543 577 | 17 615 | − | − | − | − | 296 088 | 11 537 |
| Head and neck cancer | 51 649 | 3276 | − | − | − | − | 9796 | 1052 |
| Pancreatic cancer | 7198 | 81 | 59 098 | 1669 | − | − | − | − |
| Osteosarcoma | − | − | 193 | 207 | − | − | − | − |
| Chronic lymphocytic leukemia | − | − | − | − | 7101 | 535 | − | − |
| Total | 1 059 410 | 41 751 | 130 249 | 4316 | 7101 | 535 | 668 181 | 21651 |
To facilitate further functional and mechanistic studies, systematic association analyses are integrated into TSCRE. First, we provide detailed gene annotation, associated TFBSs and somatic mutations for each dysregulated element. In addition to the nearest or overlapping genes, a total of 220 681 distal CREs and 44 639 distal SCREs were associated with specific genes through distal element-to-promoter loops. Additionally, 80.09% (1 493 595/1 864 941) of CREs and 99.96% (68 224/68 253) of SCREs exhibited one or more TFBSs. Moreover, 31 705 dysregulated CREs and 27 029 dysregulated SCREs had associated somatic mutations in the corresponding cancer type. These findings highlight the importance of cis-regulatory elements in addressing key issues related to cancer biology. Second, we accessed the cancer-type specificity of each regulatory element. Notably, a large proportion of CREs (83.8%) and SCREs (59.58%) show overlap with other regulatory elements in three or fewer cancer types, indicating a high degree of cancer-type specificity (Supplementary Figure S2). Third, we assessed the association between regulatory elements and imputed drug response in patients across various cancer types, providing a more direct and powerful evaluation of the role of CREs and SCREs in targeted therapy compared to in vitro cell lines. We obtained 20 812 864 associations between CRE accessibility and the imputed drug response, consisting of 6 531 763 associations detected from CTRP and 14 281 101 associations from GDSC. Similarly, 672 248 associations were found in SCREs. These data provide valuable insights into the potential impact of regulatory elements on drug response in cancer patients. The dysregulation of CRE and SCREs can influence transcriptional programs by facilitating or restricting the accessibility of transcript factor binding sites in a tumor-specific and cell type-specific manner, thereby mediating the activation of cancer-associated pathways. We further identified all enriched TFs and pathways for each study to promote follow-up functional and mechanistic studies. Additionally, we collected a comprehensive dataset comprising 683 TF knockout microarrays and RNA-seq data from the KnockTF database, enabling the identification of potential downstream targets.
Data access
TSCRE provides a user-friendly web interface, allowing users to intuitively explore and search any CRE or SCRE:
Explore. Users can select the cancer type(s), histone marker(s) and condition(s) of interest either through an interactive heatmap or a summary list. For example, if users are interested in studying tumor-specific regulatory elements in colorectal cancer, they can easily choose ‘colorectal cancer’ and ‘Tumor vs Nonmalignant’ from the metadata selection facet (Figure 2A). Subsequently, the relevant heatmap cells are retrieved (Figure 2A), and upon clicking on a specific cell, a dataset list is presented (Figure 2B). Data in TSCRE is organized into two layers: CRE and SCRE. By clicking on ‘CRE’ or ‘SCRE’ in a dataset of interest, users will be directed to a detailed page that provides study and sample details, CRE/SCRE information, as well as TF and pathway enrichment analysis. The CRE/SCRE information section shows all dysregulated elements and summarizes the number of association analyses conducted for each element (Figure 2C). Clicking on individual CRE ID shows the detailed information for each dysregulated element. The TF enrichment analysis section displays significantly enriched TFs identified in this study (Figure 2D). Some visualized figures are generated in real time to allow investigation of the cancer-type specificity and potential targets of enriched TFs (Figure 2E). For instance, HNF4A, a well-established gastrointestinal-specific transcription factor (54), ranked as the second most enriched TF in colorectal cancer-specific CREs (Figure 2D). HNF4A exhibited the highest expression levels in both colorectal cancer tissues and cell lines, regulated many target genes and was essential for the viability of the majority of colorectal cancer cells in the unbiased high-throughput CRISPR screening (Figure 2E). The pathway enrichment analysis section displays all enriched pathways associated with dysregulated elements and the top 10 pathways are shown in a bubble plot.
Figure 2.

A schematic workflow of the browse interface in TSCRE. (A) TSCRE provides an interactive heatmap and a summary list to browse and select studies of interest. Snapshot of results for colorectal cancer in ‘Tumor vs Nonmalignant’ condition. (B) A summary list is shown when clicking on a specific heatmap cell. Data in TSCRE is organized into two layers: CRE and SCRE. (C) The CRE information section shows all dysregulated elements and summarizes the number of association analyses conducted for each element. (D) Snapshot of HNF4A as the second most enriched TF. (E) Click the ‘eye’ button to get the expression levels of HNF4A in pan-cancer tissues and cell lines, the gene dependency scores, as well as potential target genes.
Search. TSCRE provides three modes to query the database, according to your interest in specific genes, transcription factors, and genomic regions. All the search results are summarized with real-time statistical diagrams and further filtered by check boxes.
Tumor-specific CREs and SCREs identified in TSCRE
TSCRE is a valuable resource to explore and discover cancer biomarkers. Through the analysis of the ‘Tumor vs Nonmalignant’ comparison, we identified 918 CREs and 405 SCREs that exhibited a high confidence level of tumor specificity and cancer-type specificity (see Materials and methods). Additionally, 24 821 CREs and 1948 SCREs met the criteria for the median confidence level. Furthermore, we identified 151 273 CREs and 3880 SCREs with a low confidence level (Supplementary Table S3). These cis-regulatory elements may aid in the discovery of candidate cancer biomarkers and enhance our knowledge of regulatory mechanisms in cancer. For example, CD70 is reported as a tumor-specific biomarker in kidney cancer, which promotes immune escape by inducing cytotoxic effects on B and T lymphocytes. Using TSCRE, we found CD70 was regulated by a distal enhancer (‘Pair_41_CRE330’) in kidney cancer, which were further validated by FANTOME5 enhancers and pan-cancer ATAC-seq links (Figure 3A). Notably, this enhancer exhibits a significant increase in H3K27ac signal in kidney cancer compared to nonmalignant samples (Figure 3B), which coincides with the upregulation of CD70 (Figure 3C). Moreover, this enhancer demonstrated a high degree of cell type specificity, as it ranked first in chromatin accessibility (Figure 3D) and second in eRNA activity (Figure 3E) within kidney cancer. Especially, only a single CRE in colon cancer exhibits partial overlap with this enhancer (Figure 3A). These findings indicate this enhancer associated with CD70 regulation is highly specific to kidney cancer. Another notable case is MERTK gene, which is known as an oncogene that promotes breast cancer progression (12). Consistently, nonmalignant samples encompass repressive CREs (known as silencers in SilencerDB) associated with MERTK. However, across all subtypes of breast cancer, there is a significant loss of H3K27me3 modification, coinciding with the upregulation of MERTK in most subtypes (Supplementary Figure S3). These results suggest that dysregulated CREs in TSCRE are highly specific to tumorigenesis and underscore their potential role in elucidating the molecular mechanisms underlying pathogenesis.
Figure 3.

The detailed information of a distal CRE for CD70. (A) Visualization of ‘Pair_41_CRE330’ using UCSC Genome Browser. (B, C) A significant increase in H3K27ac signal (B) and mRNA expression (C) was observed in kidney cancer. (D, E) Kidney cancer exhibits the highest chromatin accessibility (D) and the second-highest level of eRNA activity (E) within this CRE.
Similarly, dysregulated SCREs are also highly specific to tumorigenesis (Supplementary Figure S3B). For example, PDX1, a potential tumor marker in colorectal cancer (55) (Supplementary Figure S4A), contains both a lost repressive SCRE (‘Pair_18_SCRE66’) and a gained active SCRE (‘Pair_10_SCRE127’, a super-enhancer cataloged in Reference (34)) in colorectal cancer. In nonmalignant tissues, PDX1 is characterized by the presence of H3K27me3 signal and the absence of H3K27ac. In contrast, it undergoes a reduction in H3K27me3 and an increase in H3K27ac during tumorigenesis, accompanied by elevated mRNA expression. Additionally, this SCRE shows high cell type specificity, ranking first in both accessibility and eRNA activity.
In addition, TSCRE serves as a valuable platform for identifying potential therapeutic targets associated with dysregulated elements. An exemplary case is the EGFR gene, which exhibits frequent overexpression in basal breast cancer and contributes to the aggressive behavior of this subtype (56). Recent investigations have explored EGFR inhibitors, such as gefitinib and erlotinib, as potential treatment modalities for basal breast cancer (56). Encouragingly, our findings demonstrate a significant association between the drug response to gefitinib and erlotinib and a gained active SCRE ("Pair_92_SCRE61’, a super-enhancer cataloged in Reference (34)) in EGFR specific to basal breast cancer (Supplementary Figure S5). Remarkably, within TSCRE, a substantial proportion of CREs (628 993 out of 1 864 941) and SCREs (25 964 out of 68 253) are linked to drugs, suggesting their potential involvement in drug response or as therapeutic targets.
Discussion
TSCRE is a comprehensive open resource for providing dysregulated CREs and SCREs through the re-analysis of publicly available ChIP-seq data. In comparison to other existing databases, TSCRE possesses the following advantages: (i) To the best of our knowledge, TSCRE is the first comprehensive database focusing specifically on cis-regulatory elements in a highly cancer-associated context; (ii) TSCRE is the only database emphasizing the roles of both CREs and SCREs. (iii) In addition to super-enhancers, TSCRE also provides super repressive elements and other broad regions, which were modified with repressive marks (e.g. H3K27m3, H3K9me3) or other active marks (e.g. H3K4me3, H3K36me3). (iv) TSCRE provides detailed annotations for each CRE and SCRE, including gene annotation, mRNA expression, clinical prognosis, associated TFBSs, associated mutations and cancer-type specificity. These annotations assist biologists in identifying relevant biological features and discover novel cancer biomarkers. (v) TSCRE assesses the associations between dysregulated elements and drug response in cancer patients, potentially enabling more direct and impactful target therapy. (vi) TSCRE integrates the results of pathway and TF enrichment analysis to facilitate follow-up functional and mechanistic studies.
In the future, TSCRE will be continuously updated as new histone modification profiling data become available in public databases. We also plan to incorporate other epigenetic marks, such as DNA methylation, and more drug response dataset into TSCRE. Additionally, we strongly encourage users to contribute to TSCRE by uploading their own data.
Supplementary Material
Acknowledgements
YYZ was supported by the National Natural Science Foundation of China (32200538), Shenzhen Science and Technology Innovation Commission (JCYJ20220530144815036, JCYJ20230807110309019), the Research Start-up Fund of the Seventh Affiliated Hospital, Sun Yat-sen University (ZSQYBRJH0025). XPS was supported by the National Natural Science Foundation of China (82170177/H0809), the Natural Science Foundation of Guangdong Province (2021A1515011334 and 2023A1515011976). XTL was supported by the National Natural Science Foundation of China (32200542).
Author contributions: Y.Y. Zheng: conceptualization, resources, supervision, funding acquisition, methodology, writing–original draft, writing–review and editing. J. Ren: resources, supervision, methodology, writing–review and editing. X.P. Shi: resources, supervision, funding acquisition, methodology, writing–review and editing. G.J. Peng: data curation, data analysis, writing–original draft, writing–review and editing. B.Y. Liu: data curation, data analysis, writing–original draft, writing–review and editing. M.H. Zheng: website construction, visualization, methodology, writing–review and editing. L.W.Y. Zhang: website construction, visualization, methodology, writing–review and editing. H.Q. Li: website construction, methodology. MN. Liu: data curation, writing–review and editing. Y. Liang: data curation, writing–review and editing. T.J. Chen: website construction, methodology. X.T. Luo: resources, methodology and funding acquisition.
Contributor Information
Guanjie Peng, Clinical Big Data Research Center, Scientific Research Center, The Seventh Affiliated Hospital of Sun Yat-sen University, Shenzhen 518107, P.R. China; State Key Laboratory of Oncology in South China, Cancer Center, Collaborative Innovation Center for Cancer Medicine, School of Life Sciences, Sun Yat-sen University, Guangzhou 510060, China; Guangzhou Municipal and Guangdong Provincial Key Laboratory of Protein Modification and Degradation, Affiliated Cancer Hospital of Guangzhou Medical University, State Key Laboratory of Respiratory Disease, School of Basic Medical Sciences, Guangzhou Medical University, Guangzhou 510120, China.
Bingyuan Liu, Clinical Big Data Research Center, Scientific Research Center, The Seventh Affiliated Hospital of Sun Yat-sen University, Shenzhen 518107, P.R. China; State Key Laboratory of Oncology in South China, Cancer Center, Collaborative Innovation Center for Cancer Medicine, School of Life Sciences, Sun Yat-sen University, Guangzhou 510060, China; Guangzhou Municipal and Guangdong Provincial Key Laboratory of Protein Modification and Degradation, Affiliated Cancer Hospital of Guangzhou Medical University, State Key Laboratory of Respiratory Disease, School of Basic Medical Sciences, Guangzhou Medical University, Guangzhou 510120, China.
Mohan Zheng, State Key Laboratory of Oncology in South China, Cancer Center, Collaborative Innovation Center for Cancer Medicine, School of Life Sciences, Sun Yat-sen University, Guangzhou 510060, China.
Luowanyue Zhang, State Key Laboratory of Oncology in South China, Cancer Center, Collaborative Innovation Center for Cancer Medicine, School of Life Sciences, Sun Yat-sen University, Guangzhou 510060, China.
Huiqin Li, State Key Laboratory of Oncology in South China, Cancer Center, Collaborative Innovation Center for Cancer Medicine, School of Life Sciences, Sun Yat-sen University, Guangzhou 510060, China.
Mengni Liu, Clinical Big Data Research Center, Scientific Research Center, The Seventh Affiliated Hospital of Sun Yat-sen University, Shenzhen 518107, P.R. China.
Yuan Liang, Clinical Big Data Research Center, Scientific Research Center, The Seventh Affiliated Hospital of Sun Yat-sen University, Shenzhen 518107, P.R. China.
Tianjian Chen, State Key Laboratory of Oncology in South China, Cancer Center, Collaborative Innovation Center for Cancer Medicine, School of Life Sciences, Sun Yat-sen University, Guangzhou 510060, China.
Xiaotong Luo, Guangdong Institute of Gastroenterology, Department of General Surgery, Guangdong Provincial Key Laboratory of Colorectal and Pelvic Floor Diseases, The Sixth Affiliated Hospital, Sun Yat-sen University, Guangzhou 510060, China.
Xianping Shi, Guangzhou Municipal and Guangdong Provincial Key Laboratory of Protein Modification and Degradation, Affiliated Cancer Hospital of Guangzhou Medical University, State Key Laboratory of Respiratory Disease, School of Basic Medical Sciences, Guangzhou Medical University, Guangzhou 510120, China.
Jian Ren, State Key Laboratory of Oncology in South China, Cancer Center, Collaborative Innovation Center for Cancer Medicine, School of Life Sciences, Sun Yat-sen University, Guangzhou 510060, China.
Yueyuan Zheng, Clinical Big Data Research Center, Scientific Research Center, The Seventh Affiliated Hospital of Sun Yat-sen University, Shenzhen 518107, P.R. China.
Data availability
No new data were generated or analysed in support of this research.
Supplementary data
Supplementary Data are available at NAR Cancer Online.
Funding
The Young Scientists Fund of the National Natural Science Foundation of China [32200538, 32200542]; Shenzhen Science and Technology Innovation Commission [JCYJ20220530144815036, JCYJ20230807110309019]; The Natural Science Foundation of Guangdong Province [2021A1515011334, 2023A1515011976]; The National Natural Science Foundation of China [82170177/H0809]; Research Start-up Fund of the Seventh Affiliated Hospital, Sun Yat-sen University [ZSQYBRJH0025].
Conflict of interest statement. None declared.
References
- 1. Ong C.T., Corces V.G.. Enhancer function: new insights into the regulation of tissue-specific gene expression. Nat. Rev. Genet. 2011; 12:283–293. [DOI] [PMC free article] [PubMed] [Google Scholar]
- 2. Pang B., van Weerd J.H., Hamoen F.L., Snyder M.P.. Identification of non-coding silencer elements and their regulation of gene expression. Nat. Rev. Mol. Cell Biol. 2023; 24:383–395. [DOI] [PubMed] [Google Scholar]
- 3. Andersson R., Sandelin A.. Determinants of enhancer and promoter activities of regulatory elements. Nat. Rev. Genet. 2020; 21:71–87. [DOI] [PubMed] [Google Scholar]
- 4. Madani Tonekaboni S.A., Haibe-Kains B., Lupien M.. Large organized chromatin lysine domains help distinguish primitive from differentiated cell populations. Nat. Commun. 2021; 12:499. [DOI] [PMC free article] [PubMed] [Google Scholar]
- 5. Whyte W.A., Orlando D.A., Hnisz D., Abraham B.J., Lin C.Y., Kagey M.H., Rahl P.B., Lee T.I., Young R.A.. Master transcription factors and mediator establish super-enhancers at key cell identity genes. Cell. 2013; 153:307–319. [DOI] [PMC free article] [PubMed] [Google Scholar]
- 6. Cai Y., Zhang Y., Loh Y.P., Tng J.Q., Lim M.C., Cao Z., Raju A., Lieberman Aiden E., Li S., Manikandan L.et al.. H3K27me3-rich genomic regions can function as silencers to repress gene expression via chromatin interactions. Nat. Commun. 2021; 12:719. [DOI] [PMC free article] [PubMed] [Google Scholar]
- 7. Hsieh I.Y., He J., Wang L., Lin B., Liang Z., Lu B., Chen W., Lu G., Li F., Lv W.et al.. H3K27me3 loss plays a vital role in CEMIP mediated carcinogenesis and progression of breast cancer with poor prognosis. Biomed. Pharmacother. 2020; 123:109728. [DOI] [PubMed] [Google Scholar]
- 8. Loven J., Hoke H.A., Lin C.Y., Lau A., Orlando D.A., Vakoc C.R., Bradner J.E., Lee T.I., Young R.A.. Selective inhibition of tumor oncogenes by disruption of super-enhancers. Cell. 2013; 153:320–334. [DOI] [PMC free article] [PubMed] [Google Scholar]
- 9. Chen K., Chen Z., Wu D., Zhang L., Lin X., Su J., Rodriguez B., Xi Y., Xia Z., Chen X.et al.. Broad H3K4me3 is associated with increased transcription elongation and enhancer activity at tumor-suppressor genes. Nat. Genet. 2015; 47:1149–1157. [DOI] [PMC free article] [PubMed] [Google Scholar]
- 10. Cohen A.J., Saiakhova A., Corradin O., Luppino J.M., Lovrenert K., Bartels C.F., Morrow J.J., Mack S.C., Dhillon G., Beard L.et al.. Hotspots of aberrant enhancer activity punctuate the colorectal cancer epigenome. Nat. Commun. 2017; 8:14400. [DOI] [PMC free article] [PubMed] [Google Scholar]
- 11. Huang H., Hu J., Maryam A., Huang Q., Zhang Y., Ramakrishnan S., Li J., Ma H., Ma V.W.S., Cheuk W.et al.. Defining super-enhancer landscape in triple-negative breast cancer by multiomic profiling. Nat. Commun. 2021; 12:2242. [DOI] [PMC free article] [PubMed] [Google Scholar]
- 12. Zhao D., Zhang L., Zhang M., Xia B., Lv J., Gao X., Wang G., Meng Q., Yi Y., Zhu S.et al.. Broad genic repression domains signify enhanced silencing of oncogenes. Nat. Commun. 2020; 11:5560. [DOI] [PMC free article] [PubMed] [Google Scholar]
- 13. Bouras E., Karakioulaki M., Bougioukas K.I., Aivaliotis M., Tzimagiorgis G., Chourdakis M.. Gene promoter methylation and cancer: an umbrella review. Gene. 2019; 710:333–340. [DOI] [PubMed] [Google Scholar]
- 14. Qamra A., Xing M., Padmanabhan N., Kwok J.J.T., Zhang S., Xu C., Leong Y.S., Lee Lim A.P., Tang Q., Ooi W.F.et al.. Epigenomic promoter alterations amplify gene isoform and immunogenic diversity in gastric adenocarcinoma. Cancer Discov. 2017; 7:630–651. [DOI] [PubMed] [Google Scholar]
- 15. Mack S.C., Pajtler K.W., Chavez L., Okonechnikov K., Bertrand K.C., Wang X., Erkek S., Federation A., Song A., Lee C.et al.. Therapeutic targeting of ependymoma as informed by oncogenic enhancer profiling. Nature. 2018; 553:101–105. [DOI] [PMC free article] [PubMed] [Google Scholar]
- 16. Li G.H., Qu Q., Qi T.T., Teng X.Q., Zhu H.H., Wang J.J., Lu Q., Qu J.. Super-enhancers: a new frontier for epigenetic modifiers in cancer chemoresistance. J. Exp. Clin. Cancer Res. 2021; 40:174. [DOI] [PMC free article] [PubMed] [Google Scholar]
- 17. Tang F., Yang Z., Tan Y., Li Y.. Super-enhancer function and its application in cancer targeted therapy. NPJ Precis. Oncol. 2020; 4:2. [DOI] [PMC free article] [PubMed] [Google Scholar]
- 18. Xu Y., Hou J., Liu Z., Yu H., Sun W., Xiong J., Liao Z., Zhou F., Xie C., Zhou Y.. Gene therapy with tumor-specific promoter mediated suicide gene plus IL-12 gene enhanced tumor inhibition and prolonged host survival in a murine model of Lewis lung carcinoma. J. Transl. Med. 2011; 9:39. [DOI] [PMC free article] [PubMed] [Google Scholar]
- 19. Tseng A.W., Chen C., Breslin M.B., Lan M.S.. Tumor-specific promoter-driven adenoviral therapy for insulinoma. Cell Oncol (Dordr). 2016; 39:279–286. [DOI] [PubMed] [Google Scholar]
- 20. Muratani M., Deng N., Ooi W.F., Lin S.J., Xing M., Xu C., Qamra A., Tay S.T., Malik S., Wu J.et al.. Nanoscale chromatin profiling of gastric adenocarcinoma reveals cancer-associated cryptic promoters and somatically acquired regulatory elements. Nat. Commun. 2014; 5:4361. [DOI] [PubMed] [Google Scholar]
- 21. Heintzman N.D., Stuart R.K., Hon G., Fu Y., Ching C.W., Hawkins R.D., Barrera L.O., Van Calcar S., Qu C., Ching K.A.et al.. Distinct and predictive chromatin signatures of transcriptional promoters and enhancers in the human genome. Nat. Genet. 2007; 39:311–318. [DOI] [PubMed] [Google Scholar]
- 22. Akhtar-Zaidi B., Cowper-Sal-lari R., Corradin O., Saiakhova A., Bartels C.F., Balasubramanian D., Myeroff L., Lutterbaugh J., Jarrar A., Kalady M.F.et al.. Epigenomic enhancer profiling defines a signature of colon cancer. Science. 2012; 336:736–739. [DOI] [PMC free article] [PubMed] [Google Scholar]
- 23. Luo Y., Hitz B.C., Gabdank I., Hilton J.A., Kagda M.S., Lam B., Myers Z., Sud P., Jou J., Lin K.et al.. New developments on the Encyclopedia of DNA Elements (ENCODE) data portal. Nucleic Acids Res. 2020; 48:D882–D889. [DOI] [PMC free article] [PubMed] [Google Scholar]
- 24. Zheng R., Wan C., Mei S., Qin Q., Wu Q., Sun H., Chen C.H., Brown M., Zhang X., Meyer C.A.et al.. Cistrome Data Browser: expanded datasets and new tools for gene regulatory analysis. Nucleic Acids Res. 2019; 47:D729–D735. [DOI] [PMC free article] [PubMed] [Google Scholar]
- 25. Zou Z., Ohta T., Miura F., Oki S.. ChIP-Atlas 2021 update: a data-mining suite for exploring epigenomic landscapes by fully integrating ChIP-seq, ATAC-seq and bisulfite-seq data. Nucleic Acids Res. 2022; 50:W175–W182. [DOI] [PMC free article] [PubMed] [Google Scholar]
- 26. Wang Y., Song C., Zhao J., Zhang Y., Zhao X., Feng C., Zhang G., Zhu J., Wang F., Qian F.et al.. SEdb 2.0: a comprehensive super-enhancer database of human and mouse. Nucleic Acids Res. 2023; 51:D280–D290. [DOI] [PMC free article] [PubMed] [Google Scholar]
- 27. Chen C., Zhou D., Gu Y., Wang C., Zhang M., Lin X., Xing J., Wang H., Zhang Y.. SEA version 3.0: a comprehensive extension and update of the Super-Enhancer archive. Nucleic Acids Res. 2020; 48:D198–D203. [DOI] [PMC free article] [PubMed] [Google Scholar]
- 28. Khan A., Zhang X.. dbSUPER: a database of super-enhancers in mouse and human genome. Nucleic Acids Res. 2016; 44:D164–D171. [DOI] [PMC free article] [PubMed] [Google Scholar]
- 29. Corces M.R., Granja J.M., Shams S., Louie B.H., Seoane J.A., Zhou W., Silva T.C., Groeneveld C., Wong C.K., Cho S.W.et al.. The chromatin accessibility landscape of primary human cancers. Science. 2018; 362:eaav1898. [DOI] [PMC free article] [PubMed] [Google Scholar]
- 30. Wang Y., Song F., Zhang B., Zhang L., Xu J., Kuang D., Li D., Choudhary M.N.K., Li Y., Hu M.et al.. The 3D genome Browser: a web-based browser for visualizing 3D genome organization and long-range chromatin interactions. Genome Biol. 2018; 19:151. [DOI] [PMC free article] [PubMed] [Google Scholar]
- 31. Noguchi S., Arakawa T., Fukuda S., Furuno M., Hasegawa A., Hori F., Ishikawa-Kato S., Kaida K., Kaiho A., Kanamori-Katayama M.et al.. FANTOM5 CAGE profiles of human and mouse samples. Sci. Data. 2017; 4:170112. [DOI] [PMC free article] [PubMed] [Google Scholar]
- 32. Fishilevich S., Nudel R., Rappaport N., Hadar R., Plaschkes I., Iny Stein T., Rosen N., Kohn A., Twik M., Safran M.et al.. GeneHancer: genome-wide integration of enhancers and target genes in GeneCards. Database (Oxford). 2017; 2017:bax028. [DOI] [PMC free article] [PubMed] [Google Scholar]
- 33. Zeng W., Chen S., Cui X., Chen X., Gao Z., Jiang R.. SilencerDB: a comprehensive database of silencers. Nucleic Acids Res. 2021; 49:D221–D228. [DOI] [PMC free article] [PubMed] [Google Scholar]
- 34. Hnisz D., Abraham B.J., Lee T.I., Lau A., Saint-Andre V., Sigova A.A., Hoke H.A., Young R.A.. Super-enhancers in the control of cell identity and disease. Cell. 2013; 155:934–947. [DOI] [PMC free article] [PubMed] [Google Scholar]
- 35. Ghandi M., Huang F.W., Jane-Valbuena J., Kryukov G.V., Lo C.C., McDonald E.R., Barretina J., Gelfand E.T., Bielski C.M., Li H.et al.. Next-generation characterization of the Cancer Cell Line Encyclopedia. Nature. 2019; 569:503–508. [DOI] [PMC free article] [PubMed] [Google Scholar]
- 36. Cancer Genome Atlas Research, N. Weinstein J.N., Collisson E.A., Mills G.B., Shaw K.R., Ozenberger B.A., Ellrott K., Shmulevich I., Sander C., Stuart J.M. The cancer genome atlas pan-cancer analysis project. Nat. Genet. 2013; 45:1113–1120. [DOI] [PMC free article] [PubMed] [Google Scholar]
- 37. Chen H., Liang H.. A high-resolution map of Human enhancer RNA loci characterizes super-enhancer activities in cancer. Cancer Cell. 2020; 38:701–715. [DOI] [PMC free article] [PubMed] [Google Scholar]
- 38. Tate J.G., Bamford S., Jubb H.C., Sondka Z., Beare D.M., Bindal N., Boutselakis H., Cole C.G., Creatore C., Dawson E.et al.. COSMIC: the catalogue of somatic mutations In cancer. Nucleic Acids Res. 2019; 47:D941–D947. [DOI] [PMC free article] [PubMed] [Google Scholar]
- 39. Feng C., Song C., Liu Y., Qian F., Gao Y., Ning Z., Wang Q., Jiang Y., Li Y., Li M.et al.. KnockTF: a comprehensive human gene expression profile database with knockdown/knockout of transcription factors. Nucleic Acids Res. 2020; 48:D93–D100. [DOI] [PMC free article] [PubMed] [Google Scholar]
- 40. Rees M.G., Seashore-Ludlow B., Cheah J.H., Adams D.J., Price E.V., Gill S., Javaid S., Coletti M.E., Jones V.L., Bodycombe N.E.et al.. Correlating chemical sensitivity and basal gene expression reveals mechanism of action. Nat. Chem. Biol. 2016; 12:109–116. [DOI] [PMC free article] [PubMed] [Google Scholar]
- 41. Yang W., Soares J., Greninger P., Edelman E.J., Lightfoot H., Forbes S., Bindal N., Beare D., Smith J.A., Thompson I.R.et al.. Genomics of Drug Sensitivity in Cancer (GDSC): a resource for therapeutic biomarker discovery in cancer cells. Nucleic Acids Res. 2013; 41:D955–D961. [DOI] [PMC free article] [PubMed] [Google Scholar]
- 42. Li H., Durbin R.. Fast and accurate long-read alignment with Burrows-Wheeler transform. Bioinformatics. 2010; 26:589–595. [DOI] [PMC free article] [PubMed] [Google Scholar]
- 43. Li H., Handsaker B., Wysoker A., Fennell T., Ruan J., Homer N., Marth G., Abecasis G., Durbin R.Genome Project Data Processing, S . The sequence alignment/map format and SAMtools. Bioinformatics. 2009; 25:2078–2079. [DOI] [PMC free article] [PubMed] [Google Scholar]
- 44. Quinlan A.R., Hall I.M.. BEDTools: a flexible suite of utilities for comparing genomic features. Bioinformatics. 2010; 26:841–842. [DOI] [PMC free article] [PubMed] [Google Scholar]
- 45. Liu T. Use model-based analysis of ChIP-Seq (MACS) to analyze short reads generated by sequencing protein-DNA interactions in embryonic stem cells. Methods Mol. Biol. 2014; 1150:81–95. [DOI] [PubMed] [Google Scholar]
- 46. Kim D., Langmead B., Salzberg S.L.. HISAT: a fast spliced aligner with low memory requirements. Nat. Methods. 2015; 12:357–360. [DOI] [PMC free article] [PubMed] [Google Scholar]
- 47. Anders S., Pyl P.T., Huber W.. HTSeq–a Python framework to work with high-throughput sequencing data. Bioinformatics. 2015; 31:166–169. [DOI] [PMC free article] [PubMed] [Google Scholar]
- 48. Love M.I., Huber W., Anders S.. Moderated estimation of fold change and dispersion for RNA-seq data with DESeq2. Genome Biol. 2014; 15:550. [DOI] [PMC free article] [PubMed] [Google Scholar]
- 49. Ross-Innes C.S., Stark R., Teschendorff A.E., Holmes K.A., Ali H.R., Dunning M.J., Brown G.D., Gojis O., Ellis I.O., Green A.R.et al.. Differential oestrogen receptor binding is associated with clinical outcome in breast cancer. Nature. 2012; 481:389–393. [DOI] [PMC free article] [PubMed] [Google Scholar]
- 50. Heinz S., Benner C., Spann N., Bertolino E., Lin Y.C., Laslo P., Cheng J.X., Murre C., Singh H., Glass C.K.. Simple combinations of lineage-determining transcription factors prime cis-regulatory elements required for macrophage and B cell identities. Mol. Cell. 2010; 38:576–589. [DOI] [PMC free article] [PubMed] [Google Scholar]
- 51. Maeser D., Gruener R.F., Huang R.S.. oncoPredict: an R package for predicting in vivo or cancer patient drug response and biomarkers from cell line screening data. Brief Bioinform. 2021; 22:bbab260. [DOI] [PMC free article] [PubMed] [Google Scholar]
- 52. Sheffield N.C., Bock C.. LOLA: enrichment analysis for genomic region sets and regulatory elements in R and bioconductor. Bioinformatics. 2016; 32:587–589. [DOI] [PMC free article] [PubMed] [Google Scholar]
- 53. Li S., Wan C., Zheng R., Fan J., Dong X., Meyer C.A., Liu X.S.. Cistrome-GO: a web server for functional enrichment analysis of transcription factor ChIP-seq peaks. Nucleic Acids Res. 2019; 47:W206–W211. [DOI] [PMC free article] [PubMed] [Google Scholar]
- 54. Sang L., Wang X., Bai W., Shen J., Zeng Y., Sun J.. The role of hepatocyte nuclear factor 4alpha (HNF4alpha) in tumorigenesis. Front. Oncol. 2022; 12:1011230. [DOI] [PMC free article] [PubMed] [Google Scholar]
- 55. Ballian N., Liu S.H., Brunicardi F.C.. Transcription factor PDX-1 in human colorectal adenocarcinoma: a potential tumor marker?. World J. Gastroenterol. 2008; 14:5823–5826. [DOI] [PMC free article] [PubMed] [Google Scholar]
- 56. Masuda H., Zhang D., Bartholomeusz C., Doihara H., Hortobagyi G.N., Ueno N.T.. Role of epidermal growth factor receptor in breast cancer. Breast Cancer Res. Treat. 2012; 136:331–345. [DOI] [PMC free article] [PubMed] [Google Scholar]
Associated Data
This section collects any data citations, data availability statements, or supplementary materials included in this article.
Supplementary Materials
Data Availability Statement
No new data were generated or analysed in support of this research.