

Abstract
BACKGROUND:
Racial/ethnic survival disparities in neuroblastoma were first reported more than a decade ago. We sought to investigate if these disparities have persisted with current era therapy.
METHODS:
Two patient cohorts were identified in the International Neuroblastoma Risk Group Data Commons (INRGdc) (Cohort 1: diagnosed 2001–2009, n=4359; Cohort 2: diagnosed 2010–2019, n=4891). Chi-squared tests were used to assess the relationship between race/ethnicity and clinical and biologic features. Survival was estimated by the Kaplan-Meier method. Cox proportional hazards regression analyses were performed to investigate the association between racial/ethnic groups and prognostic markers.
RESULTS:
Significantly higher 5-year event-free survival (EFS) and overall survival (OS) were observed for Cohort 2 compared to Cohort 1 (P<0.001 and P<0.001, respectively). Compared to White patients, Black patients in both cohorts had a higher proportion of high-risk disease (Cohort 1: P<0.001; Cohort 2: P<0.001) and worse EFS (Cohort 1: P<0.001; Cohort 2 P<0.001) and OS (Cohort 1: P<0.001; Cohort 2: P<0.001). In Cohort 1, Native Americans also had a higher proportion of high-risk disease (P=0.03) and inferior EFS/OS. No significant survival disparities were observed for low- or intermediate-risk patients in either cohort or high-risk patients in Cohort 1. Hispanic patients with high-risk disease in Cohort 2 had significantly inferior OS (P=0.047). Significantly worse OS, but not EFS, (P=0.006 and P=0.02, respectively) was also observed among Black and Hispanic patients assigned to receive post-Consolidation dinutuximab on clinical trials (n=885).
CONCLUSION:
Racial/ethnic survival disparities have persisted over time and were observed among high-risk patients assigned to receive post-Consolidation dinutuximab.
Keywords: Race, ethnicity, disparities, neuroblastoma
INTRODUCTION
Neuroblastoma is notable for its broad spectrum of clinical behavior.1 Modern treatment, which is stratified by prognostic biomarkers,2 has led to improved survival for high-risk patients3–10 and reductions in therapy for patients with intermediate- and low-risk disease.11–15 More than 10 years ago, we reported that Black and Native American patients enrolled on the ANBL00B1 Children’s Oncology Group (COG) Biology study were significantly more likely to present with high-risk disease and have inferior event-free survival (EFS) compared to White patients.16 Adjustment for risk group abrogated the differences in EFS. To confirm our original findings and investigate if racial/ethnic survival disparities persist in an era of contemporary therapy, including post-Consolidation immunotherapy, we analyzed patients in the International Neuroblastoma Risk Group Data Commons (INRGdc; Cohort 1: diagnosed 2001–2009, n=4,359 and Cohort 2: diagnosed 2010–2019, n=4,891).
METHODS
Study Design and Patient Cohort
Data from patients with neuroblastoma diagnosed from 2001–2019 were abstracted from the INRGdc.17 The data included age at diagnosis, year of diagnosis, sex, self/family-reported race and ethnicity, International Neuroblastoma Staging System (INSS) stage,18 therapeutic clinical trial enrollment and arm assignment (if applicable), tumor MYCN status,19 tumor cell ploidy,20 histologic classification of tumor,21 and survival. Risk stratification was determined using the 2006 COG classification system utilizing an algorithm previously described.2,22,23 Racial groups obtained from the INRGdc were categorized as: American Indian/Alaskan Native (hereafter referred to as Native American); Asian or Hawaiian/Pacific Islander (hereafter referred to as Asian); Black or African American (hereafter referred to as Black); and White. Ethnicity information was categorized as Hispanic and non-Hispanic. A combined race/ethnicity variable was created taking into consideration both the racial and ethnic backgrounds and coded as follows: non-Hispanic White (White), non-Hispanic Black (Black), Native American, Asian, and Hispanic. Patient/family selection of more than one race/ethnicity is not captured in the database and was thus not available for analysis. Although patient information from multiple cooperative groups is housed in the INRGdc, race/ethnicity data are currently only available for COG patients, and the analysis was, therefore, restricted to COG patients. The INRGdc and data use are approved by the University of Chicago institutional review board, which waived consent as all data were deidentified. This study followed the reporting requirements of the Strengthening and Reporting of Observational Studies in Epidemiology (STROBE) reporting guideline.
The patients were divided into two independent cohorts based on date of diagnosis (Cohort 1: 2001 to 2009; Cohort 2: 2010 to 2019). Patients were excluded for the following reasons: unable to be risk stratified based on available data, missing race/ethnicity data, or missing survival data. Patients enrolled on Regimen B of ANBL00326,8 (NCT00026312) or the single arm study ANBL093124 (NCT01041638) were analyzed as patients assigned to receive post-Consolidation immunotherapy with the anti-GD2 antibody dinutuximab.
Statistical Analysis
Chi-squared tests were used to assess the relationship between race/ethnicity and clinical and biologic features. Pairwise comparisons across these factors were performed with White patients serving as the reference group. The Kaplan-Meier method was utilized to estimate EFS and overall survival (OS) from the time of diagnosis and differences in survival between groups was assessed with the log-rank test.25 Univariate Cox proportional hazards regression modelling was performed to investigate the association between racial/ethnic groups and INSS stage, sex, tumor MYCN status, tumor cell ploidy, tumor histology, and risk group assignment.26 Factors significant in univariate analysis were incorporated into multivariable Cox proportional hazards regression models and reported as hazard ratios (HR). Factors where more than 20% of patients were missing data were dropped from the model.23 To account for differences in factors that define risk group, Cox proportional hazards models run on all Cohort 1 or Cohort 2 patients were stratified by risk status. Cox proportional hazards models run on patients who received post-Consolidation dinutuximab were stratified by tumor MYCN-amplification status, as this variable was noted to violate the proportional hazards assumption. The proportional hazards assumption was validated for all remaining variables in each model through an evaluation of Schoenfeld residuals.27 All hypothesis tests were two-sided, and P-values <0.05 were considered statistically significant. There were insufficient numbers of Native American patients for analyses evaluating high-risk cohorts. Risk as a covariate was excluded from Cox regression analyses performed on patients assigned to receive dinutuximab, as all patients were high-risk patients. Statistical analyses were performed using Stata, version 17 (StataCorp LLC).
RESULTS
A total of 10,313 COG patients diagnosed between 2001 and 2019 were identified in the INRGdc. Patients with unknown survival information (n=852), race or ethnicity (n=636), and risk status (n=356) were excluded. The remaining 8,508 patients were divided into two analytic cohorts: Cohort 1: diagnosed 2001–2009, n=4359 and Cohort 2: diagnosed 2010–2019, n=4891 (Figure 1). Clinical characteristics and biologic features of patients in Cohorts 1 and 2 are summarized in Table A.1. The proportions of White, Hispanic, Black, Asian, and Native American patients were not significantly different in Cohorts 1 and 2 (Table 1). The proportion of patients with high-risk disease in Cohorts 1 and 2 was not statistically different (40.3% versus 41.2%, P=0.38) (Table 1).
FIGURE 1: Consort Diagram.
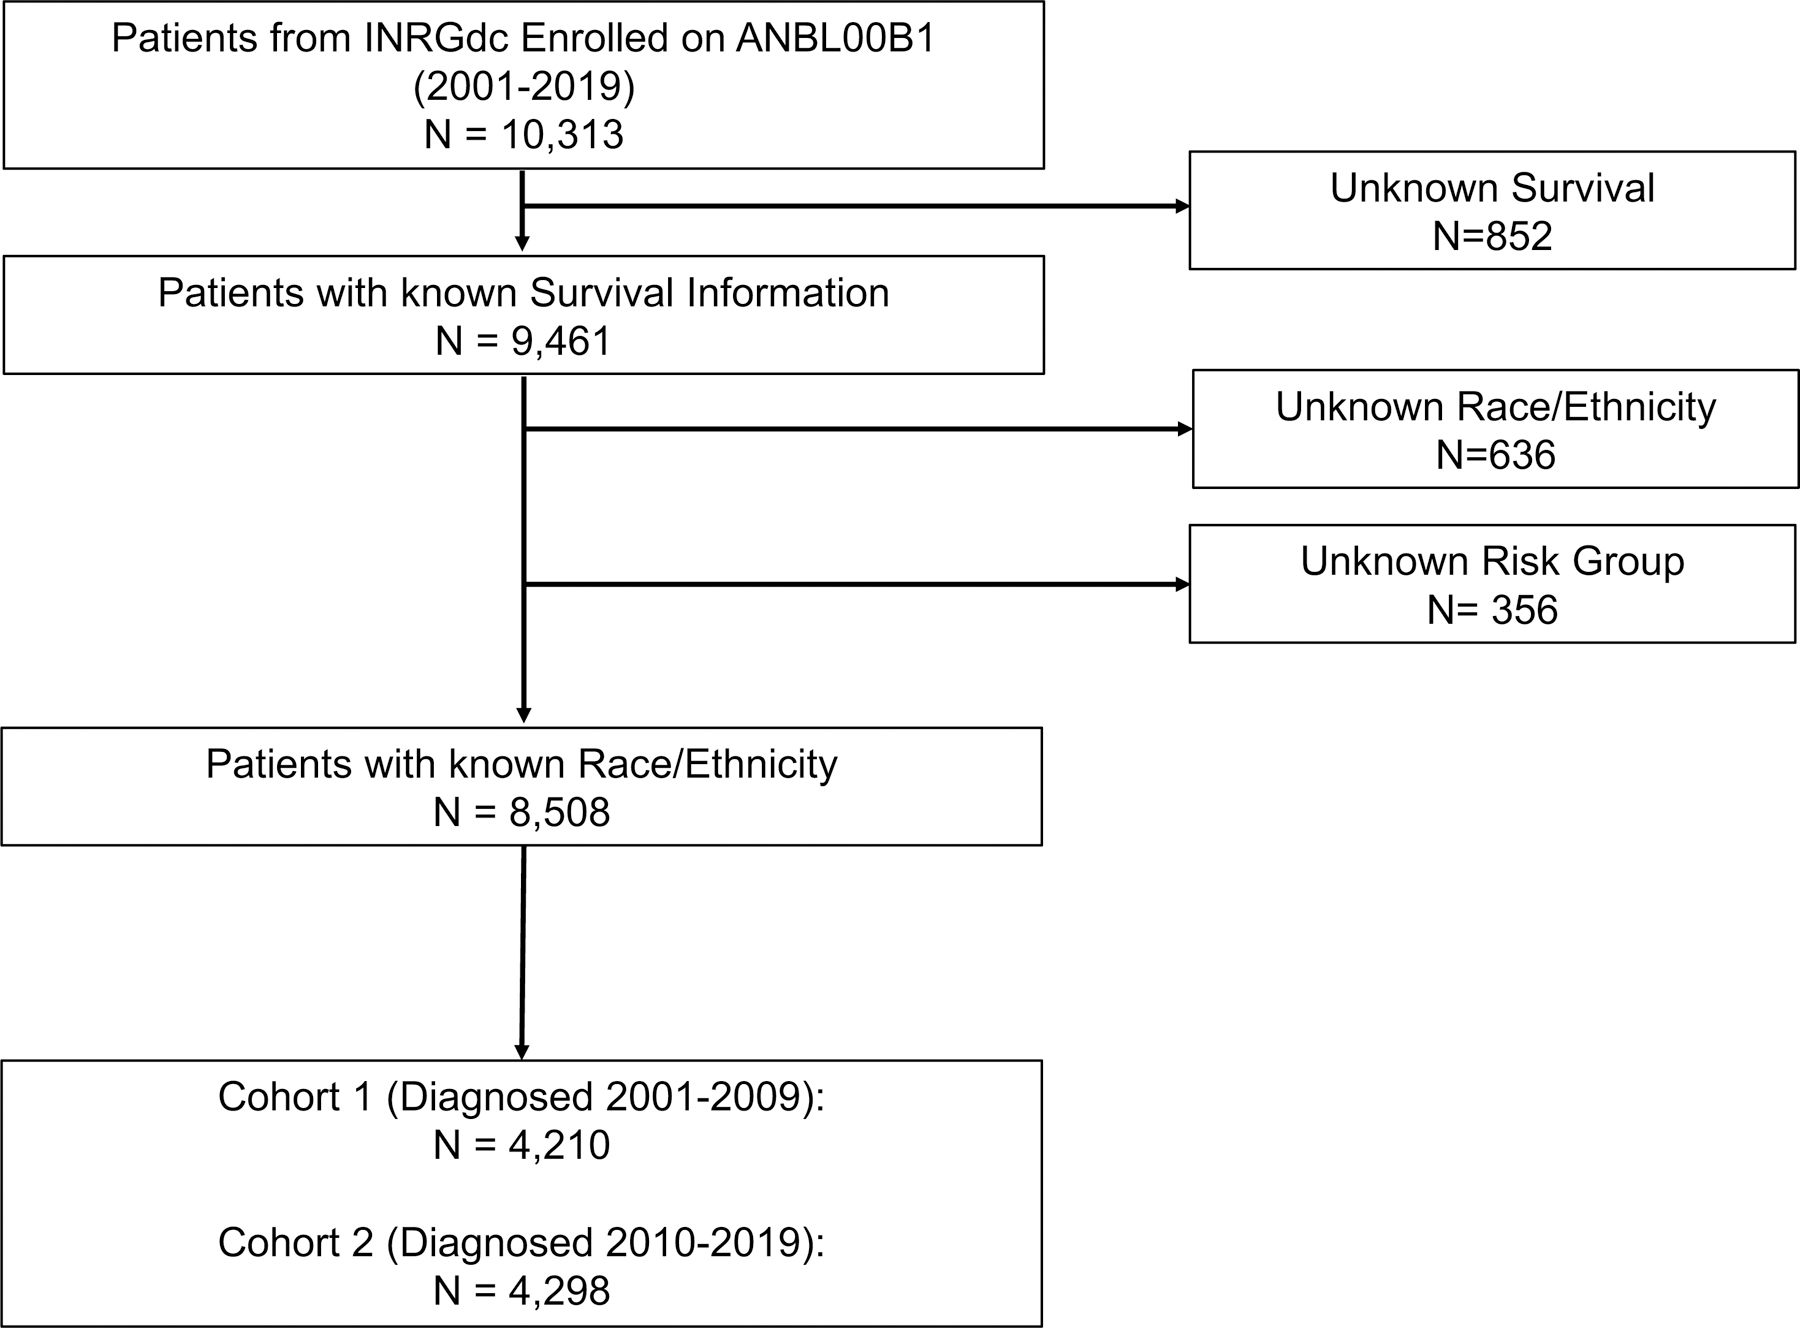
INRGdc, International Neuroblastoma Risk Group Data Commons.
Table 1:
Baseline Clinical and Biologic Characteristics by Cohort
| Total (N = 8,508) |
Cohort 1 Diagnosed 2001–2009 (N = 4,210) |
Cohort 2 Diagnosed 2010–2019 (N = 4,298) |
P value a | |
|---|---|---|---|---|
| No. (%) | ||||
| Age at Diagnosis | ||||
| < 18 mo | 3,842 (45.2) | 2,012 (47.8) | 1,830 (42.6) | <0.001 |
| ≥ 18 mo | 4,666 (54.8) | 2,198 (52.2) | 2,468 (57.4) | |
| INSS Stage | ||||
| 1, 2, 3, 4S | 4,929 (57.9) | 2,454 (58.3) | 2,475 (57.6) | 0.51 |
| 4 | 3,579 (42.1) | 1,756 (41.7) | 1,823 (42.4) | |
| Sex | ||||
| Male | 4,486 (52.7) | 2,250 (53.4) | 2,236 (52.0) | 0.19 |
| Female | 4,022 (47.3) | 1,960 (46.6) | 2,062 (48.0) | |
| MYCN Status | ||||
| Not Amplified | 6,531 (82.0) | 3,223 (81.7) | 3,308 (82.3) | 0.49 |
| Amplified | 1,436 (18.0) | 723 (18.3) | 713 (17.7) | |
| Unknown | 541 | 264 | 277 | |
| Ploidy | ||||
| Hyperdiploid | 4,552 (62.9) | 2,490 (65.4) | 2,062 (60.1) | <0.001 |
| Hypodiploid or Diploid | 2,689 (37.1) | 1,318 (34.6) | 1,371 (39.9) | |
| Unknown | 1,267 | 402 | 865 | |
| Histology | ||||
| Favorable | 4,218 (54.6) | 2,141 (56.4) | 2,077 (52.9) | 0.002 |
| Unfavorable | 3,505 (45.4) | 1,657 (43.6) | 1,848 (47.1) | |
| Unknown | 785 | 412 | 373 | |
| Risk Group | ||||
| Low | 3,200 (37.6) | 1,546 (36.7) | 1,654 (38.5) | 0.009 b |
| Intermediate | 1,842 (21.7) | 969 (23.0) | 873 (20.3) | |
| High | 3,466 (40.7) | 1,695 (40.3) | 1,771 (41.2) | |
| Race/Ethnicity | ||||
| White | 6,037 (71.0) | 3,033 (72.0) | 3,004 (69.9) | 0.06 |
| Black | 937 (11.0) | 466 (11.1) | 471 (11.0) | |
| Hispanic | 1,129 (13.3) | 519 (12.3) | 610 (14.2) | |
| Asian | 362 (4.3) | 175 (4.2) | 187 (4.4) | |
| Native American | 43 (0.5) | 17 (0.4) | 26 (0.6) | |
INSS, International Neuroblastoma Staging System
P-value represents chi-square comparison of Cohort 1 versus 2
Comparison of proportion of patients with high-risk disease vs. non-high-risk disease between Cohorts 1 and 2 was not statistically significantly different (P=0.38)
A significantly higher proportion of Black patients had stage 4 disease compared to White patients (47.2% versus 40.9%, P=0.01) in Cohort 1, and a trend associating increased frequency of stage 4 disease in Black patients was also seen in Cohort 2 (46.7% versus 42.1%, P=0.06). Compared to White patients, a higher proportion of Black patients in both cohorts were ≥18 months at diagnosis ([Cohort 1: 61.4% versus 51.5%, P<0.001], [Cohort 2: 67.9% versus 55.8%, P<0.001]), had tumors with unfavorable histology ([Cohort 1: 53.2% versus 42.9%, P<0.001], [Cohort 2: 58.4% vs. 45.8%, P<0.001]), and had high-risk disease ([Cohort 1: 48.7% versus 39.4%, P<0.001]; [Cohort 2: 50.5% versus 40.4%, P<0.001]). In Cohort 1, a higher proportion of Native American patients had high-risk disease compared to White patients (64.7% vs. 39.4%, P=0.03). In Cohort 2, a higher proportion of Asian patients were diagnosed at age ≥18 months compared to White patients (65.2% versus 55.8%, P=0.01).
Survival Outcomes
Survival Probabilities by Cohort
The median follow-up time for patients in Cohort 1 was 7.1 years (IQR 3–10.7 years) and 5 years (IQR 2.6–7.6 years) for those in Cohort 2. Compared to Cohort 1, Cohort 2 patients had significantly higher 5-year EFS (74.7% [95% CI: 73.3–76.0] vs 69.8% [95% CI: 68.4–71.2]; P<0.001) and OS (83.2% [95% CI: 82.0–84.4] vs 78.1% [95% CI: 76.8–79.4]; P<0.001) (Figures 2A, 2B). Age ≥18 months, INSS stage 4, male sex, tumor MYCN-amplification, tumor cell diploidy, unfavorable histology tumors, and high-risk status were significantly associated with worse EFS/OS in both Cohorts (Table A.2).
FIGURE 2: Survival analysis of Cohort 1 and 2 patients.
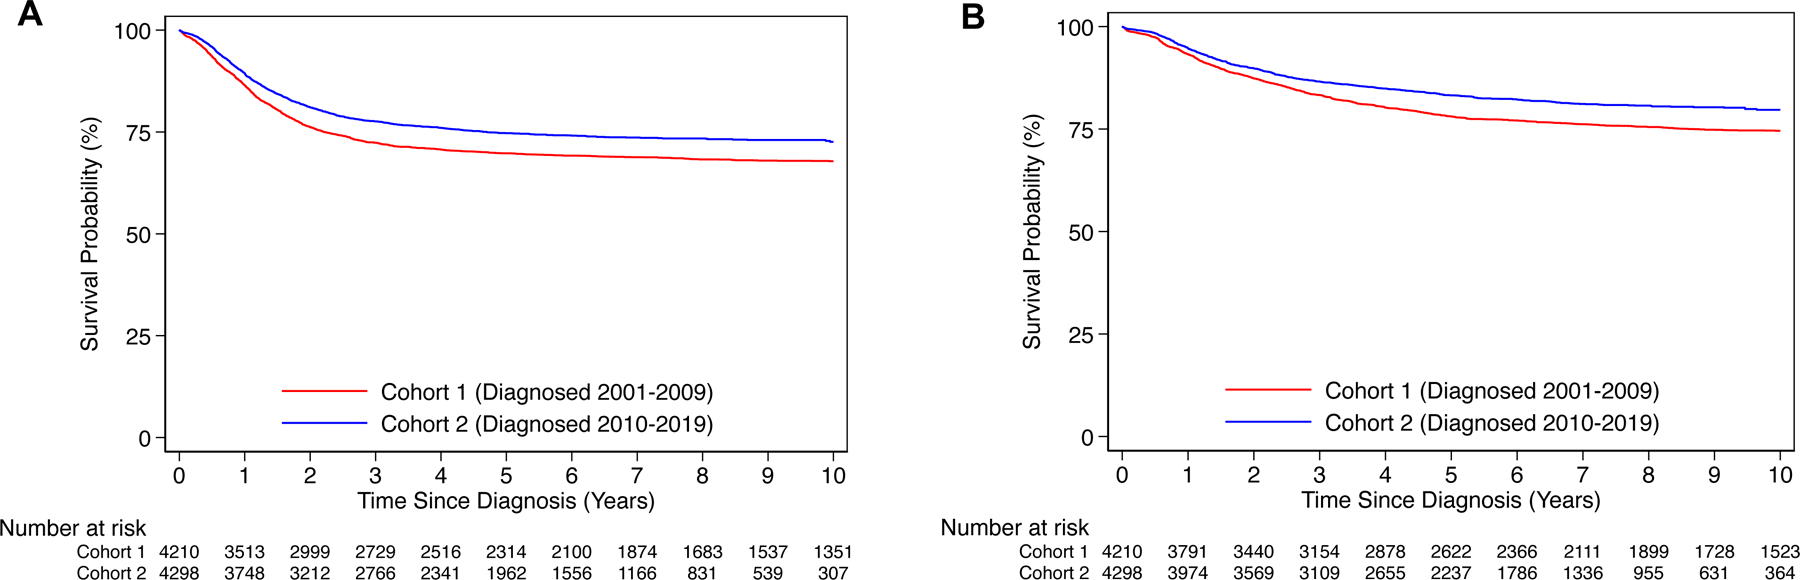
A) Event-free and B) overall survival for patients in Cohort 1 (Year of Diagnosis: 2001–2009; n=4,210) and Cohort 2 (Year of Diagnosis: 2001–2009; n=4,298).
Survival Probabilities by Race/Ethnicity
Cohort 1:
The 5-year EFS was 70.8% (95% CI: 69.1–72.4) for White patients, 62.3% (95% CI: 57.5–66.6) for Black patients, 72.1% (95% CI: 67.9–75.9) for Hispanic patients, 70.5% (95% CI: 62.6–77.0) for Asian patients, 33.1% (95% CI: 12.4–55.7) for Native American patients (Figure 3A). The 5-year OS was 79.2% (95% CI: 77.7–80.7) for White patients, 72.0% (95% CI: 67.4–76.0) for Black patients, 79.0% (95% CI: 75.1–82.4) for Hispanic patients, 76.9% (95% CI: 69.4–82.8) for Asian patients, 37.7% (95% CI: 15.0–60.5) for Native American patients (Figure 3B). In comparison to White patients, Black patients had significantly worse EFS (HR 1.33, 95% CI: 1.13–1.57, P<0.001) and OS (HR 1.44, 95% CI: 1.20–1.73, P<0.001), and Native American patients had significantly worse EFS (HR 2.92, 95% CI: 1.61–5.29, P<0.001) and OS (HR 3.72, 95% CI: 1.99–6.94, P<0.001) in univariate analysis (Table A.2). Adjustment for risk group abrogated the significant differences in EFS/OS for Black patients in comparison to White patients. However, inferior EFS (HR 2.25, 95% CI: 1.24–4.08, P=0.008) and OS (HR 2.90, 95% CI: 1.55–5.42, P=0.001) were identified for Native Americans after risk-group stratification (Table A.3). No significant differences were noted in EFS/OS by univariate or multivariable analysis for Asian patients.
FIGURE 3: Survival analysis of Cohort 1 and 2 patients, by race/ethnicity.
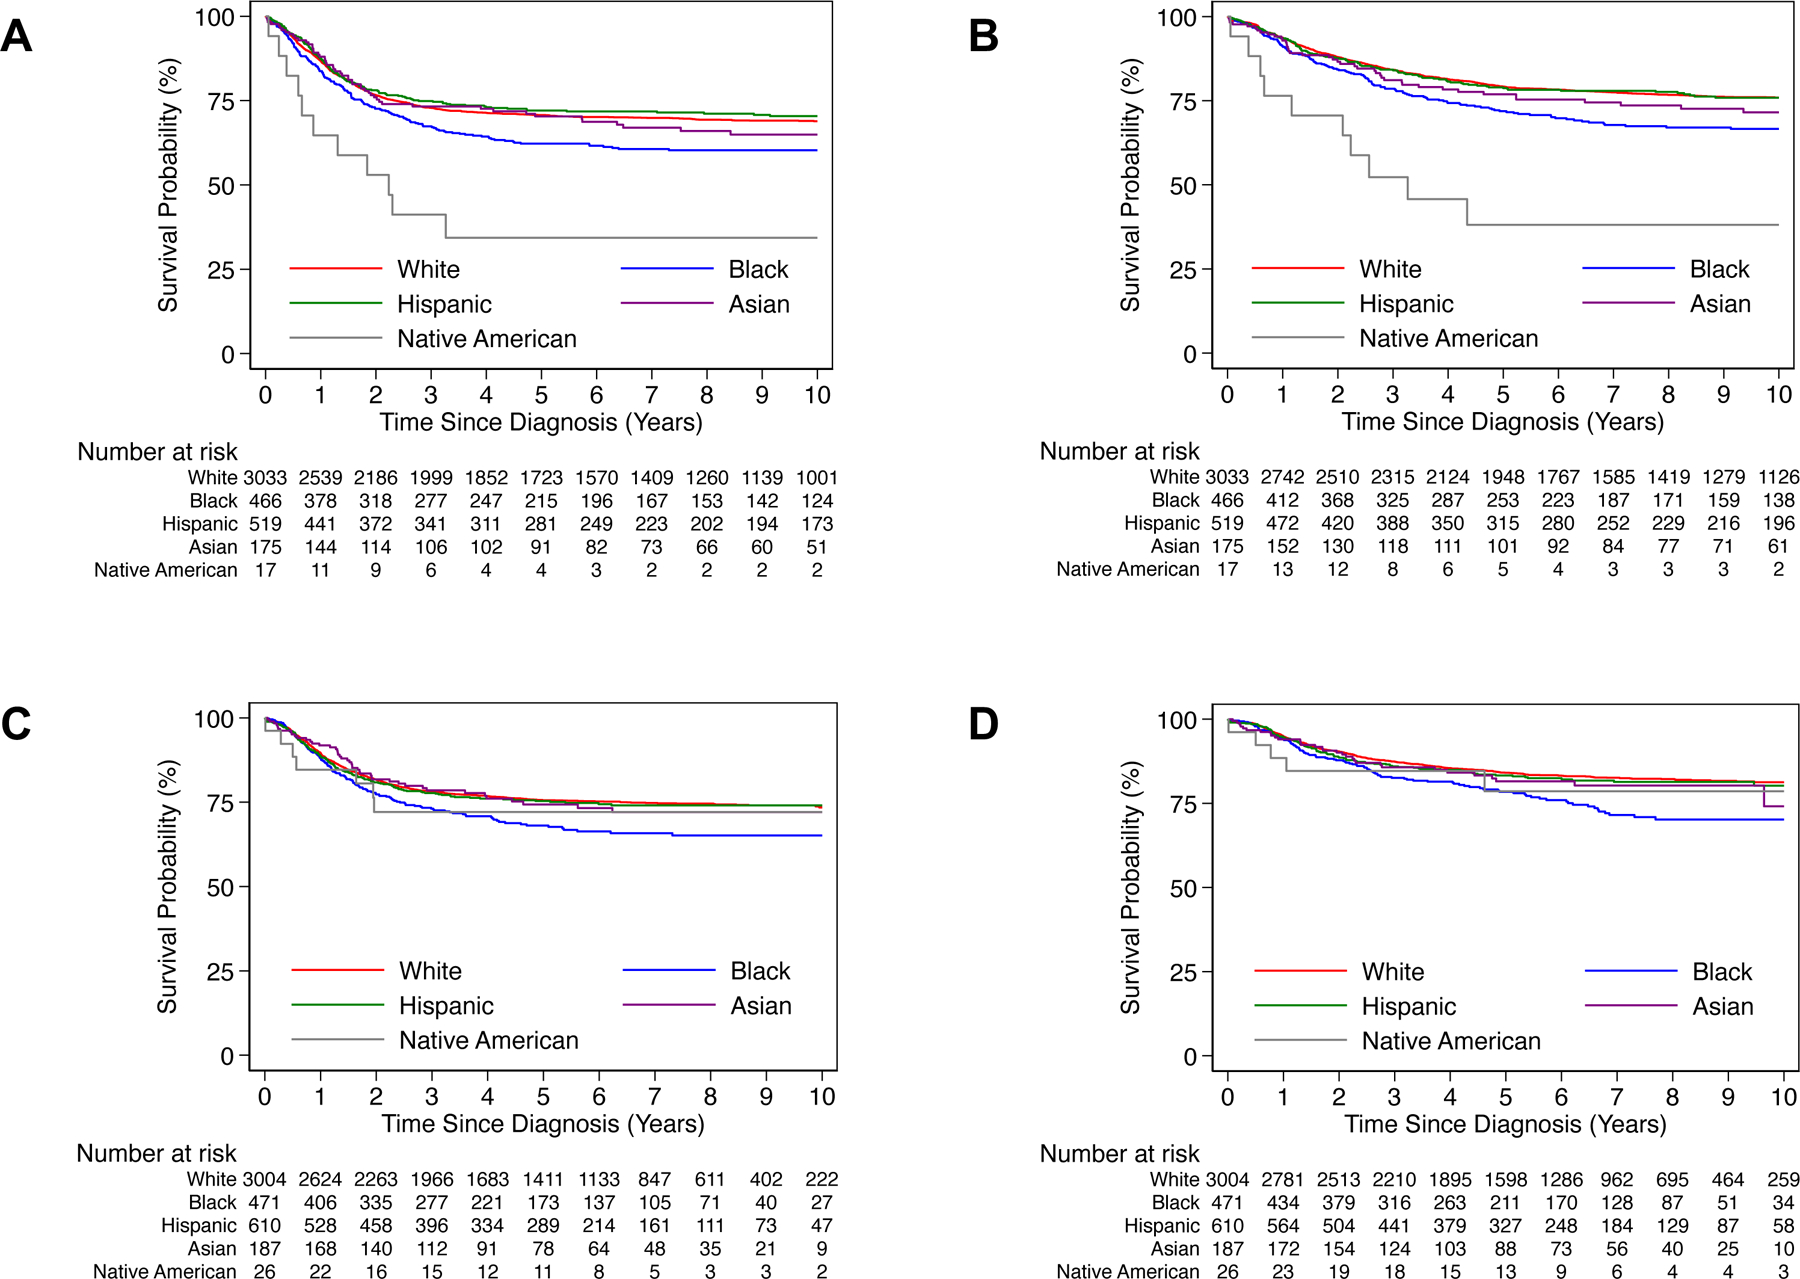
A) Event-free and B) overall survival by race/ethnicity for Cohort 1 patients. C) Event-free and D) overall survival by race/ethnicity for Cohort 2 patients.
Cohort 2:
In Cohort 2, 5-year EFS was 75.6% (95% CI: 73.9–77.1) for White patients, 68.0% (95% CI: 63.2–72.3) for Black patients, 75.3% (95% CI: 71.5–78.6) for Hispanic patients, 74.5% (95% CI: 67.0–80.5) for Asian patients, 72.2% (95% CI: 50.3–85.7) for Native American patients (Figure 3C). The 5-year OS was 84.1% (95% CI: 82.7–85.4) for White patients, 78.4% (95% CI: 74.0–82.1) for Black patients, 83.2% (95% CI: 79.8–86.1) for Hispanic patients, 81.6% (95% CI: 74.5–86.8) for Asian patients, 78.5% (95% CI: 55.1–90.7) for Native American patients (Figure 3D). Univariate analysis revealed significantly worse EFS (HR 1.35, 95% CI: 1.13–1.62, P<0.001) and OS (HR 1.54, 95% CI: 1.25–1.90, P<0.001) for Black patients in comparison to White patients (Table A.2). After risk-group stratification, significantly worse OS was identified for Black patients compared to White patients (HR 1.27, 95% CI: 1.03–1.56, P=0.03), although EFS did not differ significantly. A trend towards significantly worse OS (HR 1.23, 95% CI: 0.99–1.53, P=0.06) was also identified for Hispanic patients compared to White patients; EFS was not significantly different (Table A.3). No significant differences were noted in EFS/OS by univariate or multivariable analysis for Asian or Native American patients.
Patients with missing race or ethnicity data did not have significantly different EFS/OS compared to White patients in either Cohort (Table A.4).
Survival According to Risk Group Assignment
Low-risk:
Among patients with low-risk disease in Cohort 1, the 5-year EFS was 90.4% (95% CI: 88.8–91.8) and the 5-year OS was 97.8% (95% CI: 96.9–98.4). Among patients with low-risk disease in Cohort 2, the 5-year EFS was 90.6% (95% CI: 89.0–91.9) and the 5-year OS was 97.7% (95% CI: 96.8–98.4). No significant differences in EFS/OS by race/ethnicity were observed for low-risk patients in either cohort.
Intermediate-risk:
Among patients with intermediate-risk disease in Cohort 1, the 5-year EFS was 85.4% (95% CI: 83.0–87.5) and the 5-year OS was 94.7% (95% CI: 93.0–95.9). Among patients with intermediate-risk disease in Cohort 2, the 5-year EFS was 87.6% (95% CI: 85.2–89.7) and the 5-year OS was 94.9% (95% CI: 93.2–96.2). Among intermediate-risk patients in Cohorts 1 or 2, no significant differences in EFS/OS by race/ethnicity were identified.
High-risk:
The 5-year EFS was 43.2% (95% CI: 40.8–45.7) and the 5-year OS was 52.2% (95% CI: 49.7–54.6) for Cohort 1 high-risk patients. In Cohort 2, the 5-year EFS was 54.4% (95% CI: 52.0–56.8) and 5-year OS was 65.0% (95% CI: 62.6–67.3). Among White, Black, Asian, and Hispanic high-risk patients in either cohort, EFS did not differ significantly, and OS also was not significantly different in these populations in Cohort 1. In Cohort 2, only Hispanic patients had significantly inferior OS compared to White patients (HR 1.26, 95% CI: 1.00–1.59, P=0.047).
Survival Among Patients Assigned to Post-Consolidation Dinutuximab
Among high-risk patients diagnosed between 2001–2014 assigned to receive post-Consolidation dinutuximab (n=885), 5-year EFS was 61.5% (95% CI: 58.2–64.6) and 5-year OS was 75.1% (95% CI: 72.1–77.9). Five-year EFS was 63.6% (95% CI: 59.7–67.1) for White patients, 64.0% (95% CI: 45.3–77.7) for Asian patients, 55.6% (95% CI: 46.1–64.0) for Black patients, and 55.2% (95% CI: 45.0–64.2) for Hispanic patients (Figure 4A). Five-year OS was 76.4% (95% CI: 72.9–79.5) for White patients, 78.6% (95% CI: 60.2–89.2) for Asian patients, 73.9% (95% CI: 64.9–80.8) for Black patients, and 68.5% (95% CI: 58.5–76.5) for Hispanic patients (Figure 4B). Black and Hispanic patients had significantly worse OS in comparison to White patients by univariate analysis (HR 1.56, 95% CI: 1.13–2.13, P=0.006; HR 1.51, 95% CI: 1.07–2.12, P=0.02, respectively) and multivariable modeling (HR 1.64, 95% CI: 1.15–2.34, P=0.006; HR 1.62, 95% CI: 1.10–2.40, P=0.015, respectively) (Table A.5). EFS for Black and Hispanic patients were not statistically different compared to White patients. No significant differences were noted in EFS/OS for Asian patients compared to White patients. Patients with missing race or ethnicity data did not have significantly different EFS/OS compared to White patients (Table A.6).
FIGURE 4: Survival analysis of high-risk patients diagnosed between 2001–2014 assigned to receive post-Consolidation dinutuximab, by race/ethnicity.
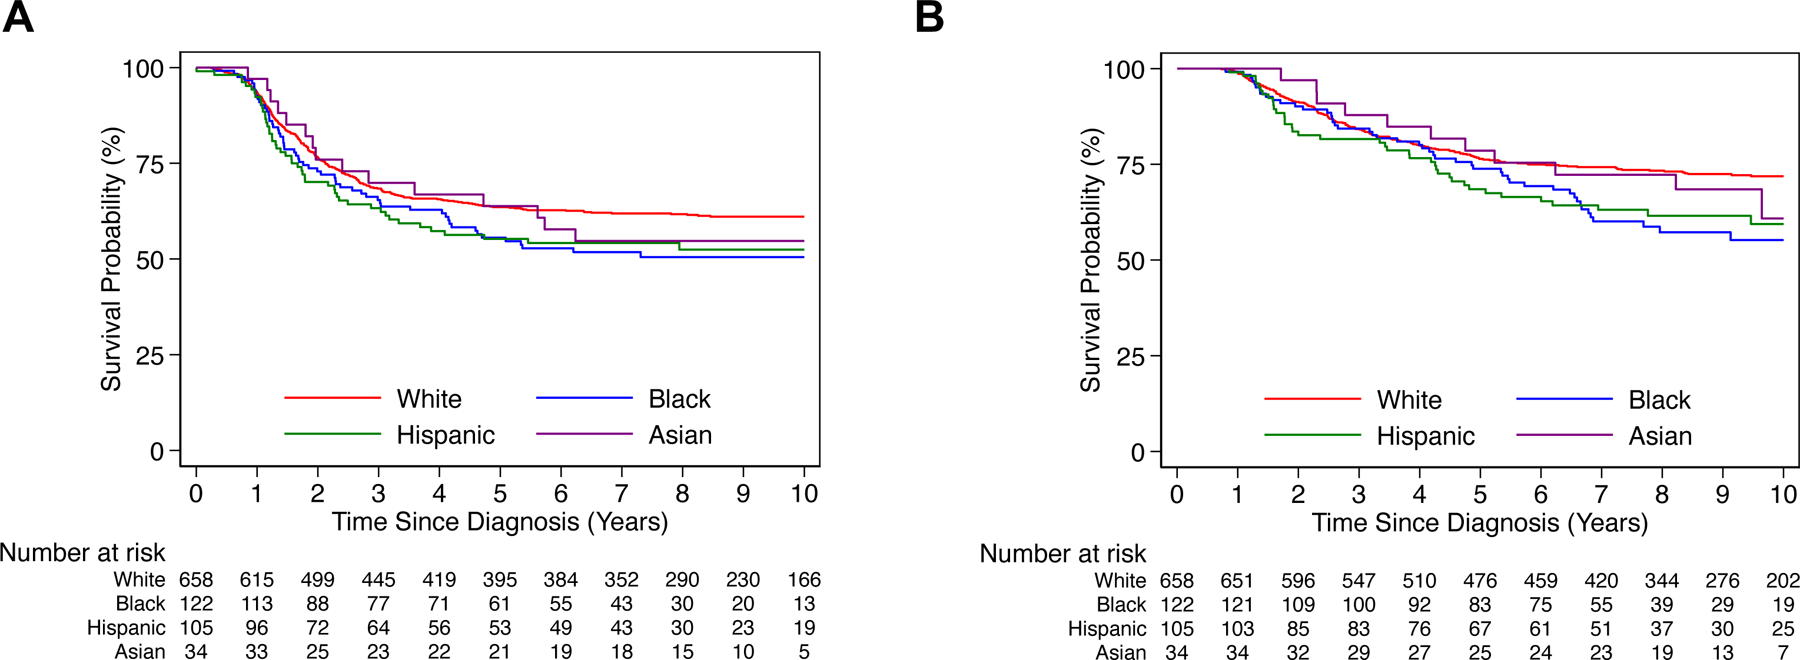
A) Event-free and B) overall survival by race/ethnicity for high-risk patients diagnosed between 2001–2014 assigned to receive post-Consolidation dinutuximab (n=885).
DISCUSSION
In this analysis of 8,508 neuroblastoma patients, racial/ethnic disparities in survival were observed in patients diagnosed between 2000–2009 (Cohort 1) and 2010–2019 (Cohort 2). Therapy has changed during the past 2 decades,5,6,28 and the significantly better survival observed for Cohort 2 reflects the advances in treatment for high-risk patients, including the addition of post-Consolidation dinutuximab.5–8 In both cohorts, Black patients had a higher prevalence of high-risk disease at diagnosis and worse outcome compared to White patients. In Cohort 1, Native Americans also had a higher proportion of high-risk disease and were found to have inferior EFS/OS; however, these findings were not identified in Cohort 2. Among high-risk patients in Cohort 2, Hispanic patients had significantly inferior OS compared to White patients.
Race and ethnicity were self- or parent-reported in our study. However, a previous analysis of genotypes in a racial and ethnically admixed population of COG neuroblastoma patients demonstrated that African genomic ancestry correlated with self-reported Black race and was significantly associated with high-risk neuroblastoma and lower EFS.29 Germline DNA variants have also been associated with susceptibility to high- or low-risk neuroblastoma in genome-wide studies conducted primarily in children of European descent,30–32 further demonstrating the influence of genetic variation on neuroblastoma phenotype. Indeed, there is increasing evidence that racial/ethnic differences in gene expression and molecular pathways in many types of adult cancers contribute to the observed disparities in incidence and mortality rates.33,34
In our analysis of 885 high-risk patients enrolled on COG clinical trials and assigned to post-Consolidation dinutuximab, Black and Hispanic patients had significantly worse OS compared to White patients. This contrasts the results of a previous study of 371 high-risk patients treated with dinutuximab at Pediatric Health Information System centers that showed inferior survival was associated with poverty but not race/ethnity.35 A recent analysis of high-risk neuroblastoma patients from the National Cancer Institute’s Surveillance, Epidemiology, and End Results (SEER) database also showed that poverty was significantly associated with worse survival but racial/ethnic survival disparities were not observed.36 However, in an analysis of 31,866 pediatric cancer patients identified in the SEER database, Kehm et al., reported that social determinants of health including socioeconomic status (SES) contributed to racial/ethnic survival disparities in patients with neuroblastoma and other cancer types.37 Although the reasons for the divergent results remain unclear, they likely are due to differences in the study cohorts. Because SES data are not available the INRGdc, we were not able to investigate associations between poverty, race/ethnicity, and survival.
The strengths of this population-based study are the large numbers and the inclusion of patients enrolled on the COG biology study, which captures 70% to 80% of all patients with neuroblastoma diagnosed in North America.23 Further, our group has demonstrated that OS does not differ between patients with high-risk neuroblastoma enrolled on a therapeutic trial versus biology study.23 The lack of available SES data is a limitation of this study. Also, information about treatment received is not available in the INRGdc. However, the vast majority of patients enrolled on post-Consolidation COG immunotherapy trials received their designated treatment assignment.6,8
Our results demonstrate that racial/ethnic survival disparities have persisted over the past 20 years in patients with neuroblastoma, despite advances in current era therapy. Survival disparities were also observed among high-risk patients assigned to post-Consolidation dinutuximab. Efforts to elucidate the causes of these population-based differences in survival may provide insight for new strategies to mitigate these disparities and improve outcome.
Supplementary Material
ACKNOWLEDEGMENTS
Research support for the study:
This work was supported in part by the Burroughs Wellcome Fund Early Scientific Training Program to Prepare for Research Excellence Post-Graduation (BEST-PREP; MC); Cancer Center Support Grant P30CA014599 (Biostatistical Core Facility; SL, YC); The Hoban Family Pediatric Cancer Fund (SLC); MacRitchie Family donation (SLC); the Herbert & Nell Singer Foundation (SLC).
The INRG Data Commons is supported by the St. Baldrick’s Foundation, the Little Heroes Cancer Research Fund, Children’s Neuroblastoma Cancer Foundation, Neuroblastoma Children’s Cancer Foundation, the Super Jake Foundation, the Alex’s Lemonade Stand Foundation, and The Matthew Bittker Foundation.
Data included in the INRG database were provided by Children’s Oncology Group [COG], Pediatric Oncology Group [POG], Children’s Cancer Study Group [CCSG], German Gesellschaft für Pädiatrische Onkologie und Hämatologie [GPOH], European Neuroblastoma Study Group [ENSG], International Society of Paediatric Oncology Europe Neuroblastoma Group [SIOPEN], Japanese Neuroblastoma Study Group [JNBSG], Japanese Infantile Neuroblastoma Co-operative Study Group [JINCS], Spanish Neuroblastoma Group and the Italian Neuroblastoma Group.
Footnotes
Conflict of Interest/Financial Disclosures: Mark A. Applebaum: consultancy fees from Illumina Radiopharmaceuticals. Arlene Naranjo: serves on a DSMC for Novartis. Sam L. Volchenboum: Founder of Litmus Health, Inc. Tara O. Henderson: research funding from Seattle Genetics. Susan L. Cohn: stock ownership in Pfizer, Merck, and Lilly; served on advisory boards for Y-mAbs Therapeutics and US World Meds. Ami V. Desai: stock ownership in Pfizer and Viatris; consultancy/advisory board fees from Ology Medical Education, YMabs Therapeutics, Glaxo Smith-Kline; travel/accommodation expenses from YMabs Therapeutics. The remaining authors made no disclosures.
REFERENCES
- 1.Pinto NR, Applebaum MA, Volchenboum SL, et al. Advances in Risk Classification and Treatment Strategies for Neuroblastoma. Journal of clinical oncology : official journal of the American Society of Clinical Oncology 2015;33(27):3008–3017. [DOI] [PMC free article] [PubMed] [Google Scholar]
- 2.Liang WH, Federico SM, London WB, et al. Tailoring Therapy for Children With Neuroblastoma on the Basis of Risk Group Classification: Past, Present, and Future. JCO Clin Cancer Inform 2020;4:895–905. [DOI] [PMC free article] [PubMed] [Google Scholar]
- 3.Matthay KK, Villablanca JG, Seeger RC, et al. Treatment of high-risk neuroblastoma with intensive chemotherapy, radiotherapy, autologous bone marrow transplantation, and 13-cis-retinoic acid. Children’s Cancer Group. The New England journal of medicine 1999;341(16):1165–1173. [DOI] [PubMed] [Google Scholar]
- 4.Matthay KK, Reynolds CP, Seeger RC, et al. Long-term results for children with high-risk neuroblastoma treated on a randomized trial of myeloablative therapy followed by 13-cis-retinoic acid: a children’s oncology group study. Journal of clinical oncology : official journal of the American Society of Clinical Oncology 2009;27(7):1007–1013. [DOI] [PMC free article] [PubMed] [Google Scholar]
- 5.Park JR, Kreissman SG, London WB, et al. Effect of Tandem Autologous Stem Cell Transplant vs Single Transplant on Event-Free Survival in Patients With High-Risk Neuroblastoma: A Randomized Clinical Trial. JAMA 2019;322(8):746–755. [DOI] [PMC free article] [PubMed] [Google Scholar]
- 6.Yu AL, Gilman AL, Ozkaynak MF, et al. Anti-GD2 antibody with GM-CSF, interleukin-2, and isotretinoin for neuroblastoma. The New England journal of medicine 2010;363(14):1324–1334. [DOI] [PMC free article] [PubMed] [Google Scholar]
- 7.Yu AL, Gilman AL, Ozkaynak MF, et al. Long-Term Follow-up of a Phase III Study of ch14.18 (Dinutuximab) + Cytokine Immunotherapy in Children with High-Risk Neuroblastoma: COG Study ANBL0032. Clin Cancer Res 2021;27(8):2179–2189. [DOI] [PMC free article] [PubMed] [Google Scholar]
- 8.Desai AV, Gilman AL, Ozkaynak MF, et al. Outcomes Following GD2-Directed Postconsolidation Therapy for Neuroblastoma After Cessation of Random Assignment on ANBL0032: A Report From the Children’s Oncology Group. Journal of clinical oncology : official journal of the American Society of Clinical Oncology 2022;40(35):4107–4118. [DOI] [PMC free article] [PubMed] [Google Scholar]
- 9.Ladenstein R, Potschger U, Pearson ADJ, et al. Busulfan and melphalan versus carboplatin, etoposide, and melphalan as high-dose chemotherapy for high-risk neuroblastoma (HR-NBL1/SIOPEN): an international, randomised, multi-arm, open-label, phase 3 trial. Lancet Oncol 2017;18(4):500–514. [DOI] [PubMed] [Google Scholar]
- 10.Ladenstein R, Potschger U, Valteau-Couanet D, et al. Interleukin 2 with anti-GD2 antibody ch14.18/CHO (dinutuximab beta) in patients with high-risk neuroblastoma (HR-NBL1/SIOPEN): a multicentre, randomised, phase 3 trial. Lancet Oncol 2018;19(12):1617–1629. [DOI] [PubMed] [Google Scholar]
- 11.Baker DL, Schmidt ML, Cohn SL, et al. Outcome after reduced chemotherapy for intermediate-risk neuroblastoma. The New England journal of medicine 2010;363(14):1313–1323. [DOI] [PMC free article] [PubMed] [Google Scholar]
- 12.Twist CJ, Schmidt ML, Naranjo A, et al. Maintaining Outstanding Outcomes Using Response- and Biology-Based Therapy for Intermediate-Risk Neuroblastoma: A Report From the Children’s Oncology Group Study ANBL0531. Journal of clinical oncology : official journal of the American Society of Clinical Oncology 2019;37(34):3243–3255. [DOI] [PMC free article] [PubMed] [Google Scholar]
- 13.De Bernardi B, Mosseri V, Rubie H, et al. Treatment of localised resectable neuroblastoma. Results of the LNESG1 study by the SIOP Europe Neuroblastoma Group. British Journal of Cancer 2008;99(7):1027–1033. [DOI] [PMC free article] [PubMed] [Google Scholar]
- 14.Strother DR, London WB, Schmidt ML, et al. Outcome after surgery alone or with restricted use of chemotherapy for patients with low-risk neuroblastoma: results of Children’s Oncology Group study P9641. Journal of clinical oncology : official journal of the American Society of Clinical Oncology 2012;30(15):1842–1848. [DOI] [PMC free article] [PubMed] [Google Scholar]
- 15.Friedman DN, Goodman PJ, Leisenring WM, et al. Long-Term Morbidity and Mortality Among Survivors of Neuroblastoma Diagnosed During Infancy: A Report From the Childhood Cancer Survivor Study. Journal of clinical oncology : official journal of the American Society of Clinical Oncology 2023;41(8):1565–1576. [DOI] [PMC free article] [PubMed] [Google Scholar]
- 16.Henderson TO, Bhatia S, Pinto N, et al. Racial and ethnic disparities in risk and survival in children with neuroblastoma: a Children’s Oncology Group study. Journal of clinical oncology : official journal of the American Society of Clinical Oncology 2011;29(1):76–82. [DOI] [PMC free article] [PubMed] [Google Scholar]
- 17.Volchenboum SL, Cox SM, Heath A, Resnick A, Cohn SL, Grossman R. Data Commons to Support Pediatric Cancer Research. Am Soc Clin Oncol Educ Book 2017;37:746–752. [DOI] [PubMed] [Google Scholar]
- 18.Brodeur GM, Pritchard J, Berthold F, et al. Revisions of the international criteria for neuroblastoma diagnosis, staging, and response to treatment. Journal of clinical oncology : official journal of the American Society of Clinical Oncology 1993;11(8):1466–1477. [DOI] [PubMed] [Google Scholar]
- 19.Shapiro DN, Valentine MB, Rowe ST, et al. Detection of N- myc gene amplification by fluorescence in situ hybridization. Diagnostic utility for neuroblastoma. American Journal of Pathology 1993;142:1339–1346. [PMC free article] [PubMed] [Google Scholar]
- 20.Look AT, Hayes FA, Nitschke R, McWilliams NB, Green AA. Cellular DNA content as a predictor of response to chemotherapy in infants with unresectable neuroblastoma. The New England journal of medicine 1984;311:231–235. [DOI] [PubMed] [Google Scholar]
- 21.Shimada H, Ambros IM, Dehner LP, et al. The International Neuroblastoma Pathology Classification (the Shimada system). Cancer 1999;86(2):364–372. [PubMed] [Google Scholar]
- 22.Applebaum MA, Henderson TO, Lee SM, Pinto N, Volchenboum SL, Cohn SL. Second malignancies in patients with neuroblastoma: the effects of risk-based therapy. Pediatric blood & cancer 2015;62(1):128–133. [DOI] [PMC free article] [PubMed] [Google Scholar]
- 23.Balyasny S, Lee SM, Desai AV, et al. Association Between Participation in Clinical Trials and Overall Survival Among Children With Intermediate- or High-risk Neuroblastoma. JAMA Netw Open 2021;4(7):e2116248. [DOI] [PMC free article] [PubMed] [Google Scholar]
- 24.Ozkaynak MF, Gilman AL, London WB, et al. A Comprehensive Safety Trial of Chimeric Antibody 14.18 With GM-CSF, IL-2, and Isotretinoin in High-Risk Neuroblastoma Patients Following Myeloablative Therapy: Children’s Oncology Group Study ANBL0931. Frontiers in Immunology 2018;9. [DOI] [PMC free article] [PubMed] [Google Scholar]
- 25.Peto R, Peto J. Asymptotically Efficient Rank Invariant Test Procedures. J R Stat Soc Ser a-G 1972;135(2):185–207. [Google Scholar]
- 26.Cox DR. Regression Models and Life-Tables. J R Stat Soc B 1972;34(2):187–220. [Google Scholar]
- 27.Schoenfeld D Partial residuals for the proportional hazards regression model. Biometrika 1982;69(1):239–241. [Google Scholar]
- 28.Twist CJ, Schmidt ML, Naranjo A, et al. Maintaining Outstanding Outcomes Using Response- and Biology-Based Therapy for Intermediate-Risk Neuroblastoma: A Report From the Children’s Oncology Group Study ANBL0531. J Clin Oncol 2019;37:3243–3255. [DOI] [PMC free article] [PubMed] [Google Scholar]
- 29.Gamazon ER, Pinto N, Konkashbaev A, et al. Trans-population analysis of genetic mechanisms of ethnic disparities in neuroblastoma survival. J Natl Cancer Inst 2013;105(4):302–309. [DOI] [PMC free article] [PubMed] [Google Scholar]
- 30.Nguyen le B, Diskin SJ, Capasso M, et al. Phenotype restricted genome-wide association study using a gene-centric approach identifies three low-risk neuroblastoma susceptibility Loci. PLoS Genet 2011;7(3):e1002026. [DOI] [PMC free article] [PubMed] [Google Scholar]
- 31.McDaniel LD, Conkrite KL, Chang X, et al. Common variants upstream of MLF1 at 3q25 and within CPZ at 4p16 associated with neuroblastoma. PLoS Genet 2017;13(5):e1006787. [DOI] [PMC free article] [PubMed] [Google Scholar]
- 32.Diskin SJ, Capasso M, Schnepp RW, et al. Common variation at 6q16 within HACE1 and LIN28B influences susceptibility to neuroblastoma. Nat Genet 2012;44(10):1126–1130. [DOI] [PMC free article] [PubMed] [Google Scholar]
- 33.Li Y, Pang X, Cui Z, et al. Genetic factors associated with cancer racial disparity - an integrative study across twenty-one cancer types. Mol Oncol 2020;14(11):2775–2786. [DOI] [PMC free article] [PubMed] [Google Scholar]
- 34.Martini R, Delpe P, Chu TR, et al. African Ancestry-Associated Gene Expression Profiles in Triple-Negative Breast Cancer Underlie Altered Tumor Biology and Clinical Outcome in Women of African Descent. Cancer Discov 2022;12(11):2530–2551. [DOI] [PMC free article] [PubMed] [Google Scholar]
- 35.Bona K, Li Y, Winestone LE, et al. Poverty and Targeted Immunotherapy: Survival in Children’s Oncology Group Clinical Trials for High-Risk Neuroblastoma. J Natl Cancer Inst 2021;113(3):282–291. [DOI] [PMC free article] [PubMed] [Google Scholar]
- 36.Zheng DJ, Li A, Ma C, et al. Socioeconomic disparities in survival after high-risk neuroblastoma treatment with modern therapy. Pediatric blood & cancer 2021;68(10):e29127. [DOI] [PMC free article] [PubMed] [Google Scholar]
- 37.Kehm RD, Spector LG, Poynter JN, Vock DM, Altekruse SF, Osypuk TL. Does socioeconomic status account for racial and ethnic disparities in childhood cancer survival? Cancer 2018;124(20):4090–4097. [DOI] [PMC free article] [PubMed] [Google Scholar]
Associated Data
This section collects any data citations, data availability statements, or supplementary materials included in this article.