



Summary
Thrombocytopenia is the hallmark finding in dengue virus (DENV) infection. Prothymosin α (ProT) has both intracellular and extracellular functions involved in cell cycle progression, cell differentiation, gene regulation, oxidative stress response, and immunomodulation. In this study, we found that ProT levels were elevated in dengue patient sera as well as DENV-infected megakaryoblasts and their culture supernatants. ProT transgenic mice had reduced platelet counts with prolonged bleeding times. Upon treatment with DENV plus anti-CD41 antibody, they exhibited severe skin hemorrhage. Furthermore, overexpression of ProT suppressed megakaryocyte differentiation. Infection with DENV inhibited miR-126 expression, upregulated DNA (cytosine-5)-methyltransferase 1 (DNMT1), downregulated GATA-1, and increased ProT expression. Upregulation of ProT led to Nrf2 activation and reduced reactive oxygen species production, thereby suppressing megakaryopoiesis. We report the pathophysiological role of ProT in DENV infection and propose an involvement of the miR-126-DNMT1-GATA-1-ProT-Nrf2 signaling axis in DENV-induced thrombocytopenia.
Subject areas: Virology, Cell biology
Graphical abstract
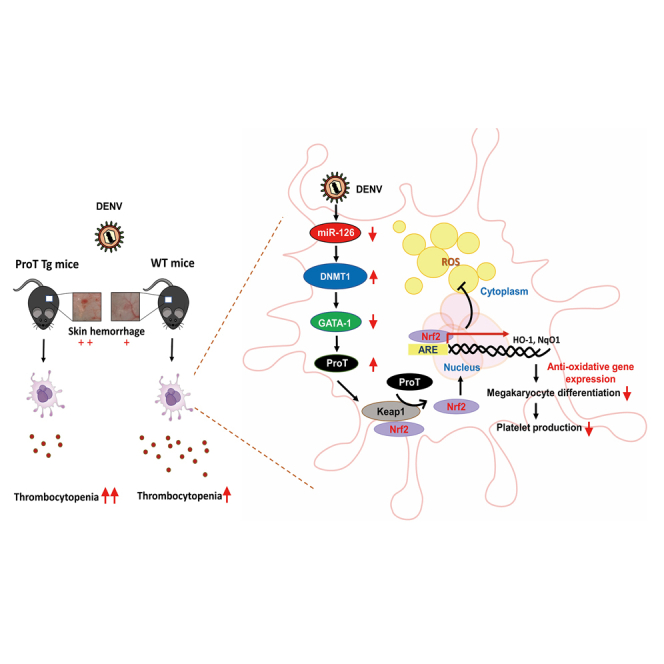
Highlights
-
•
ProT levels are elevated in dengue patients and DENV-infected megakaryoblasts
-
•
ProT Tg mice exhibit reduced PLT counts with prolonged bleeding times
-
•
Excess ProT suppresses megakaryopoiesis
-
•
MiR-126-DNMT1-GATA-1-ProT-Nrf2 axis may contribute to DENV-induced thrombocytopenia
Virology; Cell biology
Introduction
Dengue is an important arthropod-borne viral disease. The illness caused by dengue virus (DENV) includes asymptomatic infection, acute febrile illness, classic dengue fever, and dengue hemorrhagic fever including dengue shock syndrome. Among these manifestations, thrombocytopenia is the hallmark for both mild and severe forms of dengue.1 Impaired thrombopoiesis and peripheral platelet (PLT) destruction are two main mechanisms that contribute to the development of dengue-induced thrombocytopenia.2,3,4 An early study reported that the bone marrow is hypocellular during early dengue disease but later becomes hypercellular when recovered from acute suppression.5 There is also evidence that the bone marrow reduces its ability to support hematopoiesis in dengue infection.6 Direct DENV infection in the bone marrow was detected in nonhuman primate and humanized mouse models of dengue infection.7,8 CD61-expressing multiploidy cells in the bone marrow from humans and rhesus monkeys were shown to be dominantly infected by DENV.9,10 These findings provide evidence that transient reduction of PLT numbers during DENV infection is attributable to direct infection of megakaryocytes with DENV in the bone marrow, thereby interfering with PLT production.
Prothymosin α (ProT) is a highly acidic nuclear protein consisting of 109–110 amino acids and plays a pivotal role in cell cycle progression and proliferation.11,12 Overexpression of ProT can accelerate cell proliferation, shorten duration of the G1 phase of the cell cycle, and suppress differentiation of human promyelocytic leukemia HL-60 cells.13,14 In contrast, suppression of ProT by antisense RNA results in growth arrest and apoptosis.15 Regarding oxidative stress, ProT can bind to Keap1 and release Nrf2 from the Nrf2-Keap1 complex.16 Nrf2 then translocates into the nucleus, binds to the antioxidant response element, and upregulates the expression of antioxidant genes.16 Reactive oxygen species (ROS) is required for all stages of megakaryopoiesis, which involves multipotent stem/progenitor cell commitment, nuclear polyploidization, cytoplasmic maturation, and release of PLTs.17 Studies from knockout mice have revealed that Nrf2 activation skews the differentiation potential of hematopoietic stem cells toward the granulocyte-monocyte lineage, thereby reducing megakaryocyte and erythroid progenitors.18 ProT exerts differential effects on cell cycle progression, differentiation, and oxidative stress. However, its potential pathological role in DENV-induced thrombocytopenia remains unexplored.
Host microRNAs (miRNAs) have emerged as important regulators in dengue pathogenesis.19 Differentially expressed miRNAs are detected in the sera of dengue patients and in DENV-infected mice, some of which may be used as indicators for dengue severity.20,21,22 Moreover, a broader role for DENV infection in miRNA modulation has been documented. Infection of human hepatoma cells with DENV results in decreased mRNA levels of miRNA processing proteins, including Dicer, Drosha, Ago1, and Ago2, and subsequent downregulation of miRNAs.23 The DENV nonstructural protein 3 (NS3) interferes with loading of miRNAs to Ago proteins through directly binding to human heat shock cognate protein 70 (hHSC70), which subsequently hampers miRNA biogenesis and results in reduced precursor and mature levels of miR-126.24 The genetic association of a single-nucleotide polymorphism within miR-126 with parameters of PLT function has been detected in mice.25 Furthermore, antagomiRs against miR-126-3p blocks PLT aggregation.25 Collectively, these results suggest an essential role for miR-126 in maintaining PLT function and imply an association between miR-126 and PLT production. However, the impact of miR-126 on dengue-induced pathogenesis remains unclear.
In the present study, we hypothesized that DENV infection would induce upregulation of ProT, resulting in suppression of megakaryopoiesis, and this process is mediated, at least in part, through the miR-126-DNMT1-GATA-1-ProT-Nrf2 signaling axis. Our findings provide important insights into the function and underlying mechanism of ProT in dengue-associated thrombocytopenia.
Results
Serum ProT levels are elevated in dengue patients and DENV-infected Meg-01 megakaryoblasts
We used the enzyme-linked immunosorbent assay (ELISA) to quantify ProT levels in the sera of 101 dengue patients and 27 healthy controls. While a normal PLT count in adults ranges from 150,000 to 400,000 PLT/mm3 of blood, a PLT count below 100,000/mm3 is a common clinical feature of dengue. Therefore, we categorized these patients into three groups based on their PLT counts, including >150,000, 100,000–150,000, and <100,000/mm3 of blood. As shown in Figure 1A, patients with PLT counts <100,000/mm3 had the highest ProT levels among the four groups, followed by patients with PLT counts 100,000–150,000/mm3. However, ProT levels did not differ between patients with PLT counts >150,000/mm3, which were in the normal range, and healthy individuals. Based on a best-fit linear trend line, there was a negative correlation between serum ProT levels and PLT counts (Figure 1B). Since patients enrolled in this study were admitted to the emergency department of Kaohsiung Medical University Hospital with fever during dengue outbreaks in 2014–2015, most of these patients were in the acute febrile phase.26 Thus, it was not possible to further investigate the correlation of serum ProT levels and clinical disease severity. Taken together, our results from blood samples of dengue patients show a strong negative correlation between serum ProT levels and PLT counts in patients with acute febrile illness. Our findings also suggest that excess ProT may be involved in dengue pathogenesis.
Figure 1.

Serum ProT levels are increased in dengue patients and DENV-infected Meg-01 cells and their culture supernatants
(A) ProT levels in the sera of dengue patients grouped according to their PLT counts, including >150,000/mm3 (n = 35), 100,000–150,000/mm3 (n = 30), and <100,000/mm3 (n = 36), as well as healthy controls (n = 27) quantified by ELISA. Values are means ± SD (one-way ANOVA).
(B) Pearson correlation analysis for the correlation of ProT levels and PLT counts showing the best-fit linear trend line.
(C–F) Determination of DENV RNA (C), ProT mRNA (D), as well as protein levels of ProT and NS3 (E) in Meg-01 cells infected with DENV-2 at an MOI of 1 for different time points by RT-qPCR (C, D) and immunoblotting (E). The ratio of mock infected cells was arbitrarily set to 100 (D). Expression of GAPDH served as the loading control (E). Values shown below the blots are ratios between the intensity of the bands corresponding to ProT or NS3 and those corresponding to GAPDH analyzed by densitometry, where the ratio of mock infected cells was set to 1. The ProT content in the supernatant of DENV-infected Meg-01 cells was also quantified by ELISA (F). Values are means ± SD (n = 3, one-way ANOVA).
Due to the heterogeneity of human megakaryocytes,27 we used the human Meg-01 cell line representing a model for PLT precursor cells, rather than primary megakaryocytes, to examine whether infection with DENV type 2 (PL046 strain) upregulated ProT expression. Viral RNA levels peaked at day 3 post-infection (pi) (Figure 1C). Furthermore, the ProT transcript significantly increased more than 2-fold at day 1 pi and remained at similar levels throughout the 4-day testing period (Figure 1D). Immunoblot analysis also revealed that levels of viral NS3 indicative of viral replication increased in a time-dependent manner after DENV infection (Figure 1E). Notably, ProT protein levels increased at day 1 pi, peaked at day 3 pi, and remained elevated at day 4 pi (Figure 1E). We also quantified the ProT content in the culture supernatant of DENV-infected Meg-01 cells by ELISA. While ProT was undetectable in the culture supernatant of uninfected cells, it was released into the supernatant by DENV-infected cells, with levels being increased with time but reaching a plateau at day 3 pi (Figure 1F). Collectively, our results from Meg-01 cells indicate that infection with DENV induces ProT expression, which can be detected intracellularly and extracellularly.
ProT accelerates DENV-induced thrombocytopenia in mice
Next, we compared serum ProT levels, PLT counts, and bleeding times between ProT transgenic (Tg) and wild-type (WT) mice. We verified that ProT Tg mice showed a 3.2-fold increased levels of ProT compared with WT mice (Figure 2A). Compared to healthy human adults, normal mice exhibit much higher PLT counts with smaller size and much shorter lifespan.28 The normal PLT count in mice ranges from 1,000 × 103 to 1,500 × 103/mm3 in blood. Murine PLTs are at least approximately four to five times more numerous than human PLTs. We found that PLT counts were 26% lower in ProT Tg mice compared to those in WT mice (Figure 2B). Furthermore, bleeding times for WT were in the range of 4- to 7-min (5.70 ± 1.50 min), whereas ProT Tg mice had bleeding times in excess of 7 min (7.75 ± 0.67 min) (Figure 2C). We then explored whether ProT was involved in hemorrhage induced by DENV plus anti-CD41 (PLT marker) antibody that mimics autoantibodies elicited by viral nonstructural protein 1 (NS1) in C57BL/6 mice.29 Bone marrow cells from mice treated with DENV-2 and/or anti-CD41 antibody contained significantly higher levels of ProT compared with those from saline-treated mice (Figure 2D). Accordingly, C57BL/6 mice treated with DENV alone or combined with anti-CD41 antibody had an approximately 2-fold increase in serum ProT contents compared with those treated with saline (Figure 2E). While DENV- and saline-treated mice had similar PLT counts, treatment with anti-CD41 antibody alone or in combination with DENV significantly reduced the PLT counts in mice (Figure 2F). Based on a best-fit linear regression analysis, there was a trend of negative correlation between the PLT count and ProT level (p = 0.056) in mice following treatment with DENV and/or anti-CD41 antibody (Figure 2G). Regarding skin hemorrhage, C57BL/6 mice receiving combination treatment with DENV and anti-CD41 antibody exhibited mild hemorrhage (Figure S1). Nevertheless, single treatment with either DENV or anti-CD41 antibody failed to induce skin hemorrhage (Figure S1). Next, we compared basal PLT counts of ProT Tg and WT mice. As shown in Figure 2H, the basal level of PLT counts appeared to be lower in ProT Tg mice than in WT mice, which was in accordance with the data shown in Figure 2B. Furthermore, combination treatment with DENV and anti-CD41 antibody significantly decreased PLT counts in both mice, in particular ProT Tg mice. Notably, 60% of ProT Tg mice exhibited skin hemorrhage, whereas no hemorrhage was observed in WT mice (Figure 2I). Accordingly, the clinical skin hemorrhage score was significantly higher in ProT Tg mice than in WT mice (Figure 2J). Taken together, these results indicate that DENV infection increases serum ProT levels, and treatment with anti-CD41 antibody that resembles anti-NS1 antibody reduces PLT counts in WT mice. Furthermore, ProT Tg mice have lower PLT counts and are more prone to developing skin hemorrhage upon treatment with DENV and anti-CD41 antibody. These findings also suggest that overexpression of ProT may impair PLT production and accelerate skin hemorrhage during DENV infection.
Figure 2.

Overexpression of ProT causes reduction in PLT counts and accelerates DENV-induced thrombocytopenia in mice
(A–C) Serum ProT levels (A), PLT counts (B), and tail bleeding times (C) of 8-week-old ProT Tg and WT C57BL/6 mice.
(D and E) WT mice were subcutaneously injected with or without DENV-2 (107 PFU), followed 24 h later by treatment with or without anti-PLT CD41 antibody (1 mg/kg). ProT was detected in bone marrow cells (D) and sera (E) of the mice at day 4 pi by immunoblotting and ELISA, respectively. Representative immunoblot images of ProT with each lane representing a sample from an individual mouse (D, left) and quantification of relative ProT levels normalized to β-actin (D, right. saline, n = 6; DENV-2, n = 3; anti-CD41, n = 3; DENV-2 + anti-CD41, n = 6). Values shown below the blots are ratios between the intensity of the bands corresponding to ProT and those corresponding to β-actin analyzed by densitometry.
(F and G) PLT counts of WT mice treated with either saline, DENV-2, anti-CD41, or DENV-2 + anti-CD41 at day 2 pi (F). Pearson correlation analysis for the correlation of ProT levels and PLT counts showing the best-fit linear trend line (G).
(H–J) PLT counts of ProT Tg and WT mice treated with either saline or DENV-2 + anti-CD41 at day 2 pi (H), as well as images (I) and scores (J) of skin hemorrhage at day 3 pi. Values are means ± SD (one-way ANOVA or Student’s t test).
Excess ProT suppresses megakaryocyte differentiation
Next, we studied whether overexpression of ProT impacted megakaryocyte differentiation by detecting CD41-positive (PLT derived) microparticles. Since megakaryocyte differentiation correlates with increased DNA contents, we also examined the distribution of relative DNA content in megakaryocytes of ProT Tg and WT mice. By analyzing CD41-positive and polyploid cells in bone marrow cells that had been treated with thrombopoietin (TPO) and interleukin-3 (IL-3) for 6 days to induce megakaryocyte differentiation, we found that the percentages of CD41-positive megakaryocytes in the bone marrow of ProT Tg mice were lower (24.6%) than those of WT cells (29.6%) (Figure 3A, upper panels; cells gated with forward scatter component (FSC) >400 and CD41 > 101∼102). Furthermore, the percentages of polyploid cells in CD41-positive cells of ProT Tg mice were also reduced compared with those of WT mice (Figure 3A, lower panels; > 4N, 39.3% in ProT Tg mice vs. 42.9% in WT mice). These results suggest that overexpression of ProT hampers the endomitosis process of megakaryocytes from the bone marrow. In addition, we further used DENV-infected bone marrow-derived megakaryocytes from ProT Tg and WT mice to analyze CD41-positive cells and polyploid cells in this population. The percentages of CD41-positive cells in the bone marrow of ProT Tg mice (10.2%) were much lower than those of WT mice (34.2%) (Figure 3B, upper panels; cells gated with FSC >400 and CD41 > 101∼102). Similarly, the percentages of polyploid cells in CD41-positive cells were lower in the bone marrow of ProT Tg mice (31.0%) compared with those of WT mice (39.2%) following DENV infection (Figure 3B, lower panels; Q2 region, > 4N). To further validate that excess ProT impaired megakaryocyte differentiation, we silenced ProT expression in Meg-01 cells via lentivirus (LV)-mediated delivery of short hairpin RNA (shRNA) specific to ProT, resulting in the silencing of ProT expression by 75%–80% (Figure 3C). After treatment with phorbol 12-myristate 13-acetate (PMA) for 7 days, the percentages of CD41-positive cells were higher in ProT knockdown cells (55.2% for shProT-17; 55.1% for shProT-20) than in the control cells transduced with LV.shLacZ (50.6%) (Figure 3D, upper panels; cells gated with FSC >400 and CD41 > 101∼102). Moreover, ProT knockdown Meg-01 cells had a higher percentage of polyploid cells (34.8% in shProT-17; 35.6% in shProT-20) compared with LV.shLacZ-transduced cells (26.2%) (Figure 3D, lower panels; Q2 region, > 4N). Collectively, we conclude that excess ProT expression suppresses megakaryocyte differentiation.
Figure 3.

Overexpression of ProT suppresses megakaryocyte differentiation
(A and B) Percentages (upper panels) and DNA contents (lower panels) of CD41-positive megakaryocytes from ProT Tg and WT mice. Bone marrow cells collected from the mice were treated with mouse TPO (50 ng/mL) and mouse IL-3 (10 ng/mL) for 6 days alone (A) or in combination with DENV-2 (MOI = 1) infection from day 3 onwards (B). They were then stained with CD41 and propidium iodide and analyzed by flow cytometry.
(C and D) Meg-01 cells were transduced with shRNAs specific to ProT (shProT-17 and shProT-20) or the control shLacZ for knockdown of ProT, treated with PMA (10−6 M) for inducing differentiation, stained with CD41 and propidium iodide, and analyzed by flow cytometry. Validation of ProT levels by RT-qPCR (C) and percentages (upper panels) and DNA contents (lower panels) of CD41-positive cells (D) in ProT knockdown and control cells.
(A–D) The Q2 region represents CD41-positive cells (FSC >400 and CD41 > 101–102). Quantitative data were analyzed using bar charts (right panels). Values are mean ± SD (n = 3, Student’s t test or one-way ANOVA).
We further determined the numbers of total cells, T lymphocytes (CD3+ cells), B lymphocytes (CD19+ cells), mononuclear cells (CD11b+ cells), and megakaryocytes (CD41+CD61+ cells) obtained from the bone marrow of ProT Tg and WT mice under normal conditions or treatment with DENV plus anti-CD41 antibody. As shown in Table S1, total cell numbers were similar between ProT Tg and WT mice regardless of DENV and/or anti-CD41 antibody treatment. While the percentages of CD41+CD61+ cells had no differences between ProT Tg and WT mice under the vehicle treatment, they were significantly lower in DENV/anti-CD-41-treated ProT Tg mice compared to their WT counterparts. Furthermore, the percentages of T cells and B cells were significantly higher and lower, respectively, in ProT Tg mice than in WT mice under the vehicle treatment or DENV/anti-CD41 treatment. However, the percentages of myeloid-lineage cells (CD11b+ cells) were significantly higher in ProT Tg mice than in WT mice under the vehicle treatment, which did not occur after treatment with DENV/anti-CD41 antibody. Thus, these data indicate that excess ProT expression reduces the percentage of CD41+CD61+ megakaryocytes in mice upon DENV infection. Furthermore, the percentages of T and B cells also change after DENV infection. However, the impact of these changes remains unknown.
DENV infection affects the expression of miR-126, DNMT1, GATA-1, and ProT in Meg-01 cells
As miR-126 is implicated in the maintenance of normal PLT function and DENV NS3 interferes with precursor miR-126 expression and decreases mature miR-126 levels,24 we further assessed the effect of miR-126 on megakaryoblasts during DENV infection. Meg-01 cells infected with DENV expressed reduced levels of miR-126-3p (Figure 4A) and miR-126-5p (Figure S2). It was proposed that the DNMT1-miR-126 epigenetic circuit controls the growth of esophageal squamous cell carcinoma.30 Furthermore, DNMT1 directly binds to the Gata-1 locus in murine hematopoietic stem cells, resulting in hypermethylation and downregulation of GATA-1, a transcription factor associated with megakaryopoiesis.31 DENV infection was shown to reduce GATA-1 expression in megakaryocytes.32 Our results further show that infection with DENV increased DNMT1 and decreased GATA-1 expression in Meg-01 cells (Figure 4B). Immunohistochemical staining revealed more DNMT1-positive cells in bone marrow cells of mice treated with DENV plus anti-CD41 antibody compared to those treated with saline (Figure 4C). Our results collectively suggest that infection with DENV may influence the miR-126-DNMT1-GATA-1 pathway in megakaryoblasts.
Figure 4.

DENV infection reduces miR-126-3p, increases DNMT1, and reduces GATA-1 expression in Meg-01 cells
(A and B) Detection and quantification of miR-126-3p (A) as well as DNMT1, viral NS3, and GATA-1 proteins in Meg-01 cells infected with DENV-2 at an MOI of 1 at different time points by RT-qPCR (A) and immunoblotting (B). Values are means ± SD (n = 4, one-way ANOVA). The ratio of mock infected cells was arbitrarily set to 100 (A). Expression of GAPDH served as the loading control (B). Values shown below the blots are ratios between the intensity of the bands corresponding to DNMT1 or GATA-1 and those corresponding to GAPDH analyzed by densitometry, where the ratio of mock infected cells was set to 1.
(C) Immunohistochemical detection (original magnification ×200; scale bar = 100 μm) (left) and quantitation of DNMT1-positive cells (right) in the bone marrow of WT mice treated with either saline or DENV-2 + anti-CD41 at day 4 pi. Values shown are mean ± SD (n = 3, Student’s t test).
(D–G) Detection and quantification of miR-126-3p (D), DNMT1 (E), GATA-1 (F), and ProT (G) in Meg-01 cells transduced with LV.miR-126 or LV.miR-Ctrl by RT-qPCR. The ratio of LV.miR-Ctrl-transduced control cells was arbitrarily set to 100. Values shown are mean ± SD (n = 4, Student’s t test).
To further validate miR-126 as an upstream regulator of the proposed DNMT1-GATA-1-ProT signaling axis, we generated miR-126-overexpressing Meg-01 cells and vector control cells and compared their gene expression levels of DNMT1, GATA-1, and ProT. Quantitative reverse-transcription PCR (RT-qPCR) confirmed miR-126 overexpression in Meg-01 cells transduced with LV.miRNA-126 compared with those transduced with the control LV.miR-Ctrl vector (Figure 4D). Overexpression of miR-126 resulted in downregulation of DNMT1 (Figure 4E), upregulation of GATA-1 (Figure 4F), and downregulation of ProT (Figure 4G) in Meg-01 cells.
Next, we confirmed that expression of GATA-1 was negatively regulated by DNMT1. We treated DENV-infected Meg-01 cells with 5′-AZA-2′-deoxycytidine, a DNMT1 inhibitor, and examined whether DENV-induced downregulation of GATA-1 could be abrogated. Figure 5A shows that expression of GATA-1 was greatly decreased in DENV-infected Meg-01 cells, which could be reversed by pharmacological inhibition of DNMT1, confirming that DNMT1 negatively regulates GATA-1 expression. We further performed a chromatin immunoprecipitation (ChIP) assay to examine whether DNMT1 bound to the GATA-1 locus in Meg-01 cells infected with DENV, thereby leading to repressing GATA-1 expression. Our result shows that DENV infection increased the binding of DNMT1 to the GATA-1 promoter, which would lead to hypermethylation and thus downregulation of GATA-1 expression (Figure 5B).
Figure 5.

DNMT1 negatively regulates GATA-1 expression, and GATA-1 also negatively regulates ProT expression
(A) Detection (left) and quantification (right) of GATA-1 and viral NS3 in DENV-infected Meg-01 cells treated with 1, 2, or 5 μM of the DNMT1 inhibitor 5-AZA-2′-deoxycytidine (5′-Aza-dc) for 72 h. Expression of β-actin served as the loading control. The immunoblot is from one representative experiment of three (left). Values shown are ratios between the intensity of the bands corresponding to GATA-1 and those corresponding to β-actin analyzed by densitometry, where the ratio of mock infected cells was set to 1 (right). Values shown are mean ± SD (n = 3, one-way ANOVA).
(B) ChIP assay showing a 2.5-fold increase in the binding of DNMT1 to the GATA-1 promoter region in Meg-01 cells after infection with DENV-2 at an MOI of 1 for 3 days. Cross-linked chromatin was immunoprecipitated with anti-DNMT-1 or anti-IgG antibody combined with protein G agarose beads, followed by PCR amplification of the GATA-1 promoter. The ratio shown below the images is normalized to the amount of the input.
(C) The PTMA promoter activity assessed in 293T cells 48 h after cotransfection with 1 μg of pGL3-pProT-Luc and various doses of pSin4-EF1a-GATA-1-IRES-Puro (upper panel). The total amount of plasmid DNA for transfection was kept constant by the addition of a control plasmid. Validation of GATA-1 expression in a dose-dependent manner by immunoblotting (lower panel). Expression of β-actin served as the loading control. Values shown are means ± SD (n = 3, one-way ANOVA).
(D) Expression of ProT (upper panel) and validation of knockdown of GATA-1 expression (lower panel) in GATA-1 knockdown Meg-01 and control cells. Meg-01 cells were transduced with lentiviral vectors encoding shRNAs specific to GATA-1 (shGATA-1-358 and shGATA-1-359) or LacZ (control). Expression of β-actin or GAPDH served as the loading control. Values shown below the blots are ratios between the intensity of the bands corresponding to ProT or GATA-1 and those corresponding to β-actin or GAPDH analyzed by densitometry, where the ratio of mock infected cells was set to 1.
Given that DENV infection reduced GATA-1 expression (Figures 4B and 5A), we analyzed the microarray data obtained from NCBI Gene Expression Omnibus (GEO) database (accession number GSE2527, Dataset record GDS1245).33 We found that megakaryocytes of GATA-1 knockout mice increased the mRNA expression of the Ptma gene that encodes mouse ProT (Figure S3). Because the transcription factor GATA-1 regulates gene expression through binding to promoter regions with various positive and negative co-factors, we next investigated whether GATA-1 affects the promoter activity of the PTMA gene that encodes human ProT. Using 293T cells cotransfected with the GATA-1 expression vector pSIN4-EF1a-GATA-1-IRES-Puro and the luciferase reporter vector pGL3-pProT-Luc, we found that overexpression of GATA-1 in 293T cells downregulated the PTMA promoter activity in a dose-dependent manner (Figure 5C). Furthermore, we used LV-mediated delivery of shRNA specific to GATA-1 (shGATA-1-358 and -359) as well as a control shRNA (shLacZ) in Meg-01 cells to further validate GATA-1 as an upstream negative regulator of ProT. Two GATA-1 knockdown cells expressed higher levels of ProT compared with LV.shLacZ-transduced or mock-transduced cells (Figure 5D). Collectively, these results suggest that components of the miR-126-DNMT1-GATA-1-ProT signaling axis may be involved in DENV-induced thrombocytopenia.
ProT suppresses megakaryopoiesis through Nrf2 activation and increases expression of the genes encoding its downstream antioxidant enzymes in DENV-infected Meg-01 cells
Binding of ProT to Keap1 inhibits formation of the Keap1-Nrf2 complex, leading to Nrf2-mediated activation of antioxidative stress genes involved in scavenging ROS.16 Given that Nrf2 negatively regulates PLT production34 and ROS is required for megakaryopoiesis,17 we further studied whether ProT suppressed megakaryopoiesis through activation of Nrf2 in DENV infection in Meg-01 cells. Protein levels of Nrf2 were increased from day 2 onward after viral infection (Figure 6A). Viral NS3 was also detectable from day 2 pi. Notably, nuclear levels of Nrf2 in Meg-01 cells transfected with ProT expression plasmids (pLAS2w.hProT-HA or pLAS2w.hProT-Venus) were increased compared to those transfected with the control plasmid (pLAS2w.Ppuro) (Figure 6B). Overexpression of ProT increased expression of heme oxygenase-1 (HO-1) and NAD (P) H: quinone oxidoreductase 1 (NQO1), as well as reduced ROS production (Figure 6C). In contrast, knockdown of endogenous ProT had opposite effects (Figure 6D). We further tested whether overexpression of miR-126 reversed ProT-mediated upregulation of Nrf2, HO-1, and NQO1. Figure 6E shows that mRNA levels of Nrf2, HO-1, and NQO1 were decreased in Meg-01 cells transduced with LV. miRNA-126 as compared to those transduced with LV.miR-Ctrl. We also investigated whether ProT played a role in PLT release. ProT knockdown Meg-01 cells expressed higher levels of PLT glycoprotein IX (GP9) and tubulin β1 (TUBB1), which are related to PLT release,35 compared to the vector control cells (Figure 6F). Furthermore, ProT knockdown cells expressed higher levels of the surface molecule CD42b, a marker of PLT activation that is expressed at the late stage of megakaryocyte differentiation (Figure 6G). Taken together, these results suggest that DENV-mediated upregulation of ProT expression reduces megakaryocyte differentiation, leading to decreased PLT production, at least in part, through the ProT-Nrf2-ROS axis.
Figure 6.

Overexpression of ProT promotes Nrf2 nuclear translocation and decreases ROS production, leading to reduced PLT production
(A) Detection of Nrf2 and viral NS3 in Meg-01 cells infected with DENV-2 at an MOI of 1 at different time points by immunoblotting. Expression of GAPDH served as the loading control. Values shown at the bottom are ratios between the intensity of the bands corresponding to Nrf2 and those corresponding to GAPDH.
(B) Nuclear translocation of Nrf2 in ProT-overexpressing cells. Meg-01 cells were transfected with pLAS2w.hProT-HA (ProT-HA), pLAs2w.hProT-Venus (ProT-Venus), or pLAS2w.Ppuro (Vector). After 48 h, nuclear and cytosolic extracts were harvested for immunoblot analysis. Lamin A/C and α-tubulin served as the nuclear and cytoplasmic markers, respectively. Values shown at the bottom are ratios between the intensity of the bands corresponding to Nrf2 and those corresponding to α-tubulin or Lamin A/C.
(C and D) Quantification of HO-1 (left) and NQO1 (middle) by RT-qPCR and measurement of ROS production (right) in Meg-01 cells transduced with lentiviral vectors encoding ProT (LV.ProT) or no transgenes (LV.Null) (C) and shRNA specific to ProT (LV.shProT-17 and -20) or LacZ (LV.shLacZ) (D). ROS production in ProT overexpression (C) and knockdown (D) Meg-01 cells or control cells were measured by flow cytometry after stimulation with PMA (10−6 M) for 7 days and staining with DCFDA. Values shown are means ± SD (n = 3, Student’s t test or one-way ANOVA).
(E) Overexpression of miR-126 reduces Nrf2 levels and antioxidant gene expression. Detection and quantification of Nrf2, HO-1, and NQO1 in Meg-01 cells transduced with LV.miR-126 or LV.miR-Ctrl by RT-qPCR. Values shown are mean ± SD (n = 4, Student’s t test).
(F) Quantification of GP9 and TUBB1, which are involved in PLT release, in ProT knockdown (shProT-20) or control (shLacZ) Meg-01 cells by RT-qPCR. Values shown are means ± SD (n = 3, Student’s t test).
(G) Detection of the PLT activation marker CD42b in ProT knockdown (shProT-20) or control (shLacZ) Meg-01 cells by flow cytometry. Values shown are means ± SD (n = 3, Student’s t test or one-way ANOVA).
Overexpression of miR-126 reverses megakaryopoiesis suppression in bone marrow cells of ProT Tg mice
Given that infection with DENV downregulated miR-126 expression (Figure 4A) but upregulated ProT expression (Figures 1D–1F) and that overexpression of miR-126 decreased ProT expression (Figure 4G) in Meg-01 cells, we next assessed the correlation between miR-126 and ProT in megakaryopoiesis. We treated bone marrow cells derived from C57BL/6 mice with TPO and IL-3 to induce megakaryocyte differentiation. We found that expression of ProT was decreased in a time-dependent manner during megakaryocyte differentiation from the bone marrow (Figure 7A). Since the percentages of CD41-positive megakaryocytes and polyploidy cells derived from the bone marrow of ProT Tg mice were lower than those of WT cells (Figure 3A), we then determined whether overexpression of miR-126 could rescue ProT suppression of megakaryocyte differentiation. Bone marrow cells derived from ProT Tg mice transduced with LV.miR-126 displayed a 50-fold increase in miR-126-3p levels than those transduced with the control LV.miR-Ctrl vector (Figure 7B). Furthermore, the size and number of megakaryocytes in bone marrow cells transduced with LV.miR-126 were increased (Figure 7C). The percentages of CD41-positive megakaryocytes in LV.miR-126-transduced bone marrow cells were higher (33.7%) than those in LV.miR-Ctrl-transduced cells (21.0%) (Figure 7D, upper panels; cells gated with FSC >300 and CD41 > 101∼102). Higher percentages of polyploid cells were detected in LV.miR-126-transduced cells than in LV.miR-Ctrl-transduced cells (Figure 7D, lower panels; > 4N, 28.9% in LV.miR-126-transduced cells vs. 16.1% in LV.miR-Ctrl-transduced cells). Collectively, these results indicate that ProT-induced suppression of megakaryocyte differentiation can be reversed by miR-126 overexpression. They also suggest that suppressive effect of DENV on megakaryopoiesis may be improved by downregulation of ProT through miR-126 overexpression.
Figure 7.

Overexpression of miR-126 improves megakaryocyte differentiation in the bone marrow cells of ProT Tg mice
(A) Quantification of ProT mRNA levels in bone marrow cells treated with mouse TPO (50 ng/mL) and mouse IL-3 (10 ng/mL) to induce megakaryocyte differentiation from C57BL/6 mice at different time points by RT-qPCR. Values shown are mean ± SD (n = 4, one-way ANOVA).
(B) Detection and quantification of miR-126-3p in ProT-overexpressing bone marrow cells transduced with LV.miR-Ctrl or LV.miR-126 in the presence of mouse TPO (50 ng/mL) and mouse IL-3 (10 ng/mL) by RT-qPCR. The relative mRNA level of the control cells was set to 1. Values shown are mean ± SD (n = 3, Student’s t test).
(C) Morphology of megakaryocytes from ProT-overexpressing bone marrow cells transduced with LV.miR-Ctrl or LV.miR-126 in the presence of mouse TPO (50 ng/mL) and mouse IL-3 (10 ng/mL) (original magnification ×200, bar = 100 μm).
(D) Percentages (upper panels) and DNA contents (lower panels) of CD41-positive megakaryocytes from ProT-overexpressing bone marrow cells transduced with LV.miR-Ctrl or LV.miR-126 in the presence of mouse TPO (50 ng/mL) and mouse IL-3 (10 ng/mL) mice. The Q2 region represents CD41-positive cells (FSC >300 and CD41 > 101–102). Quantitative data were analyzed using bar charts (right panels). Values are mean ± SD (n = 3, Student’s t test).
Discussion
In this study, we demonstrate the correlation between ProT and dengue in clinical patients, ProT Tg mice, and the Meg-01 human megakaryoblastic cell line. Our results show that DENV infection repressed miR-126-3p and reinforced ProT expression in Meg-01 cells. Our in vitro studies suggest the involvement of miR-126, DNMT1, and GATA-1 in these events, resulting in the suppression of megakaryopoiesis. Elevation of ProT was detected in the sera of dengue patients, DENV-infected mice, and DENV-infected Meg-01 cells. We proposed that excess ProT expression impedes megakaryopoiesis at least partly through Nrf2 activation and increased expression of antioxidant genes, thus contributing to dengue-induced thrombocytopenia.
ProT is expressed ubiquitously in a variety of tissues in mammals with diverse functions. Accumulating evidence supports a dual role for ProT, acting both intracellularly and extracellularly.36 ProT has been proposed to be an alarmin, an endogenous protein or molecule that is released from cells during cellular demise to activate the immune system.37 In addition, ProT exerts antiviral effects. The interaction between ProT and Toll-like receptor 4 (TLR4) can enhance type I interferon production in immune cells, leading to inhibiting HIV-1 replication.38,39 Since type I interferons are key regulators of antiviral immunity, the antiviral activity of ProT is likely to have an inhibitory effect on DENV replication. However, such possibility needs to be further explored. Using ProT overexpression and knockdown in Meg-01 megakaryoblasts, we demonstrate a role for intracellular ProT in suppressing megakaryopoiesis. Nevertheless, it is plausible that ProT overexpressed in other cells or acting extracellularly may increase PLT clearance, reduce PLT production, or both. Furthermore, we show that ProT Tg mice have reduced circulating PLT counts and prolonged bleeding times (Figures 2B and 2C). It was reported that tail bleeding times and thrombus formation in small arterioles of mice are largely unaffected by reductions of PLT counts up to 97.5%.40 Thus, a reduction of 26% of PLT counts found in ProT Tg mice is not expected to lead to bleeding disorders. Thus, apart from lower PLT numbers, ProT overexpression may affect additional factors that contribute to extended bleeding times. In mice, thrombocytopenia per se is not sufficient to lead to bleeding. Inflammation is a contributing factor to induce bleeding in thrombocytopenic mice.41 We have reported that ProT can upregulate the expression of nuclear factor κB (NF-κB)-dependent genes, thereby upregulating inflammatory mediators.42 Thus, it is likely that ProT may enhance inflammatory responses to promote DENV-induced thrombocytopenia and hemorrhage. Moreover, ProT is expressed in endothelial cells. In human umbilical vein endothelial cells (HUVECs), ProT is overexpressed under hypoxic conditions43 or after viral infection.44 Interactions of endothelial cells and PLTs are important for developing dengue complications. Thus, overexpression of ProT in endothelial cells may contribute not only to increased PLT clearance, thereby reducing PLT numbers, but also to extended bleeding times in ProT Tg mice.
In the present study, ProT levels increased during the initial phase of DENV infection and then plateaued in Meg-01 cells (Figures 1E and 1F), whereas thrombocytopenia occurs when the viremia declines in patients with dengue. There appears to be discordance between subsidence of viremia and occurrence of thrombocytopenia in Meg-01 cells and mice. Unlike in humans, DENV does not normally propagate or induce dengue hemorrhagic fever in mice.45 Nevertheless, mouse studies have demonstrated that immunization with DENV NS1 induces cross-reactive antibodies against self-epitopes on PLTs, leading to thrombocytopenia and lethality.46 Therefore, we used the two-hit model using DENV and anti-CD41 antibody resembling human dengue infection to induce hemorrhage, which is similar to a local Shwartzman reaction-mediated hemorrhage.46 In this model, the pathogenic response occurs approximately 24–48 h after DENV injection, and the DENV titer rapidly declined without further rebound within 24–48 h, suggesting that DENV propagation in mice is not involved in the development of hemorrhage. In the present study, we show that DENV alone can increase ProT levels in bone marrow cells (Figure 2D) and in the serum (Figure 2E) of mice while viral propagation is not expected to occur. We also found that ProT Tg mice had lower percentages of polyploid cells in CD41-positive megakaryocytes compared to WT mice (Figures 3A and 3B). It was also shown that DENV infection hampers polyploidy and production of PLT-like particles as well as expression of CD41, CD61, and CD42a surface markers in Meg-01 cells.47 Collectively, our results suggest that DENV infection may induce ProT expression, resulting in suppression of megakaryopoiesis.
Epigenetic modulation plays a critical role in dengue-associated pathogenesis. Furthermore, miRNAs can be controlled by epigenetic modifications, and they also regulate epigenetic modifications, thus forming an epigenetic-miRNA-epigenetic feedback loop. The interplay between miR-126 and DNMT1 has been documented. Overexpression of miR-126 reduces DNMT1 protein levels in CD4+ cells of rheumatoid arthritis patients, leading to hypomethylation in promoters of CD11a and CD70 genes.48 Overexpression of DNMT1 results in hypermethylation of the Epithelial growth factor-like 7 (EGFL7) promoter and downregulation of miR-126, whereas overexpression of miR-126 suppresses DNMT1 expression in esophageal squamous cell carcinoma.30 In addition, miR-126 binds to the 3′UTR of the DNMT1 gene and reduces DNMT1 expression in leukemia stem cells.49 Our results suggest that a positive-forward DNMT1-miR-126 regulatory circuit may exist during DENV infection. It has been documented that miR-126 is the most abundant miRNA in endothelial cells and plays a pivotal role in angiogenesis and vascular integrity.50 Mice with deletion of miR-126 exhibit vascular defect, leading to vascular leakage, systemic edema, and hemorrhages. Thus, miR-126 is beneficial for repairing impaired endothelial cells and improving endothelial dysfunction.51,52 Endothelial dysfunction is a hallmark of severe dengue infection through chemokine and cytokine release from infected immune cells or direct infection with DENV.53 Whether miR-126 is reduced in endothelial cells with DENV infection, which may hamper vascular integrity and lead to bleeding or plasma leakage, is currently unclear but warrants further exploration. In the present study, we show that overexpression of miR-126 can attenuate megakaryopoiesis suppression in the bone marrow cells of ProT Tg mice (Figure 7D), suggesting that DENV-induced downregulation of miR-126 may contribute to thrombocytopenia in dengue infection.
GATA-1 is essential for the differentiation of hematopoietic stem cells into blood cells, such as megakaryocytes,54,55 mast cells,56 and eosinophils.57 It contains two zinc-finger domains, and the C-terminal zinc finger of GATA-1 promotes DNA binding to (A/T)GATA(A/G) consensus sequences. GATA-1 can interact with various co-factors, such as Friend of GATA-1 (FOG1), CREB-binding protein (CBP)/p300, and PU.1, and thus positively and negatively regulate gene expression.58 In addition, GATA-1 inhibits PU.1 expression via interactions with DNMT1, which results in histone H3K9 methylation and deacetylation, as well as H3K27 methylation.59 In the present study, we show that ProT mRNA is downregulated during megakaryocyte differentiation (Figure 7A). Furthermore, GATA-1 dose-dependently represses the PTMA promoter activity (Figure 5C), providing evidence for a negative correlation between GATA-1 and ProT. By analyzing the 5′ flaking sequence of the PTMA gene, we found two potential GATA-1 binding sites at −764 to −770 and −1211 to −1217, as well as one PU.1 GAGGAA motif at −1000 to −1005 from the transcriptional start site. These are similar to the sequences reported previously.60 We show that ProT can be downregulated by GATA-1 during megakaryocyte differentiation. However, whether GATA-1 directly binds to the PTMA promoter region or cooperates with other factors requires further study.
The importance of Nrf2 in dengue infection has been documented in various aspects. DENV infection increases the Nrf2 level and its translocation into the nucleus through NS2B3, which causes increases in CLEC5A and tumor necrosis factor alpha (TNF-α) production by mononuclear phagocytes. These contribute to the development of hemorrhage during DENV infection.61 DENV infection induces oxidative stress that activates Nrf2 and leads to antiviral immunity and apoptotic responses in dendritic cells.62 Ferrari et al. show that viral NS2B3 can target Nrf2 for lysosomal degradation, resulting in ROS imbalance and disturbance of antiviral immune response in primary human dendritic cells.63 In peripheral blood mononuclear cells from dengue patients, downregulation of Nrf2 mRNA has been observed.64 It has been shown that Nrf2 negatively regulates PLT production through competing with NF-E2, an erythroid transcription factor. NF-E2 dominates over Nrf2 to enhance megakaryocytic maturation by promoting ROS accumulation.34 ProT can release Nrf2 from the Nrf2-Keap1 complex,16 thereby promoting Nrf2 translocation into the nucleus to upregulate antioxidant gene expression and reduce ROS production.16 We have previously reported that ProT can induce antioxidant gene expression and reduce ROS formation in H2O2-treated endothelial cells.65 In the present study, we demonstrate that ProT and Nrf2 are upregulated upon DENV infection in Meg-01 cells (Figure 6A). Excess ProT promotes nuclear translocation of Nrf2 (Figure 6B) and expression of antioxidant genes (Figure 6C), which may result in suppression of megakaryocyte differentiation. Due to conflicting evidence in the literature, the interaction of Nrf2 and oxidative stress in dengue pathogenesis appears to be complicated and warrants further research.
Bleeding and vascular leakage are two common complications found in severe dengue patients, which are attributable to both PLT reduction and PLT dysfunction. Several lines of evidence have suggested that megakaryocytes are the main target for DENV infection.66,67 Infection with DENV inhibits megakaryocyte viability and differentiation.7,68 Using humanized mice to study the pathophysiology of thrombocytopenia in DENV infection, Vogt et al. showed that mature megakaryocytes are reduced and mainly infected by DENV in the bone marrow.69 It was shown that DENV envelope protein domain III suppresses megakaryopoiesis in vivo and in vitro.70 Moreover, DENV infection impedes megakaryopoiesis in Meg-01 cells, which may be attributed to the binding of viral envelope protein to TAL-1, a megakaryopoiesis-specific transcription factor, and sequestration of TAL-1 in the cytoplasm.47 Therefore, the mechanisms underlying dengue-induced impairment of megakaryopoiesis and thrombopoiesis are complicated and largely unclear. In the current study, our findings provide another possible mechanism, where DENV induces ProT overexpression to suppress megakaryopoiesis through promoting Nrf2 translocation to the nucleus and reducing ROS production.
Different mechanisms of DENV-induced thrombocytopenia have been reported or proposed. Our results obtained from ProT Tg mice, dengue patients, as well as ex vivo and in vitro experiments indicate that elevated expression of ProT is associated with thrombocytopenia in dengue infection. Although DENV infection can upregulate ProT expression and lower PLT numbers, the evidence for a causal relationship between ProT and thrombocytopenia in DENV infection has not been clarified, which warrants more research.
Conclusions
This study links ProT with thrombocytopenia in dengue infection, which may involve miR-126, DNMT1, GATA-1, Nrf2, and ROS. Our findings provide important insights into the function and underlying mechanism of ProT in dengue-associated thrombocytopenia.
Limitations of the study
In this study, we demonstrate that DENV infection upregulates ProT expression, leading to suppressing megakaryopoiesis. The underlying mechanism was studied in the Meg-01 megakaryoblastic cell line. Since the cellular behavior in vitro is sometimes greatly different from their responses in vivo, the detailed molecular mechanism still remains to be further investigated. In addition, patients with dengue enrolled in this study were admitted to the emergency department of a teaching hospital with fever; most were in the acute febrile phase. Therefore, it was not possible to study the correlation of serum ProT levels and disease severity.
STAR★Methods
Key resources table
| REAGENT or RESOURCE | SOURCE | IDENTIFIER |
|---|---|---|
| Antibodies | ||
| anti-CD41 antibody | BD Biosciences | Cat #553847; RRID: AB_395084 |
| mouse monoclonal anti-ProT antibody | Sukhacheva et al., 200271 | clone 2F11 |
| FITC-conjugated anti-mouse CD41 antibody | BD Biosciences | Cat #561849; RRID: AB_10892804 |
| BB515-conjugated anti-human CD41 antibody | BD Biosciences | Cat #565938; RRID: AB_2739402 |
| PE-conjugated anti-mouse CD61 antibody | BioLegend | Cat #104307; RRID: AB_313084 |
| PE-Cy5-conjugated anti-human CD42b antibody | BD Biosciences | Cat #551141; RRID: AB_394069 |
| FITC-conjugated anti-mouse CD3e | BD Biosciences | Cat #553062; RRID: AB_394595 |
| FITC-conjugated anti-mouse CD19 | BD Biosciences | Cat #553785; RRID: AB_395049 |
| PE-conjugated anti-mouse/human CD11b | BioLegend | Cat #101207; RRID: AB_312790 |
| rabbit anti-DENV NS-3 antibody | GeneTex | Cat #GTX124252; RRID: AB_11171668 |
| Mouse monoclonal anti-Dnmt1 antibody | Santa Cruz Biotechnology | Cat #sc-271729; RRID: AB_10710384 |
| Mouse monoclonal anti-Dnmt1 antibody | Abcam | Cat #ab13537; RRID: AB_300438 |
| mouse monoclonal anti-GATA-1 antibody | Abcam | Cat #ab181544; RRID: AB_2920794 |
| rabbit anti-Nrf2 antibody | Proteintech | Cat #16396-1-AP; RRID: AB_2782956 |
| rabbit anti-Keap1 antibody | Proteintech | Cat #10503-2-AP; RRID: AB_2132625 |
| rabbit anti-HA probe antibody | Abcam | Cat #ab9110; RRID: AB_307019 |
| mouse monoclonal anti-GFP antibody | Santa Cruz Biotechnology | Cat #sc-9996; RRID: AB_627695 |
| rabbit anti-GAPDH antibody | GeneTex | Cat #GTX100118; RRID: AB_1080976 |
| mouse monoclonal anti-α-tubulin antibody | Abcam | Cat #7291; RRID: AB_2241126 |
| rabbit anti-lamin A/C antibody | Proteintech | Cat #10298-1-AP; RRID: AB_2296961 |
| mouse monoclonal anti-β-actin peroxidase antibody | Sigma-Aldrich | Cat #A3854; RRID: AB_262011 |
| Horseradish peroxidase-conjugated goat anti-mouse antibody | Jackson Immunoresearch Laboratories | Cat #115-035-003; RRID: AB_10015289 |
| Horseradish peroxidase-conjugated goat anti-rabbit antibody | Jackson Immunoresearch Laboratories | Cat #111-035-003; RRID: AB_2313567 |
| Bacterial and viral strains | ||
| DENV-2 (PL046 strain) | N/A | |
| Chemicals, peptides, and recombinant proteins | ||
| murine thrombopoietin (TPO) | Peprotech | Cat #315-14 |
| murine IL-3 | Peprotech | Cat #213-13 |
| phorbol 12-myristate 13-acetate (PMA) | Sigma-Aldrich | Cat #P8139 |
| Propidium Iodide (PI) | Sigma-Aldrich | Cat #P4170 |
| 5′-AZA-2′-deoxycytidine | Sigma-Aldrich | Cat #A3656 |
| 2′,7′-dichlorodihydrofluorescein diacetate (DCFDA) | Invitrogen | Cat #D399 |
| Critical commercial assays | ||
| Dengue NS1 Ag STRIP | Bio-Rad | Cat #70700 |
| High Pure RNA Isolation Kit | Roche | Cat #11828665001 |
| High-Capacity cDNA Reverse Transcription Kit | Applied Biosystems | Cat #4368813 |
| TagMan Universal PCR Master Mix | Applied Biosystems | Cat #4304437 |
| TaqMan miRNA assay: has-miR-126-3p | Applied Biosystems | Cat #A25576 |
| TaqMan miRNA assay: RNU6B snRNA | Applied Biosystems | Cat #4427975 |
| EZ-CHIP kit | Millipore | Cat #17-371 |
| Experimental models: Cell lines | ||
| Human: Meg-01 cell | Bioresource Collection and Research Center | Cat #60238 |
| Human: 293T cell | National RNAi Core Facility, Academia Sinica, Taiwan | N/A |
| Mosquito: C6/36 cell | Bioresource Collection and Research Center | Cat #60114 |
| Hamster: BHK-21 cell | Bioresource Collection and Research Center | Cat #60041 |
| Experimental models: Organisms/strains | ||
| C57BL/6 mice | National Cheng Kung University (NCKU) Laboratory Animal Center | N/A |
| ProT Tg mice (C57BL/6J strain) | Li et al., 200572 | N/A |
| Oligonucleotides | ||
| qPCR and PCR Primers (See Table S2) | This paper | N/A |
| Recombinant DNA | ||
| pSIN4-EF1a-GATA1-IRES-Puro | Addgene | Addgene plasmid 61062; RRID: Addgene_61062 |
| mVenus N1 | Addgene | Addgene plasmid 27793; RRID:Addgene_27793 |
| pSin-EF2-Pur | Su et al., 201573 | N/A |
| pGL3-pProT-Luc | This paper | N/A |
| pLAS2w.hProT-HA | This paper | N/A |
| pLAS2w.hProT-Venus | This paper | N/A |
| pLAS2w.Ppuro | RNAi core | N/A |
| pre-miR-126 | System Biosciences | Cat #PMIRH126AA-1 |
| pre-miR-scramble | System Biosciences | Cat #PMIRH000PA-1 |
| shRNA to human ProT: shProT-17 | RNAi Core Facility, Academia Sinica | Cat #TRCN0000134223 |
| shRNA to human ProT: shProT-20 | RNAi Core Facility, Academia Sinica | Cat #TRCN0000138750 |
| shRNA to β-galactosidase: shLacZ | RNAi Core Facility, Academia Sinica | Cat #TRCN0000072240 |
| Software and algorithms | ||
| ImageJ | National Institutes of Health | https://ImageJ.nih.gov/ij/; RRID: SCR_003070 |
| Prism | GraphPad version 8.0 | https://www.graphpad.com/; RRID: SCR_002798 |
| FlowJo | BD Biosciences | RRID: SCR_008520 |
| Deposited data | ||
| RNA expression in megakaryocytes from GATA-1 knockout mice, microarray data | Muntean and Crispino, 200533 | GSE2527 |
Resource availability
Lead contact
Further information and requests for resources and reagents should be directed to and will be fulfilled by the lead contact, Ai-Li Shiau (alshiau@mail.ncku.edu.tw).
Materials availability
All data generated in this study are available from corresponding authors on reasonable request.
Data and code availability
-
•
All data reported in this paper will be shared by the corresponding authors upon request.
-
•
This paper analyzes existing, publicly available data. The accession number for the dataset is listed in the key resources table.
-
•
Any additional information required to reanalyze the data reported in this paper is available from the lead contact upon request.
Experimental model and subject details
Clinical samples
Since dengue is not endemic in Taiwan, most dengue fever cases in Taiwan have resulted from imported cases. However, Taiwan has experienced two large dengue outbreaks in history, the first in 2014 (15,492 cases) and the second in 2015 (43,419 cases) in southern Taiwan.26 The present study included serum samples from adult dengue patients (n = 101, male n = 46 and female n = 55) in the age range of 20–89 years admitted to the emergency department of Kaohsiung Medical University Hospital and healthy individuals (n = 27) collected during dengue outbreaks in 2014–2015. Serum samples from dengue patients who were diagnosed as dengue were confirmed with the Dengue NS1 Ag strip (Bio-Rad, Maines-la-Coquette, France) at the Taiwan Centers for Disease Control (CDC).74 Dengue patients were grouped according to their PLT counts (>150,000/mm3, n = 35; 100,000–150,000/mm3, n = 30; <100,000/mm3, n = 36). The use of the sera from adult dengue patients and healthy individuals in this study has been approved by the Institutional Review Board of Kaohsiung Medical University Hospital (IRB Number: KMUHIRB-E(I)-20170197). The sera were collected after obtaining informed written consents.
Mice and DENV-induced thrombocytopenia mouse model
Male C57BL/6 mice were purchased from National Cheng Kung University (NCKU) Laboratory Animal Center and used at 6–8 weeks of age. ProT Tg mice were generated on a C57BL/6 background in our laboratory.72 All animal work was conducted in animal biosafety level 2 facilities at NCKU. The experimental protocols adhered to the rules of the Animal Protection Act of Taiwan and were approved by the Animal Care and Use Committee of NCKU (IACUC number: 106120).
A two-hit model for dengue-induced hemorrhage was established as previously described.29 Human primary infection with DENV can induce mild symptoms, known as dengue fever. However, secondary infection may induce life-threatening dengue hemorrhagic fever. The two-hit model in mice using DENV and anti-CD41 (PLT marker) antibody resembles human dengue infection. The first hit mimics viremia by injecting DENV, and the second hit imitates NS1-elicited autoantibody by offering anti-CD41 neutralizing antibody. ProT Tg and WT C57BL/6 mice were injected subcutaneously with 107 PFU of DENV-2 (PL046 strain) with or without injection of 1 mg/kg of anti-CD41 antibody (BD Biosciences, San Diego, CA, USA) after 24 h at the same site of DENV injection. Various parameters of mice were determined at different time points after viral infection.
Cells
Human megakaryoblastic Meg-01 cells were cultured in RPMI 1640 medium at 37°C in 5% CO. Human 293T, hamster BHK-21, and mosquito C6/36 cells were cultured in Dulbecco’s modified Eagle’s medium (DMEM) at 37°C in 5% CO2, except for C6/36 cells, which were grown at 28°C. All media were supplemented with 10% fetal bovine serum (FBS), 2 mM L-glutamine, and 50 μg/mL gentamicin. Megakaryocyte differentiation from bone marrow cells of ProT Tg and C57BL/6 mice were maintained in DMEM supplemented with 10% FBS, 50 ng/mL murine thrombopoietin (TPO) (Peprotech, Cranbury, NJ), 10 ng/mL murine IL-3 (Peprotech), 2 mM L-glutamine, and 50 μg/mL gentamicin for 6 days.
Plasmids and lentiviral vectors
pSIN4-EF1a-GATA1-IRES-Puro and mVenus N1 plasmids were gifts from Igor Slukvin (Addgene plasmid # 61062) and Steven Vogel (Addgene plasmid # 27793), respectively.75,76 The pSin-EF2-Pur plasmid that encodes no transgenes was constructed as previously described.73 A luciferase reporter plasmid containing the PTMA promoter was generated as follows. The PTMA promoter region (from −1875 to +1 bp relative to the transcription start site) was obtained by polymerase chain reaction (PCR) with the primer pairs (ProT-prom): 5′-AGACGGGCACCTGGGAACG-3′ (forward) and 5′-GTTCAGGGACTCTGGCGATAAAGC-3′ (reverse) and subcloned into the pGL3-Basic vector (Promega, Madison, WI) to generate the PTMA promoter-containing pGL3 luciferase reporter vector pGL3-pProT-Luc. For construction of human ProT expression vectors, the coding region of STAT3 was removed from pCMV-STAT3-HA77 and replaced with the coding region of human ProT obtained from 293T cells by RT-qPCR amplification, resulting in pCMV-hProT-HA plasmid. Furthermore, the coding region of human ProT was also subcloned into mVenus-N1 to generate hProT-Venus plasmid. Subsequently, the fragments of hProT-HA and hProT-Venus were excised from pCMV-hProT-HA and hProT-Venus plasmids and then subcloned into pLAS2w.Ppuro lentiviral vector (RNAi Core, Academia Sinica, Taiwan), yielding pLAS2w.hProT-HA and pLAS2w.hProT-Venus, respectively. For miRNA-126 overexpression experiments, plasmids of pre-miR-126 (System Biosciences, PMIRH126AA-1) and pre-miR-scramble (System Biosciences, PMIRH000PA-1) were obtained. For knockdown experiments, pLKO.1-puro-based lentiviral vectors encoding shRNAs for human GATA-1 (TRCN0000358358 and TRCN0000358359; designated shGATA-1-358 and 359), human ProT (TRCN0000134223 and TRCN0000138750; designated shProT-17 and 20) and β-galactosidase (TRCN0000072240, designated shLacZ) were obtained from the RNAi Core at Academia Sinica, Taiwan. Recombinant LVs for overexpression and knockdown experiments were produced and titrated as previously described.42
Propagation and titration of DENV
DENV-2 (PL046 strain), a Taiwanese strain isolated from a dengue virus patient in 1981 by Y.C. Wu at the National Institute of Preventive Medicine, Taiwan (renamed Centers for Disease Control in 1999, Executive Yuan), was provided by Y.C. Wu.78 The viruses were propagated in C6/36 cells and quantified by the plaque assay on BHK-21 cells as previously described.79 All in vitro work on DENV was carried out in biosafety level 2 laboratories.
Method details
Determination of complete blood count, bleeding time, and skin hemorrhage
For measuring bleeding time, a distal 10-mm segment of the mouse tail was amputated with a scalpel and the tail was immediately submerged in a 50 mL of isotonic saline prewarmed to 37°C. The time to bleeding cessation was recorded up to 10 min. For measuring the PLT count, 100 μL whole blood from mice were collected into 1.5 mL centrifuge tubes containing 10 μL 0.5 M EDTA (pH 8.0). The complete blood counts were determined by Scil Vet Focus 5 hematology analyzer (Scil Animal Care Company, Gurnee, IL, USA). To observe hemorrhage development, the skins from DENV-infected mice were collected, and images of hemorrhagic lesions of the skin were taken. Clinical score of local skin hemorrhage was evaluated as previously described.80
Flow cytometric analysis of megakaryocyte differentiation
In ex vivo experiments, bone marrow cells were isolated from both sides of the femurs and tibias of ProT Tg and WT C57BL/6 mice for megakaryocyte differentiation as described previously.81 Mouse bone marrow cells were treated with mouse TPO (50 ng/mL) for 6 days and infected with DENV-2 at a multiplicity of infection (MOI) of 1 from day 3 onwards. For miR-126 overexpression experiments, bone marrow cells collected from ProT Tg mice were treated with mouse TPO (50 ng/mL) for 7 days and transduced with LV.miR-126 or LV.miR-Ctrl at day 2. In in vitro experiments, Meg-01 cells that had been transduced with lentiviral vectors encoding shRNAs specific to ProT or LacZ were treated with 10−6 M phorbol 12-myristate 13-acetate (PMA) (Sigma-Aldrich, St. Louis, MO, USA), which is commonly used for inducing megakaryopoiesis in vitro,82 for 7 days. The treated cells from ex vivo and in vitro experiments were examined for specific megakaryocytic cell surface markers using FITC-conjugated anti-mouse CD41 antibody (BD Biosciences), BB515-conjugated anti-human CD41 antibody (BD Biosciences), or PE-conjugated anti-mouse CD61 antibody (BioLegend, San Diego, CA, USA), followed by propidium iodide staining.81,83 For detection of late stage of megakaryocyte differentiation, the cells were incubated with PE-Cy5-conjugated anti-human CD42b antibody (BD Biosciences), and their surface expression of CD41 and CD42b, as well as DNA content was analyzed by flow cytometer (FACSCalibur, Becton-Dickinson Biosciences, San Jose, CA, USA).
ELISA and immunoblot analysis
Levels of ProT in human and mouse sera and cell culture supernatants were quantified by ELISA.13,73,84 Meg-01 cells (2 × 10⁵) were infected with DENV-2 at an MOI of 1, and the culture medium was replaced with 2 mL of fresh medium containing 4% FBS after 2 h. The culture supernatants were harvested at different time points for detecting ProT levels by ELISA. It should be noted that the sandwich ELISA that we developed used rabbit anti-human ProT polyclonal antibody as the coating antibody and mouse 6A9 monoclonal antibody that you generated previously as the detecting antibody.73 Since we did not map the epitope of ProT recognized by the 6A9 antibody, we could not exclude the possibility that some ProT-related fragments may not be detected using this assay. Immunoblotting was performed using standard methods, except for detecting ProT, which required an acidic transfer method.42 Levels of ProT, DENV NS-3, DNMT1, GATA-1, Nrf2, Keap1, HA, or GFP were assessed in the cell lysates from DENV-infected Meg-01 cells, genetically modified Meg-01 cells via lentiviral transduction or plasmid transfection, or primary mouse bone marrow cells. In another set of the experiment, DENV-infected Meg-01 cells were treated with various concentrations of the DNMT1 inhibitor 5′-AZA-2′-deoxycytidine (A3656, Sigma-Aldrich) for 72 h,85 and the cell lysates were detected for GATA-1 and NS3 by immunoblotting. The primary antibodies used in this study included mouse monoclonal anti-ProT (1 μg/mL, clone 2F11, ascites fluid),71 rabbit anti-DENV NS-3 antibody (1:3000, GeneTex, Irvine, CA, USA), rabbit anti-Dnmt1 antibody (1:1000, Santa Cruz Biotechnology, Santa Cruz, CA, USA), mouse monoclonal anti-GATA-1 antibody (1:10000, Abcam, Cambridge, UK), rabbit anti-Nrf2 antibody (1:1000, Proteintech, Chicago, IL, USA), rabbit anti-Keap1 (1:1000, Proteintech), rabbit anti-HA probe antibody (1:5000, Abcam), mouse monoclonal anti-GFP (1:1000, Santa Cruz), rabbit anti-GAPDH antibody (1:10000, GeneTex), mouse monoclonal anti-α-tubulin (1:10000, Abcam), rabbit anti-lamin A/C (1:1000, Proteintech), and mouse monoclonal anti-β-actin peroxidase antibody (1:10000, Sigma-Aldrich). Horseradish peroxidase-conjugated goat anti-mouse or anti-rabbit IgG (Jackson Immunoresearch Laboratories, West Grove, PA, USA) was used as the secondary antibody. Relative intensities of protein bands were quantified using the public-domain image analysis package ImageJ software (U.S. National Institute of Health). Of note, the mouse 2F11 anti-ProT monoclonal antibody that we used for immunoblot analysis has been shown to recognize epitopes within the amino terminal portion of ProT, at least containing first 1–31 amino acid residues of ProT.71 For detecting intracellular ProT by immunoblotting, only one clear band around 17 kDa was detected in all immunoblots. Due to the high background problem of the 2F11 antibody, we used the 6A9 antibody as the detecting antibody for ELISA.
RT-qPCR and luciferase reporter assay
Total cellular RNA was extracted by using High Pure RNA Isolation Kit (Roche Diagnostics, Mannheim, Germany) according to the manufacturer’s protocol. A REVERSE-IT first-strand synthesis kit (Applied Biosystems, Foster, CA, USA) was used for complementary DNA synthesis. For real-time PCR analysis, we followed the standard SYBR Green method with the StepOne and StepOnePlus Real-Time PCR Systems (Applied Biosystems). GAPDH was used as a control for normalization of cellular RNA and intracellular viral RNA. The following primers were used: for DENV 5′UTR: 5′- AGTTGTTAGTCTACGTGGACCGA-3′ (forward) and 5′- CGCGTTTCAGCATATTGAAAG-3′ (reverse); for human DNMT1: 5′- AGGCGGCTCAAAGATTTGGAA-3′ (forward) and 5′- GCAGAAATTCGTGCAAGAGATTC-3′ (reverse); for human ProT: 5′- GCTAACGGGAATGCTAATGAGG-3′ (forward) and 5′- GTAGCTGACTCAGCTTCCTCATCT-3′ (reverse); for human GATA-1: 5′-ATCAC AAGATGAATGGGCAGAA-3′ (forward) and 5′-CACAGTGTCGTGGTGGTCGT-3′ (reverse); for human Nrf-2: 5′-AACCACCCTGAAAGCACAGC-3′ (forward) and 5′- TGAAATGCCGGAGTCAGAATC-3′ (reverse); for human HO-1: 5′- CCGACAGCATGCCCCAGGATTT-3′ (forward) and 5′- TTGAAGCCGTCTCGGGTCACCT-3′ (reverse); for human NQO1: 5′-CGCAGACCTTGTGATATTCCAG-3′ (forward) and 5′-CGTTTCTTCCATCCTTCCAGG-3′ (reverse); for human GP9: 5′- ACCCTCGATGTGACGCAGA-3′ (forward) and 5′-CCAGAGGCGCAGATAGGTG-3′ (reverse); for human TUBB1: 5′-AACACGGGATCGACTTGGC-3' (forward) and 5′-CTCGGGGCACATATTTCCTAC-3' (reverse); for GAPDH: 5′-GCCATCACTGCCACCAG -3′ (forward) and 5′-TCTTACTCCTTGGAGGCCATGT -3′ (reverse). The expression of miR-126-3p was measured using TagMan universal Master Mix and TaqMan miRNA assay (has-miR-126-3p, Catalog no: A25576, Assay ID: 477877_mir). The RNU6B snRNA was used as the housekeeper gene (Catalog no: 4427975, Assay ID: 001093). To determine whether expression of GATA-1 affected the PTMA promoter activity, 293T cells (2 × 10⁵) cultured in 12-well plates were cotransfected with the ProT reporter vector pGL3-pProT-Luc (1 μg) and the GATA-1 expression vector pSin4-EF1a-GATA1-IRES-Puro (0, 0.25, 0.5, and 1 μg). The total amount of plasmid DNA for transfection was kept constant by the addition of a control plasmid (pSin-EF2-Pur). Cell lysates were harvested at 48 h after transfection, and their luciferase activities were determined.
ChIP assay
ChIP assay was performed with the EZ-ChIP kit (Millipore, Billerica, MA, USA) as described previously.42 Briefly, Meg-01 cells with or without DENV infection for 3 days were crossed-linked by 1% formaldehyde for 5 min. The cells were lysed in an SDS lysis buffer, and lysates were sonicated with alternating 30 s pulses for 8 times with an ultrasonic cell disruptor (Microson XL2000, Misonix Inc., Farmingdale, NY, USA) to shear DNA. Immunoprecipitation was carried out overnight at 4°C with 5 μg anti-Dnmt1 (Abcam), or 1 μg anti-IgG antibodies in combination with protein G agarose provided in the EZ-ChIP kit. The immunoprecipitates were washed and reverse cross-linked, and the DNA was eluted. PCR was performed to detect the binding of DNMT1 to the GATA-1 promoter with specific primers 2,300 bp upstream of the transcription start site of human GATA-1 (GeneBank: NC_000023.11). The PCR primer pair used in the ChIP assay was GATA-1-2.3 k: 5′-GGCTGTCAATGGGTACAAAG-3′ (forward) and 5′-CGCCTCTTTCAGCTATTTTG -3′ (reverse). The PCR products were separated by 1.5% agarose gel electrophoresis.
ROS assay
Meg-01 cells transduced with lentiviral vectors encoding ProT or shRNAs specific to ProT, or with respective control vectors were treated with 10−6 M PMA for 7 days, followed by incubation with the ROS sensitive fluorometric probe 2′,7′-dichlorodihydrofluorescein diacetate (DCFDA) (Invitrogen, Carlsbad, CA, USA) at 37°C for 30 min. The cells were then analyzed using FACSCalibur flow cytometer (BD Biosciences).
Quantification and statistical analysis
Data are expressed as mean ± standard deviation (SD). Statistical differences were compared by Student’s t test between two groups and by one-way ANOVA with Bonferroni post hoc test among three or more groups. The differences were considered significant if p values were <0.05. Statistical tests were performed using GraphPad Prism (version 8.0, GraphPad software, San Diego, CA, USA).
Acknowledgments
We are grateful to Dr. A.B. Vartapetian (Belozersky Institute of Physico-Chemical Biology, Moscow State University, Russia) for generously providing the anti-ProT monoclonal antibody (clone 2F11). We thank the support from the Core Research Laboratory and from the Laboratory Animal Center, College of Medicine, National Cheng Kung University (NCKU), Taiwan for providing instruments and mice, respectively. We also thank the National RNAi Core Facility at Academia Sinica in Taiwan for providing shRNA reagents and related services. This work was supported by Ditmanson Medical Foundation Chia-Yi Christian Hospital Research Program (R110-037).
Author contributions
M.-L.Y. designed and performed experiments, analyzed data, and wrote the manuscript. C.-L.L. analyzed and interpreted data and reviewed the manuscript. Y.-C.C., I.-A.L., and B.-H.S. performed experiments. Y.-H.C and K.-T.L. provided human clinical samples and analyzed data. C.-L.W. and A.-L.S. jointly supervised the work, interpreted data, and wrote the manuscript. All authors have read and agreed to the published version of the manuscript.
Declaration of interests
The authors declare that they have no competing interests.
Inclusion and diversity
We support inclusive, diverse, and equitable conduct of research.
Published: December 2, 2023
Footnotes
Supplemental information can be found online at https://doi.org/10.1016/j.isci.2023.108422.
Contributor Information
Chao-Liang Wu, Email: wumolbio@mail.ncku.edu.tw.
Ai-Li Shiau, Email: alshiau@mail.ncku.edu.tw.
Supplemental information
References
- 1.de Azeredo E.L., Monteiro R.Q., de-Oliveira Pinto L.M. Thrombocytopenia in dengue: interrelationship between virus and the imbalance between coagulation and fibrinolysis and inflammatory mediators. Mediat. Inflamm. 2015;2015 doi: 10.1155/2015/313842. [DOI] [PMC free article] [PubMed] [Google Scholar]
- 2.Wang S., He R., Patarapotikul J., Innis B.L., Anderson R. Antibody-enhanced binding of dengue-2 virus to human platelets. Virology. 1995;213:254–257. doi: 10.1006/viro.1995.1567. [DOI] [PubMed] [Google Scholar]
- 3.Saito M., Oishi K., Inoue S., Dimaano E.M., Alera M.T.P., Robles A.M.P., Estrella B.D., Jr., Kumatori A., Moji K., Alonzo M.T., et al. Association of increased platelet-associated immunoglobulins with thrombocytopenia and the severity of disease in secondary dengue virus infections. Clin. Exp. Immunol. 2004;138:299–303. doi: 10.1111/j.1365-2249.2004.02626.x. [DOI] [PMC free article] [PubMed] [Google Scholar]
- 4.Ojha A., Nandi D., Batra H., Singhal R., Annarapu G.K., Bhattacharyya S., Seth T., Dar L., Medigeshi G.R., Vrati S., et al. Platelet activation determines the severity of thrombocytopenia in dengue infection. Sci. Rep. 2017;7 doi: 10.1038/srep41697. [DOI] [PMC free article] [PubMed] [Google Scholar]
- 5.Nelson E.R., Bierman H.R., Chulajata R. Hematologic findings in the 1960 hemorrhagic fever epidemic (dengue) in Thailand. Am. J. Trop. Med. Hyg. 1964;13:642–649. doi: 10.4269/ajtmh.1964.13.642. [DOI] [PubMed] [Google Scholar]
- 6.La Russa V.F., Innis B.L. Mechanisms of dengue virus-induced bone marrow suppression. Baillieres Clin. Haematol. 1995;8:249–270. doi: 10.1016/s0950-3536(05)80240-9. [DOI] [PubMed] [Google Scholar]
- 7.Sridharan A., Chen Q., Tang K.F., Ooi E.E., Hibberd M.L., Chen J. Inhibition of megakaryocyte development in the bone marrow underlies dengue virus-induced thrombocytopenia in humanized mice. J. Virol. 2013;87:11648–11658. doi: 10.1128/JVI.01156-13. [DOI] [PMC free article] [PubMed] [Google Scholar]
- 8.Noisakran S., Onlamoon N., Hsiao H.M., Clark K.B., Villinger F., Ansari A.A., Perng G.C. Infection of bone marrow cells by dengue virus in vivo. Exp. Hematol. 2012;40:250–259.e4. doi: 10.1016/j.exphem.2011.11.011. [DOI] [PMC free article] [PubMed] [Google Scholar]
- 9.Clark K.B., Noisakran S., Onlamoon N., Hsiao H.M., Roback J., Villinger F., Ansari A.A., Perng G.C. Multiploid CD61+ cells are the pre-dominant cell lineage infected during acute dengue virus infection in bone marrow. PLoS One. 2012;7 doi: 10.1371/journal.pone.0052902. [DOI] [PMC free article] [PubMed] [Google Scholar]
- 10.Noisakran S., Onlamoon N., Pattanapanyasat K., Hsiao H.M., Songprakhon P., Angkasekwinai N., Chokephaibulkit K., Villinger F., Ansari A.A., Perng G.C. Role of CD61+ cells in thrombocytopenia of dengue patients. Int. J. Hematol. 2012;96:600–610. doi: 10.1007/s12185-012-1175-x. [DOI] [PMC free article] [PubMed] [Google Scholar]
- 11.Conteas C.N., Mutchnick M.G., Palmer K.C., Weller F.E., Luk G.D., Naylor P.H., Erdos M.R., Goldstein A.L., Panneerselvam C., Horecker B.L. Cellular levels of thymosin immunoreactive peptides are linked to proliferative events: evidence for a nuclear site of action. Proc. Natl. Acad. Sci. USA. 1990;87:3269–3273. doi: 10.1073/pnas.87.9.3269. [DOI] [PMC free article] [PubMed] [Google Scholar]
- 12.Bustelo X.R., Otero A., Gómez-Márquez J., Freire M. Expression of the rat prothymosin alpha gene during T-lymphocyte proliferation and liver regeneration. J. Biol. Chem. 1991;266:1443–1447. [PubMed] [Google Scholar]
- 13.Wu C.L., Shiau A.L., Lin C.S. Prothymosin alpha promotes cell proliferation in NIH3T3 cells. Life Sci. 1997;61:2091–2101. doi: 10.1016/s0024-3205(97)00882-5. [DOI] [PubMed] [Google Scholar]
- 14.Rodríguez P., Viñuela J.E., Alvarez-Fernández L., Buceta M., Vidal A., Domínguez F., Gómez-Márquez J. Overexpression of prothymosin alpha accelerates proliferation and retards differentiation in HL-60 cells. Biochem. J. 1998;331(Pt 3):753–761. doi: 10.1042/bj3310753. [DOI] [PMC free article] [PubMed] [Google Scholar]
- 15.Rodríguez P., Viñuela J.E., Alvarez-Fernández L., Gómez-Márquez J. Prothymosin alpha antisense oligonucleotides induce apoptosis in HL-60 cells. Cell Death Differ. 1999;6:3–5. doi: 10.1038/sj.cdd.4400450. [DOI] [PubMed] [Google Scholar]
- 16.Karapetian R.N., Evstafieva A.G., Abaeva I.S., Chichkova N.V., Filonov G.S., Rubtsov Y.P., Sukhacheva E.A., Melnikov S.V., Schneider U., Wanker E.E., Vartapetian A.B. Nuclear oncoprotein prothymosin alpha is a partner of Keap1: implications for expression of oxidative stress-protecting genes. Mol. Cell Biol. 2005;25:1089–1099. doi: 10.1128/MCB.25.3.1089-1099.2005. [DOI] [PMC free article] [PubMed] [Google Scholar]
- 17.Chen S., Su Y., Wang J. ROS-mediated platelet generation: a microenvironment-dependent manner for megakaryocyte proliferation, differentiation, and maturation. Cell Death Dis. 2013;4:e722. doi: 10.1038/cddis.2013.253. [DOI] [PMC free article] [PubMed] [Google Scholar]
- 18.Murakami S., Shimizu R., Romeo P.-H., Yamamoto M., Motohashi H. Keap1-Nrf2 system regulates cell fate determination of hematopoietic stem cells. Gene Cell. 2014;19:239–253. doi: 10.1111/gtc.12126. [DOI] [PubMed] [Google Scholar]
- 19.Wong R.R., Abd-Aziz N., Affendi S., Poh C.L. Role of microRNAs in antiviral responses to dengue infection. J. Biomed. Sci. 2020;27:4. doi: 10.1186/s12929-019-0614-x. [DOI] [PMC free article] [PubMed] [Google Scholar]
- 20.Tambyah P.A., Ching C.S., Sepramaniam S., Ali J.M., Armugam A., Jeyaseelan K. microRNA expression in blood of dengue patients. Ann. Clin. Biochem. 2016;53:466–476. doi: 10.1177/0004563215604001. [DOI] [PubMed] [Google Scholar]
- 21.Ouyang X., Jiang X., Gu D., Zhang Y., Kong S.K., Jiang C., Xie W. Dysregulated serum miRNA profile and promising biomarkers in dengue-infected patients. Int. J. Med. Sci. 2016;13:195–205. doi: 10.7150/ijms.13996. [DOI] [PMC free article] [PubMed] [Google Scholar]
- 22.Pong L.Y., Parkkinen S., Dhanoa A., Gan H.M., Wickremesinghe I.A.C., Syed Hassan S. MicroRNA profiling of mouse liver in response to DENV-1 infection by deep sequencing. PeerJ. 2019;7 doi: 10.7717/peerj.6697. [DOI] [PMC free article] [PubMed] [Google Scholar]
- 23.Kakumani P.K., Ponia S.S., S R.K., Sood V., Chinnappan M., Banerjea A.C., Medigeshi G.R., Malhotra P., Mukherjee S.K., Bhatnagar R.K. Role of RNA interference (RNAi) in dengue virus replication and identification of NS4B as an RNAi suppressor. J. Virol. 2013;87:8870–8883. doi: 10.1128/JVI.02774-12. [DOI] [PMC free article] [PubMed] [Google Scholar]
- 24.Kakumani P.K., Rajgokul K.S., Ponia S.S., Kaur I., Mahanty S., Medigeshi G.R., Banerjea A.C., Chopra A.P., Malhotra P., Mukherjee S.K., Bhatnagar R.K. Dengue NS3, an RNAi suppressor, modulates the human miRNA pathways through its interacting partner. Biochem. J. 2015;471:89–99. doi: 10.1042/BJ20150445. [DOI] [PubMed] [Google Scholar]
- 25.Kaudewitz D., Skroblin P., Bender L.H., Barwari T., Willeit P., Pechlaner R., Sunderland N.P., Willeit K., Morton A.C., Armstrong P.C., et al. Association of microRNAs and YRNAs with platelet function. Circ. Res. 2016;118:420–432. doi: 10.1161/CIRCRESAHA.114.305663. [DOI] [PMC free article] [PubMed] [Google Scholar]
- 26.Wang W.H., Lin C.Y., Chang K., Urbina A.N., Assavalapsakul W., Thitithanyanont A., Lu P.L., Chen Y.H., Wang S.F. A clinical and epidemiological survey of the largest dengue outbreak in Southern Taiwan in 2015. Int. J. Infect. Dis. 2019;88:88–99. doi: 10.1016/j.ijid.2019.09.007. [DOI] [PubMed] [Google Scholar]
- 27.Liu C., Huang B., Wang H., Zhou J. The heterogeneity of megakaryocytes and platelets and implications for ex vivo platelet generation. Stem Cells Transl. Med. 2021;10:1614–1620. doi: 10.1002/sctm.21-0264. [DOI] [PMC free article] [PubMed] [Google Scholar]
- 28.Schmitt A., Guichard J., Massé J.M., Debili N., Cramer E.M. Of mice and men: comparison of the ultrastructure of megakaryocytes and platelets. Exp. Hematol. 2001;29:1295–1302. doi: 10.1016/s0301-472x(01)00733-0. [DOI] [PubMed] [Google Scholar]
- 29.Lien T.S., Sun D.S., Chang C.M., Wu C.Y., Dai M.S., Chan H., Wu W.S., Su S.H., Lin Y.Y., Chang H.H. Dengue virus and antiplatelet autoantibodies synergistically induce haemorrhage through Nlrp3-inflammasome and FcγRIII. Thromb. Haemostasis. 2015;113:1060–1070. doi: 10.1160/TH14-07-0637. [DOI] [PubMed] [Google Scholar]
- 30.Liu R., Gu J., Jiang P., Zheng Y., Liu X., Jiang X., Huang E., Xiong S., Xu F., Liu G., et al. DNMT1-microRNA126 epigenetic circuit contributes to esophageal squamous cell carcinoma growth via ADAM9-EGFR-AKT signaling. Clin. Cancer Res. 2015;21:854–863. doi: 10.1158/1078-0432.CCR-14-1740. [DOI] [PubMed] [Google Scholar]
- 31.Takai J., Moriguchi T., Suzuki M., Yu L., Ohneda K., Yamamoto M. The Gata1 5′ region harbors distinct cis-regulatory modules that direct gene activation in erythroid cells and gene inactivation in HSCs. Blood. 2013;122:3450–3460. doi: 10.1182/blood-2013-01-476911. [DOI] [PubMed] [Google Scholar]
- 32.Lahon A., Arya R.P., Banerjea A.C. Dengue virus dysregulates master transcription factors and PI3K/AKT/mTOR signaling pathway in megakaryocytes. Front. Cell. Infect. Microbiol. 2021;11:715208. doi: 10.3389/fcimb.2021.715208. [DOI] [PMC free article] [PubMed] [Google Scholar]
- 33.Muntean A.G., Crispino J.D. Differential requirements for the activation domain and FOG-interaction surface of GATA-1 in megakaryocyte gene expression and development. Blood. 2005;106:1223–1231. doi: 10.1182/blood-2005-02-0551. [DOI] [PMC free article] [PubMed] [Google Scholar]
- 34.Motohashi H., Kimura M., Fujita R., Inoue A., Pan X., Takayama M., Katsuoka F., Aburatani H., Bresnick E.H., Yamamoto M. NF-E2 domination over Nrf2 promotes ROS accumulation and megakaryocytic maturation. Blood. 2010;115:677–686. doi: 10.1182/blood-2009-05-223107. [DOI] [PMC free article] [PubMed] [Google Scholar]
- 35.Kunishima S., Nishimura S., Suzuki H., Imaizumi M., Saito H. TUBB1 mutation disrupting microtubule assembly impairs proplatelet formation and results in congenital macrothrombocytopenia. Eur. J. Haematol. 2014;92:276–282. doi: 10.1111/ejh.12252. [DOI] [PubMed] [Google Scholar]
- 36.Mosoian A. Intracellular and extracellular cytokine-like functions of prothymosin α: implications for the development of immunotherapies. Future Med. Chem. 2011;3:1199–1208. doi: 10.4155/fmc.11.72. [DOI] [PubMed] [Google Scholar]
- 37.Samara P., Karachaliou C.E., Ioannou K., Papaioannou N.E., Voutsas I.F., Zikos C., Pirmettis I., Papadopoulos M., Kalbacher H., Livaniou E., et al. Prothymosin alpha: an alarmin and more. Curr. Med. Chem. 2017;24:1747–1760. doi: 10.2174/0929867324666170518110033. [DOI] [PubMed] [Google Scholar]
- 38.Mosoian A., Teixeira A., High A.A., Christian R.E., Hunt D.F., Shabanowitz J., Liu X., Klotman M. Novel function of prothymosin alpha as a potent inhibitor of human immunodeficiency virus type 1 gene expression in primary macrophages. J. Virol. 2006;80:9200–9206. doi: 10.1128/JVI.00589-06. [DOI] [PMC free article] [PubMed] [Google Scholar]
- 39.Mosoian A., Teixeira A., Burns C.S., Sander L.E., Gusella G.L., He C., Blander J.M., Klotman P., Klotman M.E. Prothymosin-alpha inhibits HIV-1 via Toll-like receptor 4-mediated type I interferon induction. Proc. Natl. Acad. Sci. USA. 2010;107:10178–10183. doi: 10.1073/pnas.0914870107. [DOI] [PMC free article] [PubMed] [Google Scholar]
- 40.Morowski M., Vögtle T., Kraft P., Kleinschnitz C., Stoll G., Nieswandt B. Only severe thrombocytopenia results in bleeding and defective thrombus formation in mice. Blood. 2013;121:4938–4947. doi: 10.1182/blood-2012-10-461459. [DOI] [PubMed] [Google Scholar]
- 41.Goerge T., Ho-Tin-Noe B., Carbo C., Benarafa C., Remold-O'Donnell E., Zhao B.Q., Cifuni S.M., Wagner D.D. Inflammation induces hemorrhage in thrombocytopenia. Blood. 2008;111:4958–4964. doi: 10.1182/blood-2007-11-123620. [DOI] [PMC free article] [PubMed] [Google Scholar]
- 42.Su B.H., Tseng Y.L., Shieh G.S., Chen Y.C., Shiang Y.C., Wu P., Li K.J., Yen T.H., Shiau A.L., Wu C.L. Prothymosin α overexpression contributes to the development of pulmonary emphysema. Nat. Commun. 2013;4:1906. doi: 10.1038/ncomms2906. [DOI] [PMC free article] [PubMed] [Google Scholar]
- 43.Roland I., Minet E., Ernest I., Pascal T., Michel G., Remacle J., Michiels C. Identification of hypoxia-responsive messengers expressed in human microvascular endothelial cells using differential display RT-PCR. Eur. J. Biochem. 2000;267:3567–3574. doi: 10.1046/j.1432-1327.2000.01385.x. [DOI] [PubMed] [Google Scholar]
- 44.de Melo T.C., Trevisan-Silva D., Alvarez-Flores M.P., Gomes R.N., de Souza M.M., Valerio H.P., Oliveira D.S., DeOcesano-Pereira C., Botosso V.F., Calil Jorge S.A., et al. Proteomic analysis identifies molecular players and biological processes specific to SARS-CoV-2 expcosure in endothelial ells. Int. J. Mol. Sci. 2022;23 doi: 10.3390/ijms231810452. [DOI] [PMC free article] [PubMed] [Google Scholar]
- 45.Chen H.C., Hofman F.M., Kung J.T., Lin Y.D., Wu-Hsieh B.A. Both virus and tumor necrosis factor alpha are critical for endothelium damage in a mouse model of dengue virus-induced hemorrhage. J. Virol. 2007;81:5518–5526. doi: 10.1128/JVI.02575-06. [DOI] [PMC free article] [PubMed] [Google Scholar]
- 46.Sun D.S., King C.C., Huang H.S., Shih Y.L., Lee C.C., Tsai W.J., Yu C.C., Chang H.H. Antiplatelet autoantibodies elicited by dengue virus non-structural protein 1 cause thrombocytopenia and mortality in mice. J. Thromb. Haemostasis. 2007;5:2291–2299. doi: 10.1111/j.1538-7836.2007.02754.x. [DOI] [PubMed] [Google Scholar]
- 47.Banerjee A., Tripathi A., Duggal S., Banerjee A., Vrati S. Dengue virus infection impedes megakaryopoiesis in MEG-01 cells where the virus envelope protein interacts with the transcription factor TAL-1. Sci. Rep. 2020;10 doi: 10.1038/s41598-020-76350-5. [DOI] [PMC free article] [PubMed] [Google Scholar]
- 48.Yang G., Wu D., Zeng G., Jiang O., Yuan P., Huang S., Zhu J., Tian J., Weng Y., Rao Z. Correlation between miR-126 expression and DNA hypomethylation of CD4+ T cells in rheumatoid arthritis patients. Int. J. Clin. Exp. Pathol. 2015;8:8929–8936. [PMC free article] [PubMed] [Google Scholar]
- 49.Ding Q., Wang Q., Ren Y., Zhu H., Huang Z. miR-126 promotes the growth and proliferation of leukemia stem cells by targeting DNA methyltransferase 1. Int. J. Clin. Exp. Pathol. 2018;11:3454–3462. [PMC free article] [PubMed] [Google Scholar]
- 50.Wang S., Aurora A.B., Johnson B.A., Qi X., McAnally J., Hill J.A., Richardson J.A., Bassel-Duby R., Olson E.N. The endothelial-specific microRNA miR-126 governs vascular integrity and angiogenesis. Dev. Cell. 2008;15:261–271. doi: 10.1016/j.devcel.2008.07.002. [DOI] [PMC free article] [PubMed] [Google Scholar]
- 51.Meng S., Cao J.T., Zhang B., Zhou Q., Shen C.X., Wang C.Q. Downregulation of microRNA-126 in endothelial progenitor cells from diabetes patients, impairs their functional properties, via target gene Spred-1. J. Mol. Cell. Cardiol. 2012;53:64–72. doi: 10.1016/j.yjmcc.2012.04.003. [DOI] [PubMed] [Google Scholar]
- 52.Wang Y., Wang F., Wu Y., Zuo L., Zhang S., Zhou Q., Wei W., Wang Y., Zhu H. MicroRNA-126 attenuates palmitate-induced apoptosis by targeting TRAF7 in HUVECs. Mol. Cell. Biochem. 2015;399:123–130. doi: 10.1007/s11010-014-2239-4. [DOI] [PubMed] [Google Scholar]
- 53.Vervaeke P., Vermeire K., Liekens S. Endothelial dysfunction in dengue virus pathology. Rev. Med. Virol. 2015;25:50–67. doi: 10.1002/rmv.1818. [DOI] [PubMed] [Google Scholar]
- 54.Orkin S.H., Shivdasani R.A., Fujiwara Y., McDevitt M.A. Transcription factor GATA-1 in megakaryocyte development. Stem Cell. 1998;16:79–83. doi: 10.1002/stem.5530160710. [DOI] [PubMed] [Google Scholar]
- 55.Vyas P., Ault K., Jackson C.W., Orkin S.H., Shivdasani R.A. Consequences of GATA-1 deficiency in megakaryocytes and platelets. Blood. 1999;93:2867–2875. [PubMed] [Google Scholar]
- 56.Migliaccio A.R., Rana R.A., Sanchez M., Lorenzini R., Centurione L., Bianchi L., Vannucchi A.M., Migliaccio G., Orkin S.H. GATA-1 as a regulator of mast cell differentiation revealed by the phenotype of the GATA-1low mouse mutant. J. Exp. Med. 2003;197:281–296. doi: 10.1084/jem.20021149. [DOI] [PMC free article] [PubMed] [Google Scholar]
- 57.Yu C., Cantor A.B., Yang H., Browne C., Wells R.A., Fujiwara Y., Orkin S.H. Targeted deletion of a high-affinity GATA-binding site in the GATA-1 promoter leads to selective loss of the eosinophil lineage in vivo. J. Exp. Med. 2002;195:1387–1395. doi: 10.1084/jem.20020656. [DOI] [PMC free article] [PubMed] [Google Scholar]
- 58.Morceau F., Schnekenburger M., Dicato M., Diederich M. GATA-1: friends, brothers, and coworkers. Ann. N. Y. Acad. Sci. 2004;1030:537–554. doi: 10.1196/annals.1329.064. [DOI] [PubMed] [Google Scholar]
- 59.Burda P., Vargova J., Curik N., Salek C., Papadopoulos G.L., Strouboulis J., Stopka T. GATA-1 Inhibits PU.1 gene via DNA and histone H3K9 methylation of its distal enhancer in erythroleukemia. PLoS One. 2016;11 doi: 10.1371/journal.pone.0152234. [DOI] [PMC free article] [PubMed] [Google Scholar]
- 60.Szabo P., Panneerselvam C., Clinton M., Frangou-Lazaridis M., Weksler D., Whittington E., Macera M.J., Grzeschik K.H., Selvakumar A., Horecker B.L. Prothymosin alpha gene in humans: organization of its promoter region and localization to chromosome 2. Hum. Genet. 1993;90:629–634. doi: 10.1007/BF00202480. [DOI] [PubMed] [Google Scholar]
- 61.Cheng Y.L., Lin Y.S., Chen C.L., Tsai T.T., Tsai C.C., Wu Y.W., Ou Y.D., Chu Y.Y., Wang J.M., Yu C.Y., Lin C.F. Activation of Nrf2 by the dengue virus causes an increase in CLEC5A, which enhances TNF-α production by mononuclear phagocytes. Sci. Rep. 2016;6:32000. doi: 10.1038/srep32000. [DOI] [PMC free article] [PubMed] [Google Scholar]
- 62.Olagnier D., Peri S., Steel C., van Montfoort N., Chiang C., Beljanski V., Slifker M., He Z., Nichols C.N., Lin R., et al. Cellular oxidative stress response controls the antiviral and apoptotic programs in dengue virus-infected dendritic cells. PLoS Pathog. 2014;10 doi: 10.1371/journal.ppat.1004566. [DOI] [PMC free article] [PubMed] [Google Scholar]
- 63.Ferrari M., Zevini A., Palermo E., Muscolini M., Alexandridi M., Etna M.P., Coccia E.M., Fernandez-Sesma A., Coyne C., Zhang D.D., et al. Dengue virus targets Nrf2 for NS2B3-mediated degradation leading to enhanced oxidative stress and viral replication. J. Virol. 2020;94:e01551-20. doi: 10.1128/JVI.01551-20. [DOI] [PMC free article] [PubMed] [Google Scholar]
- 64.Cherupanakkal C., Ramachadrappa V., Kadhiravan T., Parameswaran N., Parija S.C., Pillai A.B., Rajendiran S. Differential expression of NADPH oxidase-2 (Nox-2) and nuclear factor-erythroid 2-related factor 2 (Nrf2) transcripts in peripheral blood mononuclear cells isolated from dengue patients. Virusdisease. 2017;28:54–60. doi: 10.1007/s13337-017-0365-9. [DOI] [PMC free article] [PubMed] [Google Scholar]
- 65.Chang M.Y., Yang Y.S., Tsai M.L., Lee C.H., Chang C.J., Shiau A.L., Wu C.L. Adenovirus-mediated prothymosin α gene transfer inhibits the development of atherosclerosis in ApoE-deficient mice. Int. J. Biol. Sci. 2014;10:358–366. doi: 10.7150/ijbs.8634. [DOI] [PMC free article] [PubMed] [Google Scholar]
- 66.Clark K.B., Hsiao H.M., Bassit L., Crowe J.E., Jr., Schinazi R.F., Perng G.C., Villinger F. Characterization of dengue virus 2 growth in megakaryocyte-erythrocyte progenitor cells. Virology. 2016;493:162–172. doi: 10.1016/j.virol.2016.03.024. [DOI] [PMC free article] [PubMed] [Google Scholar]
- 67.Hsu A.Y., Ho T.C., Lai M.L., Tan S.S., Chen T.Y., Lee M., Chien Y.W., Chen Y.P., Perng G.C. Identification and characterization of permissive cells to dengue virus infection in human hematopoietic stem and progenitor cells. Transfusion. 2019;59:2938–2951. doi: 10.1111/trf.15416. [DOI] [PubMed] [Google Scholar]
- 68.Basu A., Jain P., Gangodkar S.V., Shetty S., Ghosh K. Dengue 2 virus inhibits in vitro megakaryocytic colony formation and induces apoptosis in thrombopoietin-inducible megakaryocytic differentiation from cord blood CD34+ cells. FEMS Immunol. Med. Microbiol. 2008;53:46–51. doi: 10.1111/j.1574-695X.2008.00399.x. [DOI] [PubMed] [Google Scholar]
- 69.Vogt M.B., Lahon A., Arya R.P., Spencer Clinton J.L., Rico-Hesse R. Dengue viruses infect human megakaryocytes, with probable clinical consequences. PLoS Neglected Trop. Dis. 2019;13 doi: 10.1371/journal.pntd.0007837. [DOI] [PMC free article] [PubMed] [Google Scholar]
- 70.Lin G.L., Chang H.H., Lien T.S., Chen P.K., Chan H., Su M.T., Liao C.Y., Sun D.S. Suppressive effect of dengue virus envelope protein domain III on megakaryopoiesis. Virulence. 2017;8:1719–1731. doi: 10.1080/21505594.2017.1343769. [DOI] [PMC free article] [PubMed] [Google Scholar]
- 71.Sukhacheva E.A., Evstafieva A.G., Fateeva T.V., Shakulov V.R., Efimova N.A., Karapetian R.N., Rubtsov Y.P., Vartapetian A.B. Sensing prothymosin alpha origin, mutations and conformation with monoclonal antibodies. J. Immunol. Methods. 2002;266:185–196. doi: 10.1016/s0022-1759(02)00098-4. [DOI] [PubMed] [Google Scholar]
- 72.Li K.J., Shiau A.L., Chiou Y.Y., Yo Y.T., Wu C.L. Transgenic overexpression of prothymosin alpha induces development of polycystic kidney disease. Kidney Int. 2005;67:1710–1722. doi: 10.1111/j.1523-1755.2005.00268.x. [DOI] [PubMed] [Google Scholar]
- 73.Su Y.C., Ou H.Y., Wu H.T., Wu P., Chen Y.C., Su B.H., Shiau A.L., Chang C.J., Wu C.L. Prothymosin-α overexpression contributes to the development of insulin resistance. J. Clin. Endocrinol. Metab. 2015;100:4114–4123. doi: 10.1210/jc.2015-2277. [DOI] [PubMed] [Google Scholar]
- 74.Liu K.T., Liu Y.H., Chen Y.H., Lin C.Y., Huang C.H., Yen M.C., Kuo P.L. Serum galectin-9 and galectin-3-binding protein in acute dengue virus infection. Int. J. Mol. Sci. 2016;17:832. doi: 10.3390/ijms17060832. [DOI] [PMC free article] [PubMed] [Google Scholar]
- 75.Elcheva I., Brok-Volchanskaya V., Kumar A., Liu P., Lee J.H., Tong L., Vodyanik M., Swanson S., Stewart R., Kyba M., et al. Direct induction of haematoendothelial programs in human pluripotent stem cells by transcriptional regulators. Nat. Commun. 2014;5:4372. doi: 10.1038/ncomms5372. [DOI] [PMC free article] [PubMed] [Google Scholar]
- 76.Koushik S.V., Chen H., Thaler C., Puhl H.L., 3rd, Vogel S.S. Cerulean, Venus, and VenusY67C FRET reference standards. Biophys. J. 2006;91 doi: 10.1529/biophysj.106.096206. L99-l101. [DOI] [PMC free article] [PubMed] [Google Scholar]
- 77.Chen Y.C., Su Y.C., Shieh G.S., Su B.H., Su W.C., Huang P.H., Jiang S.T., Shiau A.L., Wu C.L. Prothymosin α promotes STAT3 acetylation to induce cystogenesis in Pkd1-deficient mice. Faseb. J. 2019;33:13051–13061. doi: 10.1096/fj.201900504R. [DOI] [PMC free article] [PubMed] [Google Scholar]
- 78.Rico-Hesse R. Molecular evolution and distribution of dengue viruses type 1 and 2 in nature. Virology. 1990;174:479–493. doi: 10.1016/0042-6822(90)90102-w. [DOI] [PubMed] [Google Scholar]
- 79.Shresta S., Kyle J.L., Robert Beatty P., Harris E. Early activation of natural killer and B cells in response to primary dengue virus infection in A/J mice. Virology. 2004;319:262–273. doi: 10.1016/j.virol.2003.09.048. [DOI] [PubMed] [Google Scholar]
- 80.Chao C.H., Wu W.C., Lai Y.C., Tsai P.J., Perng G.C., Lin Y.S., Yeh T.M. Dengue virus nonstructural protein 1 activates platelets via Toll-like receptor 4, leading to thrombocytopenia and hemorrhage. PLoS Pathog. 2019;15 doi: 10.1371/journal.ppat.1007625. [DOI] [PMC free article] [PubMed] [Google Scholar]
- 81.Tsai H.J., Huang C.L., Chang Y.W., Huang D.Y., Lin C.C., Cooper J.A., Cheng J.C., Tseng C.P. Disabled-2 is required for efficient hemostasis and platelet activation by thrombin in mice. Arterioscler. Thromb. Vasc. Biol. 2014;34:2404–2412. doi: 10.1161/ATVBAHA.114.302602. [DOI] [PMC free article] [PubMed] [Google Scholar]
- 82.Schweinfurth N., Hohmann S., Deuschle M., Lederbogen F., Schloss P. Valproic acid and all trans retinoic acid differentially induce megakaryopoiesis and platelet-like particle formation from the megakaryoblastic cell line MEG-01. Platelets. 2010;21:648–657. doi: 10.3109/09537104.2010.513748. [DOI] [PubMed] [Google Scholar]
- 83.Chen P.K., Chang H.H., Lin G.L., Wang T.P., Lai Y.L., Lin T.K., Hsieh M.C., Kau J.H., Huang H.H., Hsu H.L., et al. Suppressive effects of anthrax lethal toxin on megakaryopoiesis. PLoS One. 2013;8 doi: 10.1371/journal.pone.0059512. [DOI] [PMC free article] [PubMed] [Google Scholar]
- 84.Jou Y.C., Tsai Y.S., Hsieh H.Y., Chen S.Y., Tsai H.T., Chen K.J., Wang S.T., Shiau A.L., Wu C.L., Tzai T.S. Plasma thymosin-α1 level as a potential biomarker in urothelial and renal cell carcinoma. Urol. Oncol. 2013;31:1806–1811. doi: 10.1016/j.urolonc.2012.03.011. [DOI] [PubMed] [Google Scholar]
- 85.Al-Salihi M., Yu M., Burnett D.M., Alexander A., Samlowski W.E., Fitzpatrick F.A. The depletion of DNA methyltransferase-1 and the epigenetic effects of 5-aza-2′deoxycytidine (decitabine) are differentially regulated by cell cycle progression. Epigenetics. 2011;6:1021–1028. doi: 10.4161/epi.6.8.16064. [DOI] [PMC free article] [PubMed] [Google Scholar]
Associated Data
This section collects any data citations, data availability statements, or supplementary materials included in this article.
Supplementary Materials
Data Availability Statement
-
•
All data reported in this paper will be shared by the corresponding authors upon request.
-
•
This paper analyzes existing, publicly available data. The accession number for the dataset is listed in the key resources table.
-
•
Any additional information required to reanalyze the data reported in this paper is available from the lead contact upon request.