

Summary
Reactive aldehydes are abundant endogenous metabolites that challenge homeostasis by crosslinking cellular macromolecules. Aldehyde-induced DNA damage requires repair to prevent cancer and premature aging, but it is unknown whether cells also possess mechanisms that resolve aldehyde-induced RNA lesions. Here, we establish photoactivatable ribonucleoside-enhanced crosslinking (PAR-CL) as a model system to study RNA crosslinking damage in the absence of confounding DNA damage in human cells. We find that such RNA damage causes translation stress by stalling elongating ribosomes, which leads to collisions with trailing ribosomes and activation of multiple stress response pathways. Moreover, we discovered a translation-coupled quality control mechanism that resolves covalent RNA-protein crosslinks. Collisions between translating ribosomes and crosslinked mRNA-binding proteins trigger their modification with atypical K6- and K48-linked ubiquitin chains. Ubiquitylation requires the E3 ligase RNF14 and leads to proteasomal degradation of the protein adduct. Our findings identify RNA lesion-induced translational stress as a central component of crosslinking damage.
Keywords: RNA damage, RNA-protein crosslinks, atypical ubiquitylation, ribosome, formaldehyde, RNF14, GCN1, K6-linked ubiquitin chains, translation, RNF25
Graphical abstract
Highlights
-
•
Photoactivatable ribonucleoside-enhanced crosslinking is used to study RNA damage
-
•
RNA crosslinking damage triggers translation stress
-
•
Crosslinks between proteins and mRNAs are resolved in a translation-coupled manner
-
•
Resolution requires atypical ubiquitylation of the protein adduct by RNF14
Zhao et al. show that reactive aldehydes cause RNA crosslinking damage and identify a quality control pathway that resolves RNA-protein crosslinks in a translation-coupled manner. This study highlights RNA crosslinking damage as a central component of aldehyde-induced stress.
Introduction
Cells are constantly exposed to various reactive agents that challenge homeostasis by inducing complex damage to cellular macromolecules. Such damage is caused by endogenous reactive metabolites1 and diverse exogenous agents, ranging from various types of radiation2 to environmental toxins.3,4 Importantly, almost all reactive agents act pleiotropically, i.e., they induce diverse cellular lesions, including DNA, RNA, and protein damage.5,6 The complexity of the damage complicates the mechanistic analysis of pathways that detect and resolve specific types of lesions. Therefore, it is often difficult to determine which individual components of complex damage are responsible for specific cellular outcomes.
A particular relevant source of endogenous damage are reactive aldehydes that are produced in cells by diverse metabolic processes7 and that arise in substantial quantities despite being highly toxic and carcinogenic.8,9,10 Acetaldehyde is produced from ethanol in the liver, which is the primary reason for the toxicity of alcohol consumption,11 whereas formaldehyde (FA) is continuously generated in cells as a byproduct of various demethylation reactions and one-carbon metabolism.7,12,13 As a result, FA can reach substantial concentrations in human blood (12–87 μM14,15). Even higher FA concentrations of over 300 μM have been detected in urine and brain samples of patients with Alzheimer disease.16,17 FA is detoxified by ADH5 and ALDH2, dehydrogenases that are defective in individuals with aldehyde degradation deficiency syndrome, leading to bone marrow failure and leukemia.18,19 This first tier of protection against aldehydes by metabolic detoxification is complemented by a second tier provided by DNA repair mechanisms.7 Aldehydes lead to DNA inter-strand crosslinks that stall advancing replication forks and are resolved by multiple repair pathways.20,21 Aldehydes also induce pervasive DNA-protein crosslinks (DPCs) that need to be degraded by the proteasome and the specialized DPC protease SPRTN to maintain genome stability.22,23,24,25 Notably, proteolytic DPC repair prevents premature aging and hepatocellular carcinomas and is essential for cellular viability in mammalian cells,26,27 indicating that endogenous crosslinking levels are sufficiently high to be life-threatening. Owing to its predominantly single-stranded nature and lack of protection through chromatinization, RNA is expected to be especially vulnerable when cells are exposed to crosslinking agents. Indeed, FA efficiently crosslinks proteins to RNA; such RNA-protein crosslinks (RPCs) have been used to study RNA-protein interactions.28,29 However, it is unknown whether RNA damage, including RPCs, is a significant component of crosslinking stress. One of the challenges in studying the specific consequences of RNA damage is that most reactive agents also damage DNA.5
Lesions within mRNAs can cause translating ribosomes to stall, leading to collisions with trailing ribosomes and the induction of diverse stress signals.30,31 Collided ribosomes are sensed by the MAP3 kinase ZAKα, which triggers the ribotoxic stress response (RSR) by activating the stress-activated protein kinases p38 and JNK.31,32,33 RSR activation typically coincides with GCN2-dependent activation of the integrated stress response (ISR),31 shutting down global translation through phosphorylation of the translation initiation factor eIF2α.34 Under these conditions, a subset of mRNAs (e.g., those belonging to stress-responsive transcription factors) is preferentially translated to turn on gene expression programs that enable cells to restore translational homeostasis.34 In addition to RSR and ISR activation, ribosome collisions trigger activation of ribosome-associated quality control (RQC) pathways to maintain proteostasis by recycling ribosomal subunits and degrading incomplete nascent polypeptide chains.5,35 While RQC is highly effective in rescuing ribosomes stalled by translation elongation inhibitors, ribosomes stalled at bulky RNA lesions tend to be refractory to splitting and can thus be long-lived.32 RQC is initiated in mammalian cells by ubiquitylation of the small ribosomal subunit proteins eS10 and uS10 by the ZNF598 E3 ligase (Hel2 in yeast), which specifically recognizes an interface formed by two collided ribosomes.36,37,38 In addition, two other E3 ligases, RNF25 and RNF14, have recently been shown to be activated when small molecule inhibitors block release of translation factors from the ribosomal A site.39,40 RNF25 ubiquitylates the ribosomal subunit eS31, which promotes RNF14-dependent poly-ubiquitylation of the entrapped translation factor, resulting in its proteasomal degradation.39 However, physiological substrates of the RNF14/RNF25 pathway remain unclear.
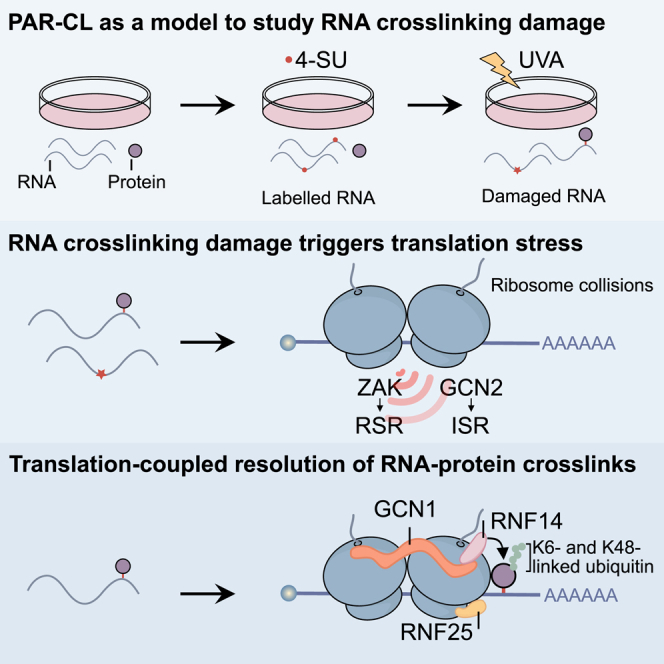
Here, we repurposed a photoactivatable ribonucleoside-enhanced crosslinking (PAR-CL41) strategy to study the specific cellular consequences of RNA crosslinking damage. We establish that PAR-CL mimics FA-induced RNA damage in the absence of DPCs. Using this system, we not only revealed that RNA crosslinking damage causes translation stress by stalling elongating ribosomes, but we also discovered a translation-coupled mechanism for the resolution of crosslinks between proteins and mRNAs (mRPCs). We demonstrate that collisions between elongating ribosomes and mRPCs trigger ubiquitylation of the covalent protein adduct with atypical K6- and K48-linked chains by the RNF14 E3 ligase, leading to subsequent proteasomal degradation. Collectively, these data highlight RNA crosslinking damage as a key component of aldehyde stress and as a relevant physiological substrate of ribosomal stress surveillance.
Results
PAR-CL recapitulates FA-induced RPC formation
PAR-CL was developed to probe RNA-protein interactions and involves the metabolic labeling of cellular RNA with the photoactivatable uridine analog 4-thiouridine (4-SU), after which crosslinking is induced by UVA irradiation (365 nm) (Figure 1A, left; Hafner et al.41 and Castello et al.42). We hypothesized that PAR-CL can be used to mimic aldehyde-induced RNA crosslinking damage in the absence of DNA damage because 4-SU is incorporated specifically into RNA. UVA irradiation of cells labeled for 16 h with 4-SU resulted in dose-dependent toxicity in HAP1, HeLa T-REx Flp-In, and HCT116 cells, while either treatment alone did not markedly affect viability (Figures 1B, 1C, and S1A–S1D). Next, we exposed cells to doses of PAR-CL (5 μM 4-SU + 6 kJ/m2 UVA) or FA (0.5 mM, 1 h) that affected viability to a similar degree (Figures 1C and S1E). Crosslinked RNA and protein were then purified using the protein-x-linked RNA extraction (XRNAX) protocol (Figure 1D; Trendel et al.43). We observed that both treatments induced RPCs to a similar degree (Figure 1D). In contrast to FA, however, PAR-CL did not result in detectable levels of DPC formation in the KCl-SDS precipitation assay (Figures 1E and S1F). To compare the identity of PAR-CL- and FA-induced RPCs, we combined XRNAX with label-free quantitative mass spectrometry. FA induced crosslinking of 719 proteins to RNA, the majority of which (561) were also crosslinked by PAR-CL (Figures 1F and 1G; Table S1). Crosslinks were primarily formed by RNA-binding proteins and structural constituents of the ribosome (Figure S1G). FA-induced RPCs not captured by PAR-CL (158) were generally in low abundance (Figure 1H). We conclude that PAR-CL mimics FA-induced RPC formation in the absence of DPCs and thus represents a clean model system that allows for the analysis of this aspect of aldehyde stress.
Figure 1.

Photoactivatable-ribonucleoside-enhanced crosslinking (PAR-CL) recapitulates formaldehyde-induced RNA-protein crosslink formation
(A) Schematic depiction of RNA-protein crosslink (RPC) induction. Cellular RNAs are labeled with the photoactivatable ribonucleoside 4-thiouridine (4-SU) and crosslinked by UVA irradiation.
(B and C) Colony formation assay (B) and cell viability measurement (C) of HAP1 cells after treatment with indicated doses of 4-SU and UVA. Values in (C) represent the mean ± SD of three biological replicates normalized to the mean of corresponding control of each replicate.
(D) PAR-CL (4-SU + UVA) and formaldehyde-induced RPCs analyzed by XRNAX. Left: schematic depiction of RPC purification by XRNAX. Right: RPC purification by XRNAX in HAP1 cells treated with 4-SU (5 μM, 16 h, estimated to result in replacement of 0.125% of uridines by 4-SU, based on previous work41), UVA (6 kJ/m2), or 0.5 mM formaldehyde (FA) for 1 h, as indicated. Purified RPCs were digested with Proteinase K or RNase A prior to running on an agarose gel (RNA) and SDS-PAGE gel (protein), respectively. Asterisk indicates RNase A.
(E) DNA-protein-crosslink formation quantified by KCl-SDS precipitation assay. Left: schematic depiction of DNA-protein-crosslink quantification by KCl-SDS assay. Right: KCl-SDS assays of HAP1 cells treated as in (D). Crosslinked DNA was measured using Qubit DNA HS assay. Values represent the mean ± SD of the fold change of crosslinked DNA of three technical replicates normalized to the mean of untreated controls.
(F) Heatmap of XRNAX-derived proteins crosslinked to RNA from HAP1 cells treated as in (D). Proteins identified in XRNAX samples, sorted by decreasing log2 intensity in 4-SU + UVA samples. Values represent the mean of the log2 intensity of three biological replicates from untreated (Ctrl) cells or cells treated with 0.5 mM formaldehyde (FA) for 1 h or cells treated with 4-SU (5 μM, 16 h) and UVA (6 kJ/m2) (4-SU + UVA).
(G and H) Venn diagram (G) and density plot (H) for XRNAX-derived proteins crosslinked to RNA. Venn diagram: numbers indicate proteins identified in different treatments, formaldehyde (FA, orange) or PAR-CL (4-SU + UVA, blue) or both (4-SU + UVA ∩ FA, purple). Density plot shows the probability distribution of log2 intensities for proteins crosslinked to RNA in formaldehyde (FA, orange) or formaldehyde and PAR-CL (4-SU + UVA ∩ FA, purple).
PAR-CL and FA induce ZAKα- and GCN2-dependent stress responses
To understand how RNA crosslinking damage affects cellular physiology, we monitored PAR-CL-induced signaling responses in HAP1 cells by quantitative phosphoproteomics using TMT-based multiplexing (Figures 2A and 2B; Tables S2 and S3). Kinase-substrate enrichment analysis of significantly altered phospho-sites implicated the p38 and JNK kinases as well as their corresponding upstream MAP2 kinases (Figure S2A; Table S4). The observed signatures were reminiscent of ZAKα-dependent activation of p38 and JNK as part of the RSR.31,33 Indeed, in ZAK knockout (KO) cells, the majority of PAR-CL-induced phospho-site changes were abrogated (Figure 2B). We confirmed p38 activation in HAP1, HeLa T-REx Flp-In, and HCT116 cells using antibodies specific for phosphorylated p38 (p-p38), using an intermediate dose of the translation elongation inhibitor anisomycin (ANS) as positive control (Figures 2C, S2B, and S2C). Phosphorylation of p38 was lost in ZAK KO cells and restored upon re-expression of ZAKαWT but not catalytically inactive ZAKαK45A (Figures 2C, S2B, and S2C). Activation of the RSR is often accompanied by activation of the ISR through phosphorylation of eIF2α by GCN2.31 In agreement, we detected phosphorylated eIF2α (p-eIF2α) upon PAR-CL treatment; this phosphorylation was lost in GCN2 KO cells and restored upon re-expression of GCN2WT but not catalytically inactive GCN2D848N (Figures 2C, S2D, and S2E).
Figure 2.

PAR-CL and formaldehyde induce ZAKα- and GCN2-dependent stress responses
(A) Volcano plot indicating differentially modified phospho-sites 0.5 h after treatment with PAR-CL (4-SU [5 μM, 16 h] + UVA [6 kJ/m2]) in HAP1 cells. Statistically significantly changed sites (adj. p ≤ 0.01, −1 ≥ log2 fold change ≥ 1) are highlighted in red for increased and blue for decreased phospho-sites. Top 10 hits for increased and decreased phospho-sites are highlighted in orange and dark blue, respectively.
(B) Heatmap depicting Z scored intensities for significantly affected phospho-sites in AAVS1 control and ZAK KO HAP1 cells treated as in (A).
(C) Representative western blot analysis of clonal HAP1 ZAK KO, GCN2 KO, and matched AAVS1 control cells treated with 4-SU (5 μM, 16 h), UVA (6 kJ/m2), or anisomycin (ANS, 1 μM, 0.5 h), as indicated. Asterisk indicates unspecific band.
(D and E) Representative western blot analysis of HAP1 cells treated with 4-SU (5 μM, 16 h) followed by harringtonine (HAR, 2 μg/mL, 0.5 h) prior to irradiation with UVA (6 kJ/m2) and anisomycin (ANS, 1 μM, 0.5 h) (D) or anisomycin treatment (ANS, 375 μM, 0.5 h) prior to irradiation with UVA (6 kJ/m2) (E), as indicated. Asterisk indicates unspecific band.
(F and G) Representative western blot analysis of clonal HAP1 ZAK KO (F) and GCN2 KO (G) cells and matched AAVS1 control cells treated with increasing doses of 4-SU (0.04, 0.2, 1, and 5 μM, 16 h), followed by UVA irradiation (6 kJ/m2) or increasing doses of formaldehyde (FA, 100, 200, 500, and 1,000 μM, 1 h). Asterisk indicates unspecific band.
(H) Representative western blot analysis of HAP1 cells treated with 4-SU (5 μM, 16 h) followed by harringtonine (HAR, 2 μg/mL, 0.5 h) pre-treatment prior to irradiation with UVA (6 kJ/m2) or treatment with increasing doses of formaldehyde (FA, 100, 200, 500, and 1,000 μM, 1 h), as indicated. Asterisk indicates unspecific band.
Given that ZAKα and GCN2 are known to be activated by ribosome stalling31,32,33 and subsequent collisions with trailing ribosomes,31 we asked next whether their activation by PAR-CL also originates at ribosomes. We pre-treated cells with either harringtonine (HAR), which depletes translating ribosomes from mRNAs by trapping ribosomes at sites of translation initiation, allowing other ribosomes to run off, or with a high dose of ANS, which globally stalls ribosomes on mRNA, before inducing RPCs. We observed that HAR suppressed phosphorylation of eIF2α and p38 (Figures 2D and S2F). A high dose of ANS blocked eIF2α phosphorylation while itself inducing p38-phosphorylation, which was not further increased by PAR-CL (Figures 2E and S2G). Consistent with PAR-CL mimicking key features of aldehyde-induced RNA crosslinking damage, FA also induced p38 and eIF2α phosphorylation, which was largely dependent on ZAK and GCN2, respectively (Figures 2F, 2G, S2H, and S2I), and suppressed by HAR pre-treatment (Figures 2H and S2J).
Taken together, these results suggest that the pleiotropically acting agent FA induces RNA damage that activates the RSR and ISR primarily through a ZAKα- and GCN2-dependent response that is recapitulated by PAR-CL and originating at the ribosome.
PAR-CL induces translational stress and ribosome collisions
Intrigued by the requirement for actively translating ribosomes to generate signaling events in response to PAR-CL, we next explored its effects on translation. First, we monitored protein synthesis levels by measuring incorporation of O-propargyl-puromycin (OPP) into nascent peptide chains44 and observed a dose-dependent shutdown of translation upon PAR-CL treatment (Figures 3A and S3A). Second, we monitored ribosome populations using sucrose gradients and found that polysomes collapsed to monosomes within 30 min after crosslinking (Figure 3B).
Figure 3.

PAR-CL induces translation stress and ribosome collisions
(A) Relative levels of O-propargyl-puromycin (OPP) incorporation measured by flow cytometry to determine protein synthesis rate in HAP1 cells, following treatment with indicated doses of 4-SU (16 h) followed by UVA irradiation (6 kJ/m2). Values represent fluorescence intensities of live, single cells normalized to the mean of untreated controls. Error bars represent SD.
(B) Polysome profiles of HAP1 cells treated with 4-SU (5 μM, 16 h) and UVA (6 kJ/m2), as indicated. Cells were harvested 0 or 0.5 h after irradiation. Lysates were fractionated over 10%–50% sucrose gradients, followed by UV(A260) absorbance measurement.
(C) Ribosome profiles of HAP1 cells treated with 4-SU (5 μM, 18 h) and UVA (6 kJ/m2) harvested 0.5 h after irradiation. Meta-gene analysis of ribosome footprints shows average ribosome density across ORFs in indicated conditions, compared with control. Average ribosome density represents mean of three replicates.
(D) Frequency of T-C conversion in the sequencing of 30-mer (left) or >58-mer (right) ribosome footprints from HAP1 cells treated with 4-SU (5 μM, 18 h) and UVA (6 kJ/m²), compared with controls. Values represent the mean ± SD of three replicates.
(E) Representative T-C conversion distribution across positions in 30-mer (left) or >58-mer (right) ribosome footprints from HAP1 cells treated with 4-SU (5 μM, 18 h) and UVA (6 kJ/m²), compared with controls.
(F) Representative western blot analysis of clonal HAP1 ZNF598 KO cells and matched AAVS1 control cells treated with 4-SU (5 μM, 16 h), UVA (6 kJ/m2), or anisomycin (ANS, 1 μM, 0.5 h), as indicated.
(G) O-propargyl-puromycin (OPP) incorporation analyzed by flow cytometry in HAP1 cells treated with 4-SU (5 μM, 16 h) and UVA (6 kJ/m2) at different time points after irradiation. Values represent fluorescence intensities of live, single cells normalized to the mean of controls. Error bars represent SD.
To better understand how PAR-CL induces these clear signs of translational stress, we determined ribosome densities across open reading frames (ORFs) using ribosome profiling. In PAR-CL-treated cells (but not upon treatment with either 4-SU or UVA alone), ribosome-protected fragments (RPFs) were enriched in the 5′ region of ORFs, while the density dropped off downstream (Figure 3C). This pattern of ribosome density loss is consistent with roadblocks that stall elongating ribosomes.
To understand whether ribosome stalling within ORFs was related to the formation of crosslinking damage, we searched for T-C conversions within RPFs. When reverse transcriptase encounters a PAR-CL-induced crosslink, it often misreads the modified U as a C, leading to T-C conversions in the final reads.29,41 As expected, the frequency of T-C conversions in the standard monosome RPFs (30 nt) was higher in the PAR-CL-treated sample, compared with the other treatments (Figure 3D, left). This was also true for RPFs corresponding to collided disomes (>58 nt) (Figure 3D, right). Although there was also an increase in the sample treated with 4-SU alone, consistent with the tendency of reverse transcriptase to sometimes misread even unreacted 4-SU, the PAR-CL samples showed the highest conversion rates (Figure 3D). As a negative control, we counted the opposite conversion (C-T) in 30-mer RPFs and found that they occurred at similar rates in all conditions, as expected (Figure S3B). The position of the T-C conversions within the RPFs sheds light on the ribosome stalling that we observed. In samples treated with 4-SU alone, the T-C conversions were randomly distributed across the 30-mer footprints, but upon PAR-CL treatment, the conversions were specifically enriched around position 18 in the 30-mer (Figure 3E, left). This position corresponds to the A site of the ribosome, where T-C conversions may arise from crosslinks that block decoding. Intriguingly, T-C conversions at this position were less abundant when cells were harvested directly after irradiation (Figure S3C), indicating that stalled ribosomes accumulate over time at PAR-CL-induced lesions.
While it is likely that PAR-CL-induced crosslinks are also present in front of stalled ribosomes, leading to translational arrest, these lesions are probably invisible to our analysis because the associated T-C conversions occur outside the RPFs. Taken together, these data are consistent with a model wherein PAR-CL treatment triggers translation stress by blocking the progression of ribosomes.
In addition, we analyzed T-C conversion frequency in the longer RPFs (more than 58 nt) corresponding to the footprint of two adjacent ribosomes and observed a peak of conversions at position 48 in PAR-CL-treated cells (Figure 3E, right) corresponding to the A site of the leading ribosome in the disome. Again, this suggests that ribosome stalling at crosslinks results in collisions with trailing ribosomes. This interpretation is in line with our observation that PAR-CL induces ZAKα-dependent RSR and GCN2-dependent ISR activation, both of which are linked to ribosome collisions,31 and with the increase in the level of RNase-resistant disomes after treatment with PAR-CL (Figure S3D).
Ribosome collisions also trigger RQC mechanisms by ZNF598-dependent ubiquitylation of ribosomal proteins, resulting in the splitting of stalled ribosomes, degradation of nascent polypeptide chains, and recycling of ribosomal subunits.5,35,36,37,38 As expected, we observed ZNF598-dependent monoubiquitylation of eS10 upon PAR-CL treatment (Figures 3F, S3E, and S3F) or upon addition of an intermediate dose of ANS as a positive control. In addition, anti-ubiquitin antibodies revealed ZNF598-dependent accumulation of multiple additional ubiquitylation events (Figures S3E and S3F), as was previously noted in yeast upon RQC activation.45 The loss of ubiquitylation in ZNF598 KO cells was rescued by re-expression of ZNF598WT but not catalytically inactive ZNF598C29A (Figures S3E and S3F). Notably, we did not observe any discernible interdependencies between RQC, RSR, and ISR under the conditions tested here; ZNF598-dependent ubiquitylation events were not affected by loss of ZAK or GCN2, p38-phosphorylation was not affected by loss of ZNF598 or GCN2, and eIF2α-phosphorylation was not affected by loss of ZAK or ZNF598 (Figures S3G and S3H). Thus, although RQC pathways are activated, they appear insufficient to prevent activation of ISR and RSR under our conditions, in line with previous observations indicating that ribosomes stalled at bulky RNA lesions are long-lived and refractory to splitting.32 Importantly however, cells did recover from the shutdown of protein synthesis caused by an intermediate dose of PAR-CL over the course of 6 h (Figures 3G and S3I), indicating the resolution of the damage.
Collectively, our data thus demonstrate that RNA crosslinking damage triggers ribosome stalling and collisions and activates ribosomal stress surveillance mechanisms, but cells can recover eventually.
Degradation of mRPCs is induced by atypical K6- and K48-linked ubiquitin chains
To understand how cells recover from crosslinking-induced translation stress, we focused on the resolution of crosslinks between proteins and poly-adenylated mRNAs (mRPCs). We monitored the fate of mRPCs using denaturing polyA-pull-downs (polyA-PDs) (Figure 4A; Castello et al.46 and Perez-Perri et al.47), which require significantly less material than RPC purification by XRNAX and can thus be used to test various experimental conditions. As expected, PAR-CL, but not 4-SU or UVA alone, triggered co-precipitation of crosslinked proteins in polyA-PD samples (Figure 4B). Using quantitative label-free mass spectrometry, we identified 99 proteins crosslinked to mRNA (Figure 4C; Table S5). We detected three small ribosomal subunit proteins (RPS2/uS5, RPS3/uS3, and RPS3A/eS1) in polyA-PD samples upon PAR-CL treatment, which are all positioned near the mRNA channel, explaining why they are prone to crosslinking to mRNA (Figure 4E). However, these crosslinks were in low abundance, compared with RPCs formed by the mRNA-binding proteins YBX1 and YBX348 and the mRNA-associated protein SND149 (Figure 4C), which formed in a dose-dependent manner, as confirmed by western blotting of polyA-PDs (Figure 4D).
Figure 4.

PAR-CL-induced formation of mRNA-protein crosslinks
(A) Schematic depiction of mRPC purification by polyA-pull-down. Cells are lysed under denaturing conditions followed by addition of oligo(dT)-conjugated magnetic beads. Crosslinked proteins are eluted by RNA digestion.
(B) HAP1 cells were treated with 4-SU (5 μM, 16 h) and UVA (6 kJ/m2), as indicated, followed by polyA-pull-down under denaturing conditions. Crosslinked proteins were visualized by SDS-PAGE followed by SYPRO Ruby staining. Contrast of image was adjusted globally for better visibility.
(C) HAP1 cells were treated as indicated in (B), and mRPCs were isolated using polyA-pull-down. The identity of mRPCs was determined by mass spectrometry. Heatmap depicting abundance of mRPCs sorted by average log2 intensity in 4-SU + UVA samples.
(D) Representative western blot analysis of mRPCs isolated by polyA-pull-down from HAP1 cells treated with increasing doses of 4-SU (1.25, 2.5, and 5 μM, 16 h) and UVA (6 kJ/m²).
(E) mRNA exit and entry channel view of the structure of the human 80S ribosome, with ribosomal subunits RPS2/uS5 (green), RPS3/uS3 (purple), and RPS3A/eS1 (blue) and mRNA exit and entry indicated.
To determine how mRPCs are resolved, we treated cells with a sublethal dose of PAR-CL (2.5 μM 4-SU + 6 kJ/m2 UVA) and determined the abundance of crosslinked proteins either immediately after crosslinking or 1 h later by analyzing polyA-PD samples by mass spectrometry. We found that 1 h after irradiation, several mRPCs, including those formed by YBX1, YBX3, SND1, and the RNA-binding and ribosome-associated protein HDLBP50 decreased in abundance (Figure 5A; Table S6), indicative of their resolution. Strikingly, we observed a strong concurrent increase in ubiquitin (UBB) in polyA-PD samples, (Figures 5A left, 5B, and 5C). These results suggest that proteins crosslinked to mRNAs may undergo covalent modification with ubiquitin.
Figure 5.

Degradation of mRNA-protein crosslinks is induced by atypical K6- and K48-linked ubiquitin chains
(A–C) Volcano plot (A) comparing mRPCs isolated by polyA-pull-down from HAP1 cells treated with 4-SU (2.5 μM, 16 h) and ubiquitin E1 inhibitor (Ub-E1i, TAK-243, 1 μM, 1 h), as indicated, prior to irradiation with UVA (6 kJ/m2) at 1 vs. 0 h after irradiation. Bar graphs depicting normalized label-free quantification (LFQ) intensities (B) and representative western blot analysis (C) showing indicated time points of recovery of mRPCs isolated by polyA-pull-down from HAP1 cells treated as in (A). Statistically significantly changed proteins (adj. p ≤ 0.01, −0.5 ≥ log2 fold change ≥ 0.5) are highlighted in red (A). Bar graphs depict mean ± SD of four biological replicates and FDR-adj. p value of 0 vs. 1 h (B).
(D–F) Volcano plot (D) comparing mRPCs isolated by polyA-pull-down from HAP1 cells treated with 4-SU (2.5 μM, 16 h) and proteasome inhibitor (MG132, 5 μM, 1 h), as indicated, prior to irradiation with UVA (6 kJ/m2) at 1 vs. 0 h after irradiation. Bar graphs depicting normalized label-free quantification (LFQ) intensities (E) and representative western blot analysis (F) showing indicated time points of recovery of mRPCs isolated by polyA-pull-down from HAP1 cells treated as in (D). Statistically significantly changed proteins (adj. p ≤ 0.01, −0.5 ≥ log2 fold change ≥ 0.5) in (D) are highlighted in red. Bar graphs depict mean ± SD of four biological replicates and FDR-adj. p value of 0 vs. 1 h (E).
Next, we asked whether mRPC ubiquitylation is linked to their resolution. We induced mRPCs by PAR-CL and monitored their fate in cells treated with a specific inhibitor for ubiquitin-activating enzyme 1 (Ub-E1i, TAK-243). PolyA-PDs followed by mass spectrometry confirmed that Ub-E1i fully blocked mRPC ubiquitylation (Figures 5A–5C; Table S6). In addition, resolution of mRPCs formed by SND1 and HDLBP was inhibited, indicating that these crosslinks are removed in a ubiquitin-dependent manner (Figures 5A–5C; we failed to detect HDLBP-mRPCs by western blot because of their low abundance). In contrast, resolution of mRPCs formed by YBX1 or YBX3 was not affected (Figures 5A–5C and S4A).
Given that poly-ubiquitylation is a potent signal to trigger protein degradation by the proteasome,51 we asked whether the ubiquitin-dependent turnover of mRPCs was dependent on proteasome activity. Indeed, proteasome inhibition (using pre-treatment with MG132) abolished resolution of mRPCs formed by SND1 and HDLBP (Figures 5D and 5E; Table S7). Of note, we observed decreased accumulation of ubiquitin in polyA-PD samples upon pre-treatment with proteasome inhibitors, probably due to sequestration of free ubiquitin in poly-ubiquitin chains prior to induction of RPCs (Figures 5E and 5F). Nonetheless, slower migrating SND1 species appeared in western blots of polyA-PD samples upon proteasome inhibition with MG132 or bortezomib, likely representing accumulating poly-ubiquitylated SND1 mRPCs (Figures 5F and S4B). In line with their resolution being ubiquitin independent, YBX1 and YBX3 crosslinks were not affected by proteasome inhibition (Figures 5D–5F and S4C). Inhibition of autophagy using bafilomycin A1 (BAF A1) had no effect on mRPC resolution or on the accumulation of slower-migrating mRPC species, indicating that the second major cellular protein degradation system51 does not affect mRPC resolution (Figure S4D).
To understand whether specific types of ubiquitin chains are involved in the resolution of mRPCs, we analyzed the abundance of different ubiquitin linkages in our mass spectrometry data. We detected K6- and K48-linkages in all replicates of polyA-PD samples 30 and 60 min after PAR-CL treatment (Figure S4E); K33 and K11 linkages were also identified but not in all replicates and not in every polyA-PD experiment described below. To confirm this observation, we monitored ubiquitylation in polyA-PD samples using western blotting with chain-specific antibodies. No ubiquitylation was detected in the absence of crosslinking, while little ubiquitylation was seen when cells were harvested directly after crosslinking (Figure S4F). However, 30 min after irradiation, we observed a strong increase in K48- and K6-linked ubiquitylation (Figures 5C, 5F, S4D, and S4F). In contrast, K63-linked ubiquitylation was barely detectable (Figure S4F).
Collectively, these data indicate the presence of a pathway that resolves certain mRPCs through K6- and K48-linked ubiquitylation and subsequent proteasomal degradation. While K48-linked ubiquitin chains have a well-established function in targeting substrates for proteasomal degradation, the role of atypical K6-linked ubiquitin chains is poorly understood.52
Translation-coupled atypical ubiquitylation of mRPCs by the E3 ligase RNF14
The swift ubiquitylation of mRPCs following crosslinking raises the question as to how cells detect mRPCs and distinguish crosslinked proteins from proteins merely interacting non-covalently with mRNAs. First, we tested a potential involvement of RSR, ISR, and RQC factors by analyzing mRPC resolution in ZAK, GCN2, or ZNF598 KO cells, but we did not observe any effects on mRPC ubiquitylation or stability (Figure S5A). We speculated that the collisions between translating ribosomes and mRPCs might serve as the sensing mechanism for crosslink detection. To test this idea, we globally stalled ribosomes on mRNAs using a high dose of ANS, induced RPCs, and followed their resolution using polyA-PDs, mass spectrometry, and western blotting. Remarkably, pre-treatment with ANS not only abolished K6- and K48-linked mRPC ubiquitylation but also blocked degradation of rapidly turned-over mRPCs (SND1, HDLBP) and more stable mRPCs (YBX1, YBX3) (Figures 6A–6C, S5B, and S5C; Table S8). To exclude that ANS treatment interferes with ubiquitylation in an indirect or unspecific manner, we tested its effect on UVC-induced ubiquitylation of the DNA damage sensor protein XPC53 and observed that XPC ubiquitylation was not affected (Figure S5D).
Figure 6.

Translation-coupled atypical ubiquitylation of mRNA-protein crosslinks by the E3 ligase RNF14
(A–C) Volcano plot (A) comparing mRPCs isolated by polyA pull-down from HAP1 cells treated with 4-SU (2.5 μM, 16 h) and translation inhibitor anisomycin (ANS, 375 μM, 1 h), as indicated, prior to irradiation with UVA (6 kJ/m2) at 1 vs. 0 h after irradiation. Bar graphs depicting normalized label-free quantification (LFQ) intensities (B) and representative western blot analysis (C) showing indicated time points of recovery of mRPCs isolated by polyA-pull-down from HAP1 cells treated as in (A). Statistically significantly changed proteins (adj. p ≤ 0.01, −0.5 ≥ log2 fold change ≥ 0.5) in (A) are highlighted in red. Bar graphs depict mean ± SD of four biological replicates and FDR-adj. p value of 0 vs. 1 h (B).
(D) Schematic depiction of ribosome-associated ubiquitin E3 ligases screen. Two gRNAs per gene were used to generate polyclonal HeLa T-REx Flp-In KO cells, which were then subjected to polyA-pull-downs and western blotting following PAR-CL treatment.
(E) Western blot analysis of polyclonal HeLa T-REx Flp-In KO cells treated with 4-SU (2.5 μM, 16 h) and UVA (6 kJ/m2) 1 h prior to polyA-pull-down assay.
(F−H) Representative western blot analysis showing indicated time points of recovery of mRPCs isolated by polyA-pull-down from clonal of HAP1 RNF14 (F), RNF25 (G), and GCN1 (H) KO cells and matched AAVS1 control cells treated with 4-SU (2.5 μM, 16 h) and UVA (6 kJ/m2).
To identify the critical enzymes for mRPC resolution, we generated polyclonal HeLa T-REx Flp-In KO cells using gRNAs (two per gene) targeting 16 ubiquitin E3 ligases that have been shown to associate with ribosomes (Table S9). Cells were treated with PAR-CL, and mRPC ubiquitylation was monitored 1 h after crosslinking using polyA-PDs, followed by western blot analysis (Figure 6D). While loss of most E3 ligases had no effect, depletion of RNF14 and RNF25 resulted in reduced ubiquitylation in polyA-PD samples (Figure 6E). RNF14 and RNF25 were recently shown to promote the degradation of translation factors that persistently block the ribosomal A site,39,40 which also requires the ribosome collision sensor GCN1.54 To corroborate our screening result, we therefore generated clonal RNF14, RNF25, and GCN1 HAP1 KO cells (Figure S5E) and monitored mRPC ubiquitylation and resolution using polyA-PDs, followed by western blotting (and mass spectrometry, only in RNF14 KO cells). In RNF14 KO cells, mRPC ubiquitylation by K48- and K6-linked chains was entirely abolished, and crosslinks formed by SND1 and HDLBP were stabilized (Figures 6F and S5F–S5I, left for quantification; Table S10). In agreement with their resolution being ubiquitin independent, YBX1 and YBX3 crosslinks were not affected (Figures 6F, S5F, and S5G). Similarly, loss of RNF25 and GCN1 resulted in depletion of K6- and K48-linked mRPC ubiquitylation (Figures 6G and 6H). However, the effect on the resolution of RPCs formed by SND1 was less pronounced than in RNF14 KO cells (Figures 6G, 6H, and S5I, for quantification). This suggests that while RNF25 and GCN1 promote RNF14-dependent ubiquitylation in general, they are not absolutely required. In agreement with mRPC ubiquitylation being independent of canonical RQC, loss of RNF14, RNF25, or GCN1 had no effect on ZNF598-dependent ubiquitylation events induced by PAR-CL treatment (Figure S5J).
Next, we used ribosome profiling to ask whether mRPC ubiquitylation by RNF14 plays a role in the accumulation of PAR-CL-induced crosslinks in ribosomal footprints we described above. In RNF14 KO cells, we observed only a minor decrease of T-C conversions in the A site 30 min after crosslinking (Figure S5K), suggesting that peptide remnants produced by RNF14-dependent degradation are not the major source of ribosome stalling in these experiments. In agreement, we did not observe overt sensitivity to PAR-CL in different clonal HAP1 RNF14 or RNF25 KO cell lines (Figure S5L); any potential milder phenotypes would have been masked by the substantial variation in sensitivity between different clones.
Together, these data suggest a model wherein translating ribosomes serve as a general sensor for the detection of RNA crosslinking damage. Collision between ribosomes and mRPCs triggers the resolution of a subset of RPCs through rapid atypical ubiquitylation by RNF14 (supported by RNF25 and GCN1) and subsequent proteasomal degradation.
Discussion
In this study, we established that PAR-CL can be used to study the consequences of RNA crosslinking damage in the absence of DNA damage. The data we obtained using this system allow for the formulation of a model on crosslinking-induced translation stress and the resulting cellular responses. RNA crosslinking damage causes ribosome stalling and subsequent ribosome collisions, which trigger diverse ribosomal stress surveillance mechanisms, including RQC, ZAKα-dependent RSR activation, and GCN2-dependent ISR activation (Figure 7A).
Figure 7.

Cellular responses to RNA crosslinking damage
(A) RNA crosslinking damage causes ribosome stalling and subsequent ribosome collisions, triggering ribosomal stress surveillance mechanisms, including ZAKα-dependent RSR activation and GCN2-dependent ISR activation.
(B) A subset of mRPCs is subjected to rapid translation-coupled modification with atypical K6- and K48-linked ubiquitin chains by RNF14 (supported by RNF25 and GCN1), resulting in their proteasomal degradation.
By specifically investigating the resolution of crosslinks between RNA-binding proteins and poly-adenylated mRNAs, we provide evidence for a mRPC-resolution pathway (Figure 7B). mRPCs formed by the proteins SND1 and HDLBP are subjected to rapid translation-coupled modification with atypical K6- and K48-linked ubiquitin chains by RNF14, resulting in their proteasomal degradation. Ubiquitylation is supported by RNF25 and the collision sensor GCN1, presumably because they help to activate RNF14 or recruit it to stalled and collided ribosomes, respectively.39 Our data thus demonstrate that the RNF14/RNF25 pathway is a versatile mechanism that targets physiological quality control problems beyond drug-entrapped translation factors.39,40 Given that UVC light is a potent inducer of RPCs,29 our study also provides a mechanistic explanation for the previous observations that UVC irradiation causes RNF14-dependent39 and K6-linked55 ubiquitylation events. It is intriguing that mRPCs are modified with atypical K6- and K48-linked ubiquitin chains, which may be composed of chains with mixed linkages or branched chains, perhaps recruiting specific reader proteins. The cellular roles of K6-linked ubiquitin chains are poorly understood, apart from regulating certain aspects of mitophagy,56 Therefore, it will be interesting to determine the specific function of K6-linked chains in RPC resolution. Interestingly, not all mRPCs are subjected to ubiquitin-dependent proteasomal degradation. Crosslinks formed by YBX1 and YBX3 were resolved slower and in a ubiquitin-independent manner. This is especially intriguing because the accompanying manuscript by Rahmanto et al.57 shows that these mRPCs are subjected to ubiquitylation by RNF14 upon PAR-CL treatment as well. We envision two non-mutually exclusive scenarios. First, YBX1 and YBX3 crosslinks are poor RNF14 substrates, which could be related to their smaller size, compared with SND1 and HDLBP. Consequentially, only a small fraction of these crosslinks may become ubiquitylated. In line with this idea, we did not observe accumulation of hyper-ubiquitylated YBX1 or YBX3 species in our experiments, as seen for SND1. Alternatively, the decision between different modes of RPC resolution may occur downstream of ubiquitylation and may be determined by how accessible the protein adduct is to proteasomal degradation. At any rate, how YBX1 and YBX3 crosslinks are eventually removed is an interesting question. One possibility is that these RPCs are resolved through cleavage of the damaged RNA. In this context and in general, it will be important to determine the fate of mRNA molecules containing RPCs and other crosslinking lesions.
Notably, the principles of mRPC ubiquitylation and resolution revealed in our study are reminiscent of replication-coupled DPC repair mechanisms, which are initiated when the replication machinery stalls at covalent protein adducts.25,58 Analogous to translation-coupled RPC modification by RNF14, DPCs are subjected to replication-coupled ubiquitylation.25,59 Subsequently, DPCs are targeted not only by proteasomal degradation but also by the dedicated DPC protease SPRTN.25,60 Thus, a common theme regarding the detection of covalent nucleic acid-protein crosslinks appears to be the requirement for molecular machines, e.g., ribosomes or the replisome, which scan RNA or DNA, respectively, while carrying out their canonical biological function. Apparently, cells must rely on the stalling of nucleic acid-processing machines as a proxy for the detection of covalent protein adducts, because these lesions are otherwise indistinguishable from proteins merely interacting with RNA or DNA.
To conclude, the existence of mRPC-resolution pathways highlights RNA crosslinking damage as a relevant quality control problem with broad implications. Aldehyde-induced RNA lesions may be sources of endogenous ribosome collisions, which increase during aging,61 and could activate innate immune responses.62 Therefore, mechanisms targeting RNA crosslinking damage may constitute a critical further tier in cellular protection against reactive aldehydes in addition to DNA repair and metabolic detoxification.
Limitations of the study
In this study, we employed PAR-CL as a model system to study RNA crosslinking damage. We found that both FA and PAR-CL crosslink a highly similar set of proteins to RNA and activate identical ribosome-associated stress responses. However, FA-induced crosslinking damage and PAR-CL-induced crosslinking damage are fundamentally different with respect to the molecular nature of the crosslink. Hence, not all cellular responses observed upon PAR-CL treatment will be relevant for aldehyde-induced damage. Furthermore, while PAR-CL specifically induces RNA damage, it is still expected to cause various types of lesions. Thus, it remains unresolved to what degree lesions other than mRPCs contribute to translation stress, ISR activation, and cytotoxicity upon PAR-CL treatment. Understanding the consequences of different types of RNA crosslinking damage, e.g., RNA-RNA crosslinks, is therefore an important future goal. In addition, it will be key to explore the cellular responses to RPC formation in different cellular compartments, especially in the nucleus during transcription and splicing, or in specific RNA regions, e.g., in the untranslated regions of mRNAs. Addressing all these questions will require the development of additional experimental model systems to enable the specific investigation of defined RNA lesions in defined cellular contexts.
STAR★Methods
Key resources table
| REAGENT or RESOURCE | SOURCE | IDENTIFIER |
|---|---|---|
| Antibodies | ||
| Anti-GCN2 | Santa Cruz | Cat# sc-374609; RRID: AB_10986130 |
| Anti-K48 poly-Ub linkage | Cell Signaling | Cat# 8081; RRID: AB_10859893 |
| Anti-K63 poly-Ub linkage | Cell Signaling | Cat# 5621; RRID: AB_10827985 |
| Anti-Ubiquitin | Santa Cruz | Cat#sc-8017; RRID: AB_628423 |
| Anti-phospho-eIF2α (Ser51) | Cell Signaling | Cat# 3597; RRID: AB_390740 |
| Anti-phospho-p38 MAPK (Thr180/Tyr82) | Cell Signaling | Cat# 9216; RRID: AB_331296 |
| Anti-eS10/Ribosomal protein S10 | LS-Bio | Cat# LS-C335612 |
| Anti-SND1/TudorSN | Santa Cruz | Cat# sc-166676; RRID: AB_2270808 |
| Anti-Tubulin | Sigma-Aldrich | Cat# T6074; RRID: AB_477582 |
| Anti-Vinculin | Santa Cruz | Cat# sc-73614; RRID: AB_1131294 |
| Anti-XPC | Santa Cruz | Cat# sc-74410; RRID: AB_1131407 |
| Anti-YBX1/YB1 | Cell Signaling | Cat# 4202; RRID: AB_1950384 |
| Anti-YBX3/ZONAB | Bethyl | Cat# A303-070A;RRID:AB_10893576 |
| Anti-ZAK | Bethyl | Cat# A301-994A;RRID:AB_1576610 |
| Anti-ZNF598 | Sigma-Aldrich | Cat# HPA041760; RRID: AB_10792490 |
| Anti-RNF14/ARA54 | Santa Cruz | Cat# sc-376701; RRID: AB_11150281 |
| Anti-RNF25 | Abcam | Cat# ab89281; RRID: AB_2042820 |
| Anti-GCN1 | Abcam | Cat# ab86139; RRID: AB_1925025 |
| Anti-Ubiquitin Lys6 specific Affimer reagent+GFP/His tag | Sigma-Aldrich | Cat# MABS1918-100UG |
| Anti-GFP | Chromotek | Cat# pabg1; RRID: AB_2749857 |
| Goat-anti-Mouse Immunoglobulins/HRP | Dako | Cat# P0447; RRID: AB_2617137 |
| Swine-anti-Rabbit Immunoglobulins/HRP | Dako | Cat# P0399; RRID: AB_2617141 |
| Bacterial and virus strains | ||
| DH5α competent cells | Thermo Scientific | Cat# 18265017 |
| Chemicals, peptides, and recombinant proteins | ||
| Triton X-100 | Sigma | Cat# T8787-250ML |
| 16% Formaldehyde (w/v), Methanol-free | Thermo Scientific | Cat# 28906 |
| 4x NuPAGE LDS sample buffer | Thermo Scientific | Cat# NP0007 |
| NuPAGE Sample Reducing Agent | Thermo Scientific | Cat# NP0009 |
| cOmplete EDTA-free protease inhibitor cocktail | Sigma | Cat# 4693132001 |
| DTT | Roth | Cat# 6908.2 |
| IGEPAL | Sigma | Cat# I8896-50ML |
| Tween20 | Sigma | Cat# P7949 |
| Q5® High-Fidelity DNA Polymerase | New England BioLabs | Cat# M0515 |
| UltraPure BSA | Thermo Scientific | Cat# AM2616 |
| Lipofectamine 2000 | Invitrogen | Cat# 11668019 |
| Puromycin | Gibco | Cat# A1113803 |
| Q5 Master Mix | New England BioLabs | Cat# M0494L |
| BP clonase | Thermo Fischer | Cat# 11789020 |
| LR clonase | Thermo Fischer | Cat# 11791100 |
| Doxycycline Hyclate | Sigma | Cat# D9891 |
| Proteinase K | Thermo Scientific | Cat# EO0491 |
| RNase A | Thermo Scientific | Cat# EN0531 |
| TAK-243 (Ubiquitin E1 inhibitor) | Biozol | Cat# SEL-S8341 |
| Anisomycin | Sigma | Cat# A9789 |
| Harringtonine | Biomol | Cat# Cay15361-5 |
| A-92 (GCN2 inhibitor) | MedChem Express | Cat# HY-100877 |
| MG132 (Proteasome inhibitor) | Sigma | Cat# SML1135 |
| Resazurin | Sigma | Cat# R7017 |
| TRI reagent | Sigma-Aldrich | Cat# T9424 |
| Chloroform | Sigma-Aldrich | Cat# 32211-M |
| GlycoBlue | Invitrogen | Cat# AM9515 |
| DNAse I buffer 10x | New England BioLabs | Cat# B0303S |
| DNAse I | New England BioLabs | Cat# M0303L |
| RNasin Plus | Promega | Cat# N2615 |
| SYPRO Ruby | Invitrogen | Cat# S12000 |
| SYBR Gold | Invitrogen | Cat# S11494 |
| O-propargyl-puromycin | Jena Bioscience | Cat# NU-931-5 |
| eFluor780 viability dye | Thermo | Cat# 65-0865-14 |
| Alexa Fluor 488-Azide | Jena Bioscience | Cat# CLK-1275-1 |
| DAPI | Fisher Scientific | Cat# 10374068 |
| 4-thio-uridine | Jena Bioscience | Cat# N-RP-2304-250 |
| Protease and phosphatase inhibitor | Cell Signaling | Cat# 5872 |
| BafilomycinA | Biomol | Cat# Cay11038-500 |
| Bortezomib | Hölzel | Cat# A10160-10mM-D |
| Superase In | Thermo Fisher | Cat# AM2696 |
| Critical commercial assays | ||
| Qubit™ dsDNA HS Assay Kit | Thermo Fisher | Cat# Q32851 |
| Q5 site-directed mutagenesis kit | New England BioLabs | Cat# E0554S |
| Oligo d(T) beads | New England BioLabs | Cat# S1419S |
| Nucleo Spin Plasmid Mini Kit | Macherey-Nagel | Cat# 740588.250 |
| NovaSeq 6000 SP Reagent Kit v1.5 | Illumina | Cat# 20028401 |
| h/m/r riboPOOLs rRNA depletion kit | siTOOLs Biotech | Cat# Product ID:50 |
| Deposited data | ||
| Phosphoproteome data | This study | PRIDE: PXD038398 |
| Label-free mass spectrometry data | This study | PRIDE: PXD038332 |
| RNA-seq data | This study, | GEO: GSE240136 |
| Original western blot and gel images | This study | Mendeley Data: https://doi.org/10.17632/drykb7nvcn.1 |
| Original code for ribosome profiling data analysis | This study | Zenodo: https://doi.org/10.5281/zenodo.8403056. |
| Experimental models: Cell lines | ||
| HAP1 | Horizon Discovery | Cat# C631 |
| HeLa T-Rex Flp-In | The Francis Crick Institute Cell Services | N/A |
| HCT116 | ATCC | Cat# CCL-247 |
| Oligonucleotides | ||
| Oligonucleotide sequences used in this study are provided in Table S9 | N/A | N/A |
| Recombinant DNA | ||
| pcDNA4/TO/Strep-HA-ZAKalpha_K45A | Addgene | Cat# 141194 |
| pcDNA4/TO/GFP-ZNF598 | Addgene | Cat# 141191 |
| pcDNA5-FRT/TO-YFP- ZAKαWT | This study | N/A |
| pcDNA5-FRT/TO-YFP- ZAKαK45A | This study | N/A |
| pcDNA5-FRT/TO-YFP- ZNF598WT | This study | N/A |
| pcDNA5-FRT/TO-YFP- ZNF598C29A | This study | N/A |
| pIRES-AcGFP1-Flag-NES | This study | N/A |
| pIRES-FRT-AcGFP1-Flag-GCN2WT | This study | N/A |
| pIRES-FRT-AcGFP1-Flag-GCN2D848N | This study | N/A |
| Software and algorithms | ||
| ImageLab (Version 5.2) | Bio-Rad | N/A |
| SparkControl 3.1 | Tecan | N/A |
| MSnbase package (Version 2.20.1) | Bioconductor | RRID: SCR_019317 |
| R (version 4.1.2) | N/A | N/A |
| GraphPad Prism (Version 9.1.0) | Dotmatics | RRID: SCR_002798 |
| limma (3.50.3) | Bioconductor | N/A |
| MaxQuant (v.1.6.7.0) | MaxQuant | RRID: SCR_014485 |
| https://casecpb.shinyapps.io/ksea/ | N/A | N/A |
| http://www.pantherdb.org/ | N/A | RRID: SCR_004869 |
| Snapgene (Version 5.0.8) | GSL Biotech LLC | RRID: SCR_015052 |
| R package preprocessCore (Version 1.56.0) | N/A | N/A |
Resource availability
Lead contact
Further information and requests for resources and reagents should be directed to and will be fulfilled by the lead contact, Julian Stingele (stingele@genzentrum.lmu.de).
Materials availability
All plasmids and cell lines generated in this study are available upon request from the lead contact.
Data and code availability
-
•
Original western blot images have been deposited at Mendeley and are publicly available as of the date of publication. The mass spectrometry data reported in this manuscript were deposited to the ProteomeXchange Consortium (www.proteomexchange.org,) via the Proteomics Identification Database (PRIDE) partner repository and are publicly available as of the date of publication. Data shown in Figures 1F, 1G, 4C, 5A, 5B, 5D, 5E, 6A, 6B, S4A, S4B, S4E, S5B, S5C, and S5F–S5H were deposited with the dataset identifiers PXD038332 for all data sets; Data shown in Figures 2A and 2B reported in this manuscript were deposited with the dataset identifier PXD038398. RNA-seq data (Figures 3C–3E, S3C, and S5K) have been deposited in the GEO under accession code GSE240136. All identifiers and accession codes are listed in the key resources table.
-
•
All original code for the analysis of ribosome profiling data has been deposited at Zenodo and is publicly available as of the date of publication. DOI is listed in the key resources table.
-
•
Any additional information required to reanalyze the data reported in this paper is available from the lead contact upon request.
Experimental model and study participant details
HeLa T-REx Flp-In (female) cells were provided by Cell Services, The Francis Crick Institute, and maintained in Dulbecco’s Modified Eagle Medium (DMEM) and supplemented with 10% (v/v) fetal bovine serum (FBS). HCT116 (ATCC Id: CCL-247 RRID: CVCL_0291, male) and HAP1 (Horizon Discovery Cat#C631 RRID: CVCL_Y019, male) cells were purchased from Horizon Discovery and grown in RPMI-1640 Medium supplemented with 10% FBS and Penicillin-Streptomycin, and Iscove′s Modified Dulbecco′s Medium (IMDM) supplemented with 10% FBS and Penicillin-Streptomycin-Glutamine, respectively. All human cells were grown supplemented with 5% CO2 at 37°C.
Method details
Western blotting
2×10⁵ HAP1 cells/105 HeLa T-REx Flp-In cells/2×105 HCT116 cells per well were seeded in 12-well plates. The following day, fresh medium with indicated concentrations of 4-SU (Jena Bioscience (N-1090-250)) was added and cells were incubated for 16 h; translation inhibitors (harringtonine, HAR, 2 μg/ml; anisomycin, ANS, 375 μM;) were added to 4-SU containing medium for 0.5 h (HAR, ANS) prior to irradiation, as indicated. Cells were washed once with 1 ml PBS followed by 365 nm UVA irradiation (BS-02 UV/VIS irradiation chamber, Opsytec / Dr. Gröbel) in an additional 1 ml PBS and incubated in fresh media containing indicated inhibitors for 0.5 h. Alternatively, 40 h after seeding, cells were treated with harringtonine (HAR, 2 μg/ml, 0.5 h) followed by the treatment of indicated concentrations of formaldehyde containing HAR for 1 h. For detection of XPC ubiquitylation, 1.5x10⁵ HAP1 cells per well were seeded in 12-well plates. The following day, cells were treated with inhibitors (anisomycin, ANS, 375 μM; Ub-E1i, TAK-243, 1 μM) for 1 h prior to irradiation, as indicated. Cells were washed once with 1 ml PBS followed by irradiation in an additional 1 ml PBS with UVC (50 J/m2; UVP Crosslinker, CL-3000, Analytik Jena) and incubation for 1 h in fresh medium. Cells were directly lysed in 150 μl LDS sample buffer (Thermo Fisher Scientific, NP0007) containing NuPAGE Sample Reducing Agent (Thermo Fisher Scientific, NP0009).
After boiling the samples for 15 minutes at 95°C, they were resolved on NuPAGE-SDS-PAGE gels (Thermo Fisher Scientific). Electrophoresis was followed by transfer to 0.45 μm PVDF membranes (Merck, IPVH00010). Membranes were blocked in 5 % milk in TBS-T for 1 h at room temperature before incubation with the following primary antibodies at 4 °C overnight: Anti-GCN2 (1:1000 dilution), Anti-K48 poly-Ub linkage (1:1000 dilution), Anti-K63 poly-Ub linkage (1:1000 dilution), Anti-Ubiquitin (1:2000 dilution), Anti-Phospho-eIF2a (Ser51) (1:1000 dilution), Anti-phospho-p38 MAPK (Thr180/Tyr82) (1:1000 dilution), Anti-eS10/Ribosomal protein S10 (1:1000 dilution), Anti-SND1/TudorSN (1:500 dilution), Anti-Tubulin (1:2000 dilution), Anti-Vinculin (1:1000 dilution), Anti-XPC (1:500 dilution), Anti-YBX1/YB1 (1:500 dilution), Anti-YBX3/ZONAB (1:1000 dilution), Anti-ZAK (1:1000), Anti-ZNF598 (1:2500 dilution), Anti-RNF14/ARA54 (1:1000 dilution), Anti-RNF25 (1:1000 dilution), Anti-GCN1 (1:1000 dilution), Anti-Ubiquitin Lys6 specific affimer reagent GFP/His-Tag (1:1000 dilution), Anti-GFP (1:1000 dilution).
Afterwards, membranes were washed with TBS-T and incubated with corresponding horseradish peroxidase (HRP)-conjugated secondary antibodies for 1 h at room temperature: Goat-anti-Mouse Immunoglobulins/HRP (1:3000-5000 dilution), Swine-anti-Rabbit Immunoglobulins/HRP (1:3000-5000 dilution). Finally, membranes were imaged using the ChemiDoc MP Imaging System (Bio-Rad).
Cell viability measurement
For PAR-CL treatment, 105 HAP1 cells/5×104 HeLa T-REx Flp-In cells/2×105 HCT116 cells per well were seeded in 12-well plates. Medium was changed with the indicated concentrations of 4-SU the following day. 16 h later, cells were washed once with 1 ml PBS followed by UVA irradiation in an additional 1 ml PBS and fresh medium was added. For formaldehyde treatment, 105 HAP1 cells per well were seeded in 12-well plates. Cells were treated with the indicated concentrations of formaldehyde for 1 h the following day. After 24 h, cellular viability was measured by AlamarBlue assay: the medium was replaced with AlamarBlue cell viability reagent (40 μg/ml resazurin in PBS, Resazurin, R7017, Sigma) and plates were incubated for 1 h at 37°C. Cell viability was then assessed by measuring fluorescence (560 nm excitation/590 nm emission) using Tecan Spark plate reader. For colony formation assay, 103 HAP1/ HeLa T-REx Flp-In/HCT116 cells were seeded into one 6 cm dish. Medium was changed with the indicated concentrations of 4-SU the following day. 16 h later, cells were washed once with 1 ml PBS followed by UVA irradiation in an additional 1 ml PBS and fresh medium was added. 7 days later, cells were dried and scanned following crystal violet staining.
Protein-x-linked RNA extraction
Three 15 cm dishes per condition with each 1.5×10⁷ HAP1 cells were seeded in medium with or without 4-SU (5 μM, 16 h). Cells were then irradiated with UVA (6 kJ/m2) or treated with formaldehyde (500 μM, 1 h). Cells were then washed twice in PBS and scraped in 5 ml ice-cold PBS on ice, transferred to a 50 ml tube and spun down at 500 g for 5 minutes at 4°C. The pellet was then lysed in 8 mL TRI reagent (T9424, Sigma-Aldrich) by pipetting up and down. Subsequently, 1.6 mL chloroform was added, mixed by vigorous shaking and incubated for 5 minutes at room temperature until phase separation was complete. Samples were spun down at 7,000 g for 10 minutes at 4°C. 400μl of the aqueous phase was transferred to a 1.5 ml tube, total RNA was extracted using isopropanol precipitation and resuspended in 200 μl nuclease-free water. The white sticky interphase was transferred to a 2 mL tube and washed twice with 1 mL low SDS buffer (50 mM Tris-HCl, 1 mM EDTA, 0.1% SDS), flushing protein off the walls of the tube while retaining the integrity of the interphase. Samples were spun down at 5,000 g for 2 minutes at room temperature and the supernatant was discarded. After the washing, the interphase pellet was solubilized by adding 1 mL of low SDS buffer and pipetting up and down approx. 20 times. The interphase was spun down with 5,000 g for 2 minutes at room temperature and the supernatant was saved as interphase eluate 1. Solubilization of the interphase was repeated with another 1 mL of low SDS buffer, then twice with 1 mL of high SDS buffer (50 mM Tris-HCl, 1 mM EDTA, 0.5% SDS) each time yielding approx. 1 mL of interphase eluates. NaCl was added to a final concentration of 300 mM to each of the four interphase eluates, along with 1 μl GlycoBlue (AM9515, Invitrogen) and 1 mL isopropanol before mixing by inversion. Samples were spun down for 15 minutes at 18,000 g at -10°C. The supernatants were discarded and pellets from all four elutes were combined in 2 mL of 70% ethanol. The combined sample was again centrifuged for 1 minute at 18,000 g at room temperature, supernatant discarded, and all residual ethanol was removed. The pellet was taken up in 1.8 mL of nuclease-free water and allowed to swell for 1 hour on ice with occasional mixing by inversion and eventually dissolved by pipetting. 200 μl 10 x NEB DNase I buffer was added along with 2 μl RNasin Plus, 100 μl NEB DNase and incubated for 1.5 h at 37°C and 700 rpm. Subsequently, the sample was isopropanol precipitated as described above without further addition of GlycoBlue. Pellets were taken up in 400μl nuclease-free water and dissolved by pipetting. Samples were flash frozen and stored at -80°C. For further analysis, the samples were either digested with proteinase K or RNase A for 1 h shaking at 700 rpm at 60°C or 37°C, respectively. RNase-digested samples were either directly subjected to MS or combined with 2x LDS sample buffer and boiled at 95°C for 10 minutes to be analyzed by SDS-PAGE and SYPRO Ruby staining. ProteinaseK-digested samples were combined with 2x RNA loading dye and boiled for 2 minutes at 85°C and immediately placed on ice. The samples were analyzed on an agarose gel and stained with SYBR Gold according to manufacturer.
Detection of DPCs by KCl-SDS assay
105 HAP1 or HeLa T-REx Flp-In cells were seeded per well in 6-well plates. The following day, cells were treated with 5 μM 4-SU for 16 h prior to irradiation with 6 kJ/m2 UVA in 1 ml PBS following one wash with PBS or cells were treated 40 h after seeding with 500 μM formaldehyde for 1 h followed by two washes with PBS prior to KCl-SDS assay. To quantify DPC induction, cells were collected in 400 μl denaturing lysis buffer (2% SDS, 20 mM Tris-HCl pH 7.5), frozen in liquid nitrogen and stored at -80°C until further processing. Cell lysates were thawed at 55°C for 5 minutes with 1,200 rpm shaking, followed by pipetting samples up and down 30 times. Cellular proteins were precipitated by adding 400 μl precipitation buffer (200 mM KCl, 20 mM Tris-HCl pH 7.5) followed by incubation on ice for 5 minutes. Precipitated proteins were pelleted by full-speed centrifugation at 4°C for 5 minutes. Next, 400 μl supernatant was saved and used for soluble DNA measurements. The pellet was dissolved in 400 μl precipitation buffer by cooling down on ice for 5 minutes following incubation at 55°C for 5 minutes with 1,200 rpm shaking and subsequent re-pelleting by full-speed centrifugation at 4°C for 5 minutes. After repeating the washing procedure three times, protein precipitate was resuspended in 400 μl Proteinase K-containing precipitation buffer (200 mM KCl, 20 mM Tris-HCl pH 7.5, Proteinase K 0.2 mg/ml) followed by incubation at 55°C for 45 minutes with 1,200 rpm shaking. Finally, 10 μl BSA (50 mg/ml) was added to the solution followed by cooling down on ice for 5 minutes. Following a full-speed centrifugation at 4°C for 5 minutes, crosslinked DNA in the supernatant was collected. RNA contaminants in total DNA and crosslinked DNA were digested with 0.2 mg/ml RNase A for 30 minutes at 37°C. DNA concentrations were measured using Qubit™ dsDNA HS Assay Kit (Thermo Fisher) according to the manufacturer’s instructions. The proportion of crosslinked DNA was calculated as the ratio between crosslinked DNA and total DNA (crosslinked plus soluble DNA). Fold change represents the value of treated samples normalized to the mean value of untreated control.
Quantitative phosphoproteomics
1.5×10⁷ HAP1 cells were seeded into 15 cm dish with medium containing 4-SU (5 μM, 16 h), followed by 10 ml PBS wash once prior to 6 kJ/m² UVA irradiation in additional 10 ml PBS to induce RPCs. Cells were then incubated for 0.5 h in fresh medium at 37°C. To harvest, cells were washed twice in 10 ml PBS and then scraped in 5 ml ice-cold PBS on ice, transferred to a 15 ml tube and spun down at 500 g for 5 minutes at 4°C. Cell pellets were flash-frozen in liquid nitrogen and stored at -80°C until further processing. For TMT labelling, cell pellets were lysed in modified RIPA buffer (50 mM Tris-HCl pH 7.5, 150 mM NaCl, 1 mM EDTA, 1% NP-40, 0.1% sodium deoxycholate, containing Complete protease inhibitor cocktail, 1 mM sodium orthovanadate, 5 mM β-glycerophosphate, and 5 mM sodium fluoride) and homogenized and cleared by sonication and centrifugation, respectively. A minimum of 5 mg of protein from individual whole cell lysates were trypsin-digested and used for downstream 16-plex TMT-labelling, and phosphopeptide enrichment. Briefly, acetone precipitated protein samples were digested to peptides using MS-approved trypsin (Serva) at 1:150 and desalted through the reversed-phase Sep-Pak C18 cartridges (Waters). Next, a total 150 μg of peptides for each individual sample were subjected to TMT labelling at 1:1 for 1 h in 150 mM HEPES, pH 8.5. TMT-labelling was terminated with the addition of 0.4 % hydroxylamine solution and excess labels were cleaned up through the reversed-phase Sep-Pak C18 cartridges. Finally, equal amount of the TMT-labelled peptides were combined for subsequent titanium dioxide (TiO2)-based phosphopeptide enrichment.63 The enriched phosphopeptides were eluted from the TiO2 spheres using 5% NH4OH and 10% NH4OH / 25% ACN, concentrated, acidified and fractionated using micro-column-based SCX prior to C18 Stage tipping. For phosphopeptide measurements, peptide fractions were analyzed on a quadrupole Orbitrap mass spectrometer (Orbitrap Exploris 480, Thermo Scientific) equipped with a UHPLC system (EASY-nLC 1000, Thermo Scientific), as described.64,65 Peptide samples were loaded onto C18 reversed-phase columns (15 cm length, 75 μm inner diameter, 1.9 μm bead size) and eluted with a linear gradient from 8 to 40% acetonitrile containing 0.1% formic acid in 2 h. The mass spectrometer was operated in data-dependent mode, automatically switching between MS and MS2 acquisition. Survey full scan MS spectra (m/z 300-1650) were acquired in the Orbitrap. The 10 most intense ions were sequentially isolated and fragmented by higher-energy C-trap dissociation (HCD).66 Peptides with unassigned charge states, as well as with charge state less than +2 were excluded from fragmentation. Fragment spectra were acquired in the Orbitrap mass analyzer.
Generation of knockout cells
To generate ZAK, GCN2, ZNF598, RNF14, RNF25, GCN1 knock-out and AAVS1 control clones, gRNA_ZAK_1, gRNA_ZAK_2, gRNA_GCN2, gRNA_ZNF598_1, gRNA_ZNF598_2, gRNA_RNF14_1, gRNA_RNF25_2, gRNA_GCN1_2 and gRNA_AAVS1 were cloned into pX330-Puro (Addgene #82580). gRNA_ZAK_1, gRNA_GCN2, gRNA_ZNF598_2, gRNA_RNF14_1, gRNA_RNF25_2, gRNA_GCN1_2 and gRNA_AAVS1 were transfected into HAP1 cells, gRNA_ZAK_1, gRNA_GCN2, gRNA_ZNF598_1 and gRNA_AAVS1 were transfected into HeLa T-REx Flp-In cells, gRNA_ZAK_2, gRNA_GCN2, gRNA_ZNF598_1 and gRNA_AAVS1 were transfected into HCT116 cells, using Lipofectamine 2000 (Invitrogen) according to the manufacturer’s instructions. 16 h after transfection, cells were selected in 0.75 μg/ml puromycin-containing IMDM media (HAP1 cells) or 1 μg/ml puromycin-containing DMEM media (HeLa T-REx Flp-In cells) or 1 μg/ml puromycin-containing RPMI 1640 media (HCT116 cells) for 2–3 days until un-transfected cells had died. To generate single clones, puromycin-selected cells were reseeded in 96-well plates (0.5 cell/well). Single clones were expanded and validated by western blotting using corresponding antibodies. gRNA sequences are deposited in Table S9.
Complementation of knockout cells
Clonal HeLa T-REx Flp-In or HCT116 ZAK/GCN2/ZNF598 knock-out cells were seeded in 6-well plates, and grown to 50% confluency, followed by transient transfection with 2 μg pIRES-FRT plasmids (encoding AcGFP1-Flag-GCN2WT, AcGFP1-Flag-GCN2D848N), pIRES- plasmid (encoding AcGFP1-Flag-NES) or pcDNA5-FRT/TO plasmids (encoding YFP-ZAKWT, YFP-ZAKK45A YFP-ZNF598WT, YFP-ZNF598C29A) using Lipofectamine 2000 (Invitrogen) according to the manufacturer’s instructions. 16 h after transfection, cells were reseeded into 12-well plates (105 HeLa T-REx Flp-In cells with 1 μg/ml doxycycline or 2×10⁵ HCT116 cells per well) followed by indicated treatments and after 0.5 h cells were lysed in 150 μl LDS sample buffer and analyzed by western blot.
Molecular cloning and site-directed mutagenesis
pcDNA4/TO/Strep-HA-ZAKalpha_K45A, pcDNA4/TO/GFP-ZNF598 were provided by Addgene (#141194, #141191). ZAKα-K45A and ZNF598 WT were amplified by PCR and cloned into pDONR221 vector using Gateway BP clonase followed by shuttling into pcDNA5-FRT/TO-YFP vector using LR clonase. GCN2 fragments were cloned from cDNA and inserted into pIRES-FRT-AcGFP1-Flag vector (modified from pIRES-AcGFP1-Flag vector, a gift from Boulton lab) using Gibson assembly protocol. ZAKαWT, ZNF598C29A, GCN2D848N were generated by Q5 site-directed mutagenesis (NEB, #E0554S) according to the manufacturer’s instructions.
Measurements of protein synthesis rates
1×10⁶ HeLa T-REx Flp-In/1.5×106 HAP1 cells were seeded in one 6 cm dish per condition in medium with or without indicated concentrations of 4-SU. Cells were irradiated with 6 kJ/m2 UVA following 16 h incubation with 4-SU and washed twice with PBS directly after irradiation or at indicated recovery time points, followed by 2 ml of medium containing OPP (20 μM final concentration) incubation for 30 minutes at 37°C. Cells were then washed twice with PBS, trypsinized and collected in a 1.5 ml tube. Samples were spun down at 500 g for 5 minutes and supernatant was discarded. The pellet was washed in 1 ml PBS once and subsequently spun down again. Cells were then resuspended in 200 μl PBS containing 1x eFluor780 viability dye (Thermo, 65-0865-14) and incubated for 30 minutes in the dark at 4°C with occasional mixing. Afterwards cells were spun down and washed with 1 ml 1% BSA in PBS. Subsequently the cells were fixed by resuspending the pellet in 200 μl 4% Formaldehyde in PBS and incubated for 15 minutes at room temperature. Cells were again washed with 1 ml 1% BSA in PBS and stored in 1% BSA in PBS in the fridge.
For click-labelling, fixed cells were spun down and the pellet was resuspended in 250 μl 0.25% Triton-X in PBS and incubated for 20 minutes at room temperature for permeabilization. In the meantime, click-chemistry mix was prepared using freshly dissolved ascorbic acid (113,5 mM, 50 mg in 2.5 ml water). For each condition 250 μl of click-chemistry mix was prepared with final concentration of 39.5 mM Tris-HCl pH 8.0, 60 μM Alexa Fluor 488-Azide, 4 mM CuSO4, 11 mM ascorbic acid and 10 nM DAPI. After permeabilization, cells were spun down, washed with 1 ml 1% BSA in PBS and supernatant was removed. Cells were then resuspended in 250 μl click-chemistry mix, and reactions were incubated for 30 minutes at room temperature in the dark and mixed by occasional flicking of the tube. After incubation, cells were washed in 1 ml 1% BSA in PBS and finally resuspended in 200 μl 1% BSA in PBS and analyzed by flow cytometry.
For flow cytometry, samples were analyzed on a BD LSRFortessa (BD Bioscience) equipped with 355/405/488/561/640 nm lasers with a minimum count of 10,000 events. Flow cytometry results were analyzed using FlowJo™ v10.7 Software (BD Life Sciences). Staining with fixable viability dye eFluor780 was used to exclude dead cells, and the mean fluorescence intensity (MFI) in FITC channel was measured for single and live cells.
Polysome profiling
7×10⁶ HAP1 cells were seeded into 15 cm dishes in no-phenol-red medium, with or without 5 μM 4-SU. Two dishes were prepared per condition. Cells were irradiated with 6 kJ/m2 UVA following 16 h incubation of 4-SU. Cells were harvested immediately or 0.5 h after irradiation on ice by scraping in 5 ml ice-cold PBS, followed by two washes in 10 ml PBS. Cells were pelleted with 500 g centrifugation for 5 minutes at 4°C. From then, all steps were performed at 4°C. Pelleted cells were resuspended in 500 μl of lysis buffer (5 mM Tris-HCl pH 7.5, 1.5 mM KCl, 2.5 mM MgCl2, 2 mM DTT, 0.5% v/v Triton X-100, 0.25% w/v sodium deoxycholate, 20 U/ml SUPERase-In RNase Inhibitor (Invitrogen), complete EDTA-free protease inhibitor cocktail (Roche)) and spun down at 15,000 g for 5 minutes. The nucleic acid content of the supernatants was measured by determining absorption at 260 nm (A260) in an Eppendorf BioPhotometer. Equal volumes of each supernatant were then applied to 10%-50% continuous sucrose density gradients (20 mM HEPES, pH 7.5, 100 mM KOAc, 5 mM Mg (OAc)2, 1 mM DTT, and protease inhibitor cocktail). The gradients were centrifuged in an SW40Ti rotor (Beckman Coulter) at 202,408 g for 135 minutes and fractionated using a BioComp Gradient Station while A260 was recorded using a Triax Flow Cell FC-2. Measured absorption values were normalized to the soluble fraction containing no ribosomal material.
Disome profiling
0.75×10⁶ HAP1 cells were seeded onto 6×10 cm plates and grown overnight at 37°C. The next day, cells were supplemented with fresh medium containing 10% dialyzed FBS and supplemented with 5 μM 4-SU. After approx.18 h of 4-SU incorporation, cells were re-supplemented with fresh IMEM (containing dialyzed FBS and 5 μM 4-SU) without phenol-red. 1 h later, plates were treated with 0 or 6 kJ/m2 UVA, and allowed to recover for 0.5 h. Cells were lysed by aspirating media, immediately rinsed with 10 ml warm PBS supplemented with 378 μM anisomycin to freeze ribosomes in situ, and lysed by adding 250 μl ice-cold lysis buffer (50 mM HEPES, pH 7.4, 100 mM KOAc, 5% glycerol, 0.25% NP-40, 15 mM Mg(OAc)2, 378 μM anisomycin, 8 units/ml Turbo DNase (Thermo Fisher), 1x protease and phosphatase inhibitor (Cell Signaling), 0.2 μl/ml SUPERase IN, and 1 mM TCEP) dropwise to the plate. Plates were swirled to distribute lysis buffer, and cells were scraped from the plate using a cell scraper, gently pipetted to homogenize the cell lysate, and transferred to ice for 10 minutes to complete lysis. Lysates were clarified by brief centrifugation at 8,000 g for 10 minutes, and the clarified supernatant was transferred to a fresh tube on ice. Clarified cell lysates were treated with RNase A (Ambion) using the following condition: 1 μg RNase A was added per 100 μg RNA in a 250 μl reaction volume, shaken at 500 rpm (20 minutes, 25 °C) on a table-top thermo-mixer (Eppendorf); the reaction was quenched by the addition of SUPERaseIn RNase inhibitor (∼200 units per 100 μg RNA). RNase A digested lysates were layered on top of 10-35% sucrose gradients and ultra-centrifuged in a Beckman SW41 swinging bucket rotor (40,000 rpm; 105 minutes). UV (A260) absorbance across 10-35% sucrose gradients was measured using a top-down Biocomp Piston Gradient Fractionator as per manufacturer’s instructions.
Ribosome profiling
1.5×10⁶ HAP1 cells were seeded onto twelve 10 cm plates and grown overnight. The next day, the media was changed to fresh IMEM media with or without 5 μM 4-SU. After 18 h, the media was changed to media without phenol red (with or without 5 μM 4SU). 30 minutes later, half of the plates of cells were irradiated with 6 kJ/m² UVA. After a 0.5 h recovery period, the plates were washed with 10 mL warm PBS buffer and cells from each plate were resuspended with vigorous scraping in 250 μL lysis buffer (50 mM HEPES, pH 7.4, 100 mM KOAc, 5% glycerol, 0.25% NP40, 15 mM Mg (OAc)2, 100 μg/mL cycloheximide, protease and phosphatase inhibitor (Cell Signaling), 0.2 μL/mL SUPERase IN, and 1 mM TCEP). Lysates were digested with Turbo DNase I (2 units/mL) for 15 minutes on ice and clarified by centrifugation at 20,000 g for 10 min. 30 μg of RNA was digested with 150 units of RNase I for 1 h at 25 °C. The ribosomes were pelleted through a 1 mL sucrose cushion (1 M sucrose, 20 mM Tris-HCl pH 8, 150 mM KCl, 5 mM MgCl2, 1 mM DTT, and 100 μg/mL cycloheximide) in a TLA100.3 rotor at 100,000 rpm for 1 h at 4 °C. The ribosome pellets were resuspended in 250 μL proteinase K buffer (50 mM Tris-HCl pH 7.5, 75 mM NaCl, 12.5 mM EDTA, 1% SDS, and 1.2 mg/mL proteinase K) and digested for 30 minutes at 55 °C. Following phenol extraction, RNA was size-selected on 15% denaturing PAGE gels, isolating between 15-70 nt fragments. Library construction was carried out as described previously.67 The libraries were sequenced on the Illumina NovaSeq6000 instrument at the Johns Hopkins University Genetic Resources Core Facility. For Figures S3C and S5K, the cells were treated as described before followed by snap freezing in liquid nitrogen at the indicated time points after UVA irradiation and stored at -80°C until all the samples were collected. Lysis, Turbo Dnase I treatment, and RNase I digestion were carried out as described above. Ribosomes were then pelleted through a 1 mL sucrose cushion by centrifugation in a S120-AT2 rotor at 100,000 rpm for 1 h at 4 °C. The ribosome pellets were treated with Proteinase K as described above. Following hot phenol extraction, 2 μg RNA was separated on 15 % denaturing polyacrylamide gel, the ∼15-70 nt region was excised and libraries were constructed from the size-selected RNA as described previously.68 The libraries were sequenced on the Illumina NovaSeq 6000 instrument at NGS Facility of the Department of Totipotency at MPIB.
Data processing for RNA-seq
Reads in the raw FASTQ files were trimmed to remove the adaptor and UMI sequence NNNNNNCACTCGGGCACCAAGGAC using the bbduk script in the BBtools suite (https://jgi.doe.gov/data-and-tools/bbtools/). rRNA sequences were removed by aligned to a non-coding RNA library, after which trimmed reads failing to align were then aligned to the hg38 human genome sequence using STAR.69 Subsequent analyses were performed with custom Python scripts. For metagene plots, the transcript with the highest level of evidence in the ensemble database was selected for each gene. For each transcript with more than an average of 0.1 reads per codon, the average ribosome density surrounding the start codon (100 nt upstream and 1,000 nt downstream) was calculated with each gene contributing equally to the average. To identify T to C conversions, sites where the HAP1 cells differ from the hg38 annotation were first compiled in a VCF file from RNAseq data from three untreated samples using the mpileup and call command from bcftools. From the BAM alignment files, reads containing T to C conversions were identified; if the site of conversion corresponds to a known SNP in the VCF file, these reads were ignored. The position of the remaining T to C conversions in the reads that are standard ribosome footprints (30/32nt) or disomes (> 58 nt) were counted.
PolyA-pull-down
1.5×10⁷ HAP1 cells were seeded into 15 cm dish with indicated concentration of 4-SU for 16 h prior to UVA (6 kJ/m²) irradiation; inhibitors (TAK-243, Ub-E1i, 1 μM; MG132, 5 μM; anisomycin, ANS, 375 μM; bafilomycin A1, 50 nM, bortezomib, 1 μM) were added to 4-SU containing medium for 1 h prior to irradiation, as indicated. Cells were washed once in 10 ml PBS prior to irradiation in fresh 10 ml of PBS. Cells were then scraped in 5 ml ice-cold PBS on ice at indicated time points, transferred to a 15 ml tube and spun down at 500 g for 5 minutes at 4°C. PBS was removed and cells were lysed in 5 ml ice-cold lysis buffer (20 mM Tris-HCl pH 7.5, 500 mM LiCl,1 mM EDTA pH 8.0, 0.5 % LiDS, add fresh: 5 mM DTT, Protease-inhibitor cocktail, RNAse Inhibitor 20U/ml) by pipetting up and down. Subsequently lysates were homogenized using a syringe with five consecutive strokes and flash frozen in liquid nitrogen. For processing, samples were thawed at 60°C in a water bath for 5 minutes and placed on ice. 200 μl NEB oligo d(T) beads per conditions were equilibrated in lysis buffer and added to the lysates. Binding of the beads was performed at 4°C on a rotation wheel at 20 rpm for 1 h. After binding, lysates were placed on a magnetic rack to collect the beads. A 100 μl sample (SN) was taken from each sample and 3x LDS sample buffer was added to a final volume of 150 μl. Beads were then washed twice with wash buffer 1 (20 mM Tris-HCl pH 7.5, 500 mM LiCl, 1 mM EDTA pH 8.0, 0.1% LiDS; add fresh: 5 mM DTT, Protease-inhibitor cocktail), then twice with wash buffer 2 (20 mM Tris-HCl pH 7.5, 500 mM LiCl, 1 mM EDTA pH 8.0, 0.02% IGEPAL CA-360, add fresh: 5 mM DTT, Protease-inhibitor cocktail) and twice with wash buffer 3 (20 mM Tris-HCl pH 7.5, 200 mM LiCl, 1 mM EDTA pH 8.0, 0.02% IGEPAL CA-360, add fresh: 5 mM DTT, Protease-inhibitor cocktail) using the magnetic rack and in the final washing step, tubes were spun down in the centrifuge at 2,000 g for 10 minutes at 4°C. Wash buffer 3 was then removed completely and beads were resuspended in 220μl nuclease-free water. An aliquot of 20 μl was taken to elute RNA and normalize the samples. RNA was eluted in heat elution buffer. To this end, beads in the 20 μl aliquot were collected and supernatant removed. Beads were then resuspended in 15 μl heat elution buffer (20mM Tris-HCl pH 7.5, 1mM EDTA in nuclease-free water) and incubated at 700 rpm at 95°C for 5 minutes and instantly placed in a magnetic rack. Supernatant was collected immediately, and RNA content was measured using NanoDrop (Thermo Fisher Scientific). The volume of beads used for protein elution was then normalized to the RNA content. To elute crosslinked proteins, normalized volumes of beads were collected on the magnetic rack and supernatant was removed. Resuspension in 90 μl of protein elution buffer (RNase A (100 U), 5mM DTT in nuclease-free water) and subsequent incubation at 700 rpm at 37°C for 30 minutes was done to release crosslinked protein from beads. 4x LDS sample buffer was added to a final volume of 120 μl and samples were boiled at 95°C for 10 minutes and analyzed by SDS-PAGE and Western Blot.
Quantitative proteomics of XRNAX and polyA-PD
After RNA digestion, samples were dried in a speed vacuum centrifuge and diluted in 15 μl 8 M Urea/0.4 M NH4HCO3. Proteins were reduced using dithioerythritol (final concentration: 5 mM) for 30 minutes at 37°C. Subsequently, alkylation of cysteines was done with iodoacetamide (final concentration: 15 mM) for 30 minutes and quenched with 15 mM dithioerythritol for 15 minutes at room temperature in the dark. The first digestion step was performed using Lys-C (1:100, enzyme:protein ratio, Wako) at 37°C for 4 h. Prior to tryptic digestion, samples were diluted with H2O to give 1 M Urea. Tryptic digestion was performed (1:50, enzyme:protein ratio, Promega) at 37°C for 16 h. For LC-MS/MS analysis each sample was injected in an Ultimate 3000 nano-chromatography system (Thermo Fisher Scientific) and transferred to a trap column (Acclaim PepMap 100 μm × 2cm, 5 μm particles, 100Å, ThermoFisher Scientific). Separation was performed at 250 nl/minute using a 50 cm reversed-phase separation column (PepMap RSLC C18 2 μm 100 Å 75 μm × 50 cm, Thermo Fisher Scientific). Solvent A consisted of 0.1 % formic acid in water and solvent B consisted of 0.1 % formic acid in acetonitrile. For separation, two consecutive gradients from 3% to 25% solvent B in 40 minutes and 25% to 40 % solvent B in 5 minutes were applied. Eluting peptides were analyzed on a QExactive HF-X mass spectrometer (Thermo Fisher Scientific) with a top 15 data-dependent acquisition method. Data processing, peptide search and quantification was done with MaxQuant (v.1.6.7.0)70 and the human subset of the UniProt database. To identify ubiquitin chain linkages in polyA-pulldown samples, raw spectral files were reanalysed in MaxQuant, setting GlyGly as a variable modification.
Ribosome-associated Ub-E3 ligase screen
A total of 16 ubiquitin E3 ligases were tested in this study. Two gRNAs for each gene were designed (gRNA sequences are shown in Table S9), cloned into pX330-Puro and transfected together into HeLa T-REx Flp-In cells in 6-well plates using Lipofectamine 2000 (Invitrogen) according to the manufacturer’s instructions. 8 h after transfection, cells were expanded into 10 cm dishes and selected in 1 μg/ml puromycin-containing DMEM media for 2-3 days until non-transfected cells had died. Afterwards, 4×10⁶ cells were seeded into 10 cm dishes containing 2.5 μM 4-SU for 16 h followed by 6 kJ/m2 UVA irradiation. Cells were subjected to polyA-pulldown 1 h after irradiation and the ubiquitin signal was validated by western blotting.
Quantification and statistical analysis
Statistical analysis of MS data was performed in R (version 4.1.2). For XRNAX analysis (Figure 1F), LFQ intensity values were log2 transformed and filtered for proteins identified in all three replicates of either formaldehyde or 4-SU+UVA treated samples. Additionally, proteins were discarded if they were identified more than once in the untreated control.
For phosphoproteome analysis (Figures 2A, 2B, and S2A), only peptides with a localization probability >= 0.75 and no missing values were considered. TMT-reporter intensities were log2 transformed and quantile normalized between the replicates using the R package preprocessCore (version 1.56.0). Significantly regulated phosphorylation sites were identified by employing a moderated t-test using the R package limma (version 3.54.0) with Benjamini-Hochberg FDR correction.71 Only sites with a log2-fold change > 1 and an FDR-adjusted p value ≤ 0.01 were considered significant. Significantly changed phosphosites are indicated in red and blue, with the top 10 increased sites in orange and top 10 decreased sites in dark blue. Phosphosite annotation and kinase-substrate relations were obtained from the PhosphoSitePlus database.72 For phosphosite identification the flanking sequence (+/- 7 aa) was used. Kinase activity was estimated using the KSEA App web application with a p value ≤ 0.01 and a minimum NetworKIN score cut-off of 2.73
For polyA-pulldown MS analysis in Figure 4C, LFQ intensities were log2 transformed and filtered for proteins detected in at least 50% of all 4-SU+UVA treated replicates. Additionally, for experiments shown in Figures 5A, 5B, 5D, 5E, 6A, 6B, S4A, S4B, S5B, S5F, and S5G only proteins detected in at least three out of four replicates were kept. Quantile normalization was employed between the replicates and missing values were imputed based on a mixed imputation strategy using the MSnbase package (version 2.20.1). In detail, proteins with a higher mean intensity than the top five most abundant proteins with ≥ 10% missing values were considered missing at random and imputed using the k-nearest neighbours algorithm. Proteins below that threshold were imputed using the MinDet method. To test for differential protein abundance a moderated t-test using limma with Benjamini-Hochberg FDR correction was employed. Proteins with a log2 fold change ≥ 0.5 or ≤ -0.5 and an adjusted p value ≤ 0.01 were considered significant. FDR- adjusted p-values are indicated above the bar graphs.
Statistical testing of western blot quantification data (Figure S5I) was done by paired Studentś t-test, comparing three independent technical replicates.
Acknowledgments
We thank F. Schleich for preliminary work on this study. We also thank the Core Facility Flow Cytometry at Biomedical Center, LMU Munich and SFB 1361 at Institute Molecular Biology, Mainz for experimental support. S.Z. was supported by the LMU – China Scholarship Council Program and J.C. and P.W. by the International Max-Planck Research School for Molecular Life Sciences. Research in the lab of J.S. is supported by the European Research Council (ERC Starting Grant 801750 DNAProteinCrosslinks); Alfried Krupp Prize for Young University Teachers awarded by Alfried-Krupp von Bohlen und Halbach Stiftung, European Molecular Biology Organization (YIP4644); The Vallee Foundation; and Deutsche Forschungsgemeinschaft (DFG, German Research Foundation) (project ID 213249687—SFB 1064, project ID 393547839—SFB 1361). G.H. is supported by the Radiation Research Unit at the Cancer Research UK City of London Centre Award (C7893/A28990), A.R.B. by the National Institutes of Health (grant GM136960), and R.G. by Howard Hughes Medical Institute. D.D.N. is funded by the Max Planck Society, the European Research Council under the European Union’s Horizon 2020 Research and Innovation Programme (ERC Starting grant no. 803825-TransTempoFold), and SFB 1035 (German Research Foundation DFG, Sonderforschungsbereich 1035, Projektnummer 201302640, project B14).
Author contributions
Conceptualization, S.Z., J.C., and J.S.; investigation, S.Z., J.C., K.M.C., T.M.-K., A.J.V., N.K.S., and S.K.; resources, P.W. and G.H.; formal analysis, M.J.G. and A.R.B.; funding acquisition, J.S., R.G., R.B., T.F., D.D.N., and G.H.; supervision, J.S., R.G., R.B., T.F., and D.D.N.; writing – original draft, S.Z., J.C., and J.S.; writing – review & editing, S.Z., J.C., K.M.C., M.J.G., T.M.-K., N.K.S., P.W., G.H., T.F., R.B., A.R.B., R.G., and J.S.
Declaration of interests
R.G. is a member of the scientific advisory board at the journal Molecular Cell.
Published: November 10, 2023
Footnotes
Supplemental information can be found online at https://doi.org/10.1016/j.molcel.2023.10.012.
Supplemental information
Log2 intensities of RNA-crosslinked proteins isolated using XRNAX from cells treated with formaldehyde (FA) or PAR-CL (4-SU+UVA) or from untreated control (Ctrl) cells. Three biological replicates were measured per condition.
Statistical test results of phospho-site changes in all comparisons between untreated HAP1 AAVS1 cells (Ctrl) or after PAR-CL treatment (4-SU+UVA) and ZAK KO cells treated with PAR-CL (4-SU+UVA_ZAK) returned by limma. Four biological replicates were measured.
Normalized log2 intensities of all phospho-sites detected in untreated HAP1 AAVS1 cells (Ctrl) or after PAR-CL treatment (4-SU+UVA) and in ZAK KO cells treated with PAR-CL (4-SU+UVA_ZAK). Four biological replicates were measured per condition.
KSEA-App output table. Kinase-substrate enrichment scores based on significant hits in untreated vs. PAR-CL-treated cells (4-SU+UVA).
Log2 intensities of mRNA-crosslinked proteins isolated using polyA-PD from cells harvested after treatment with 4-SU alone (4-SU), UVA alone (UVA), 4-SU+UVA (4-SU+UVA_0H), and from untreated cells (Ctrl). Sorted by average log2 intensity. Three biological replicates were measured.
Statistical test results of comparisons of mRNA-crosslinked proteins isolated using polyA-PD between different time points (0 h, 0.5 h, and 1 h) after either PAR-CL (4-SU+UVA) treatment alone or including a pre-treatment with Ub-E1-inhibitor (Ub-E1i) returned by limma, and normalized LFQ intensities of PAR-CL-induced mRNA-crosslinked proteins isolated using polyA-PD at different time points (0, 0.5, and 1 h); treated either with PAR-CL (4-SU+UVA) alone or including a pre-treatment with Ub-E1-inhibitor (4-SU+UVA_E1). Four biological replicates were measured.
Statistical test results of comparisons of mRNA-crosslinked proteins isolated using polyA-PD between different time points (0, 0.5, and 1 h) after either PAR-CL (4-SU+UVA) treatment alone or including a pre-treatment with proteasome inhibitor (MG132) returned by limma, and normalized LFQ intensities of PAR-CL-induced mRNA-crosslinked proteins isolated using polyA-PD at different time points (0, 0.5, and 1 h); treated either with PAR-CL (4-SU+UVA) alone or including a pre-treatment with proteasome inhibitor MG132 (4-SU+UVA_MG132). Four biological replicates were measured.
Statistical test results of comparisons of mRNA-crosslinked proteins isolated using polyA-PD between different time points (0, 0.5, and 1 h) after either PAR-CL (4-SU+UVA) treatment alone or including a pre-treatment with translation inhibitor anisomycin (ANS) returned by limma, and normalized LFQ intensities of PAR-CL-induced mRNA-crosslinked proteins isolated using polyA-pull-down at different time points (0, 0.5, and 1 h); treated either with PAR-CL (4-SU+UVA) alone or including pre-treatment with translation inhibitor anisomycin (4-SU+UVA_ANS). Four biological replicates were measured.
Sequences of all gRNAs used in this study.
Statistical test results of comparisons of mRNA-crosslinked proteins isolated using polyA-PD between different time points (0, 0.5, and 1 h) after PAR-CL (4-SU+UVA) treatment either in AAVS1 control or RNF14 KO cells returned by limma, and normalized LFQ intensities of PAR-CL-induced mRNA-crosslinked proteins isolated using polyA-PD at different time points (0, 0.5, and 1 h) either from AAVS1 control or RNF14 KO cells. Four biological replicates were measured.
References
- 1.Sullivan L.B., Gui D.Y., Vander Heiden M.G. Altered metabolite levels in cancer: implications for tumour biology and cancer therapy. Nat. Rev. Cancer. 2016;16:680–693. doi: 10.1038/nrc.2016.85. [DOI] [PubMed] [Google Scholar]
- 2.Alizadeh E., Orlando T.M., Sanche L. Biomolecular damage induced by ionizing radiation: the direct and indirect effects of low-energy electrons on DNA. Annu. Rev. Phys. Chem. 2015;66:379–398. doi: 10.1146/annurev-physchem-040513-103605. [DOI] [PubMed] [Google Scholar]
- 3.Ratnaike R.N. Acute and chronic arsenic toxicity. Postgrad. Med. J. 2003;79:391–396. doi: 10.1136/pmj.79.933.391. [DOI] [PMC free article] [PubMed] [Google Scholar]
- 4.Tretyakova N.Y., Groehler A.t., Ji S. DNA-protein cross-links: formation, structural identities, and biological outcomes. Acc. Chem. Res. 2015;48:1631–1644. doi: 10.1021/acs.accounts.5b00056. [DOI] [PMC free article] [PubMed] [Google Scholar]
- 5.Yan L.L., Zaher H.S. How do cells cope with RNA damage and its consequences? J. Biol. Chem. 2019;294:15158–15171. doi: 10.1074/jbc.REV119.006513. [DOI] [PMC free article] [PubMed] [Google Scholar]
- 6.Reisz J.A., Bansal N., Qian J., Zhao W., Furdui C.M. Effects of ionizing radiation on biological molecules--mechanisms of damage and emerging methods of detection. Antioxid. Redox Signal. 2014;21:260–292. doi: 10.1089/ars.2013.5489. [DOI] [PMC free article] [PubMed] [Google Scholar]
- 7.Wang M., Dingler F.A., Patel K.J. Genotoxic aldehydes in the hematopoietic system. Blood. 2022;139:2119–2129. doi: 10.1182/blood.2019004316. [DOI] [PubMed] [Google Scholar]
- 8.O'Brien P.J., Siraki A.G., Shangari N. Aldehyde sources, metabolism, molecular toxicity mechanisms, and possible effects on human health. Crit. Rev. Toxicol. 2005;35:609–662. doi: 10.1080/10408440591002183. [DOI] [PubMed] [Google Scholar]
- 9.Garaycoechea J.I., Crossan G.P., Langevin F., Mulderrig L., Louzada S., Yang F., Guilbaud G., Park N., Roerink S., Nik-Zainal S., et al. Alcohol and endogenous aldehydes damage chromosomes and mutate stem cells. Nature. 2018;553:171–177. doi: 10.1038/nature25154. [DOI] [PMC free article] [PubMed] [Google Scholar]
- 10.Swenberg J.A., Moeller B.C., Lu K., Rager J.E., Fry R.C., Starr T.B. Formaldehyde carcinogenicity research: 30 years and counting for mode of action, epidemiology, and cancer risk assessment. Toxicol. Pathol. 2013;41:181–189. doi: 10.1177/0192623312466459. [DOI] [PMC free article] [PubMed] [Google Scholar]
- 11.Roswall N., Weiderpass E. Alcohol as a risk factor for cancer: existing evidence in a global perspective. J. Prev. Med. Public Health. 2015;48:1–9. doi: 10.3961/jpmph.14.052. [DOI] [PMC free article] [PubMed] [Google Scholar]
- 12.Walport L.J., Hopkinson R.J., Schofield C.J. Mechanisms of human histone and nucleic acid demethylases. Curr. Opin. Chem. Biol. 2012;16:525–534. doi: 10.1016/j.cbpa.2012.09.015. [DOI] [PubMed] [Google Scholar]
- 13.Burgos-Barragan G., Wit N., Meiser J., Dingler F.A., Pietzke M., Mulderrig L., Pontel L.B., Rosado I.V., Brewer T.F., Cordell R.L., et al. Mammals divert endogenous genotoxic formaldehyde into one-carbon metabolism. Nature. 2017;548:549–554. doi: 10.1038/nature23481. [DOI] [PMC free article] [PubMed] [Google Scholar]
- 14.Nagy K., Pollreisz F., Takáts Z., Vékey K. Atmospheric pressure chemical ionization mass spectrometry of aldehydes in biological matrices. Rapid Commun. Mass Spectrom. 2004;18:2473–2478. doi: 10.1002/rcm.1648. [DOI] [PubMed] [Google Scholar]
- 15.Heck H.D., Casanova-Schmitz M., Dodd P.B., Schachter E.N., Witek T.J., Tosun T. Formaldehyde (CH2O) concentrations in the blood of humans and Fischer-344 rats exposed to CH2O under controlled conditions. Am. Ind. Hyg. Assoc. J. 1985;46:1–3. doi: 10.1080/15298668591394275. [DOI] [PubMed] [Google Scholar]
- 16.Tong Z., Han C., Luo W., Wang X., Li H., Luo H., Zhou J., Qi J., He R. Accumulated hippocampal formaldehyde induces age-dependent memory decline. Age (Dordr) 2013;35:583–596. doi: 10.1007/s11357-012-9388-8. [DOI] [PMC free article] [PubMed] [Google Scholar]
- 17.Tong Z., Zhang J., Luo W., Wang W., Li F., Li H., Luo H., Lu J., Zhou J., Wan Y., et al. Urine formaldehyde level is inversely correlated to mini mental state examination scores in senile dementia. Neurobiol. Aging. 2011;32:31–41. doi: 10.1016/j.neurobiolaging.2009.07.013. [DOI] [PubMed] [Google Scholar]
- 18.Dingler F.A., Wang M., Mu A., Millington C.L., Oberbeck N., Watcham S., Pontel L.B., Kamimae-Lanning A.N., Langevin F., Nadler C., et al. Two aldehyde clearance systems are essential to prevent lethal formaldehyde accumulation in mice and humans. Mol. Cell. 2020;80:996–1012.e9. doi: 10.1016/j.molcel.2020.10.012. [DOI] [PMC free article] [PubMed] [Google Scholar]
- 19.Oka Y., Hamada M., Nakazawa Y., Muramatsu H., Okuno Y., Higasa K., Shimada M., Takeshima H., Hanada K., Hirano T., et al. Digenic mutations in ALDH2 and ADH5 impair formaldehyde clearance and cause a multisystem disorder, AMeD syndrome. Sci. Adv. 2020;6 doi: 10.1126/sciadv.abd7197. [DOI] [PMC free article] [PubMed] [Google Scholar]
- 20.Hodskinson M.R., Bolner A., Sato K., Kamimae-Lanning A.N., Rooijers K., Witte M., Mahesh M., Silhan J., Petek M., Williams D.M., et al. Alcohol-derived DNA crosslinks are repaired by two distinct mechanisms. Nature. 2020;579:603–608. doi: 10.1038/s41586-020-2059-5. [DOI] [PMC free article] [PubMed] [Google Scholar]
- 21.Semlow D.R., Walter J.C. Mechanisms of vertebrate DNA interstrand cross-link repair. Annu. Rev. Biochem. 2021;90:107–135. doi: 10.1146/annurev-biochem-080320-112510. [DOI] [PubMed] [Google Scholar]
- 22.Stingele J., Schwarz M.S., Bloemeke N., Wolf P.G., Jentsch S. A DNA-dependent protease involved in DNA-protein crosslink repair. Cell. 2014;158:327–338. doi: 10.1016/j.cell.2014.04.053. [DOI] [PubMed] [Google Scholar]
- 23.Stingele J., Bellelli R., Alte F., Hewitt G., Sarek G., Maslen S.L., Tsutakawa S.E., Borg A., Kjær S., Tainer J.A., et al. Mechanism and regulation of DNA-protein crosslink repair by the DNA-dependent metalloprotease SPRTN. Mol. Cell. 2016;64:688–703. doi: 10.1016/j.molcel.2016.09.031. [DOI] [PMC free article] [PubMed] [Google Scholar]
- 24.Vaz B., Popovic M., Newman J.A., Fielden J., Aitkenhead H., Halder S., Singh A.N., Vendrell I., Fischer R., Torrecilla I., et al. Metalloprotease SPRTN/DVC1 orchestrates replication-coupled DNA-protein crosslink repair. Mol. Cell. 2016;64:704–719. doi: 10.1016/j.molcel.2016.09.032. [DOI] [PMC free article] [PubMed] [Google Scholar]
- 25.Larsen N.B., Gao A.O., Sparks J.L., Gallina I., Wu R.A., Mann M., Räschle M., Walter J.C., Duxin J.P. Replication-coupled DNA-protein crosslink repair by SPRTN and the proteasome in Xenopus egg extracts. Mol. Cell. 2019;73:574–588.e7. doi: 10.1016/j.molcel.2018.11.024. [DOI] [PMC free article] [PubMed] [Google Scholar]
- 26.Maskey R.S., Kim M.S., Baker D.J., Childs B., Malureanu L.A., Jeganathan K.B., Machida Y., van Deursen J.M., Machida Y.J. Spartan deficiency causes genomic instability and progeroid phenotypes. Nat. Commun. 2014;5 doi: 10.1038/ncomms6744. [DOI] [PMC free article] [PubMed] [Google Scholar]
- 27.Lessel D., Vaz B., Halder S., Lockhart P.J., Marinovic-Terzic I., Lopez-Mosqueda J., Philipp M., Sim J.C., Smith K.R., Oehler J., et al. Mutations in SPRTN cause early onset hepatocellular carcinoma, genomic instability and progeroid features. Nat. Genet. 2014;46:1239–1244. doi: 10.1038/ng.3103. [DOI] [PMC free article] [PubMed] [Google Scholar]
- 28.Au P.C., Helliwell C., Wang M.B. Characterizing RNA-protein interaction using cross-linking and metabolite supplemented nuclear RNA-immunoprecipitation. Mol. Biol. Rep. 2014;41:2971–2977. doi: 10.1007/s11033-014-3154-1. [DOI] [PubMed] [Google Scholar]
- 29.Hafner M., Katsantoni M., Köster T., Marks J., Mukherjee J., Staiger D., Ule J., Zavolan M. CLIP and complementary methods. Nat. Rev. Methods Primers. 2021;1 doi: 10.1038/s43586-021-00018-1. [DOI] [Google Scholar]
- 30.Vind A.C., Genzor A.V., Bekker-Jensen S. Ribosomal stress-surveillance: three pathways is a magic number. Nucleic Acids Res. 2020;48:10648–10661. doi: 10.1093/nar/gkaa757. [DOI] [PMC free article] [PubMed] [Google Scholar]
- 31.Wu C.C., Peterson A., Zinshteyn B., Regot S., Green R. Ribosome collisions trigger General Stress responses to regulate cell fate. Cell. 2020;182:404–416.e14. doi: 10.1016/j.cell.2020.06.006. [DOI] [PMC free article] [PubMed] [Google Scholar]
- 32.Stoneley M., Harvey R.F., Mulroney T.E., Mordue R., Jukes-Jones R., Cain K., Lilley K.S., Sawarkar R., Willis A.E. Unresolved stalled ribosome complexes restrict cell-cycle progression after genotoxic stress. Mol. Cell. 2022;82:1557–1572.e7. doi: 10.1016/j.molcel.2022.01.019. [DOI] [PMC free article] [PubMed] [Google Scholar]
- 33.Vind A.C., Snieckute G., Blasius M., Tiedje C., Krogh N., Bekker-Jensen D.B., Andersen K.L., Nordgaard C., Tollenaere M.A.X., Lund A.H., et al. ZAKalpha recognizes stalled ribosomes through partially redundant sensor domains. Mol. Cell. 2020;78:700–713.e7. doi: 10.1016/j.molcel.2020.03.021. [DOI] [PubMed] [Google Scholar]
- 34.Pakos-Zebrucka K., Koryga I., Mnich K., Ljujic M., Samali A., Gorman A.M. The integrated stress response. EMBO Rep. 2016;17:1374–1395. doi: 10.15252/embr.201642195. [DOI] [PMC free article] [PubMed] [Google Scholar]
- 35.Joazeiro C.A.P. Mechanisms and functions of ribosome-associated protein quality control. Nat. Rev. Mol. Cell Biol. 2019;20:368–383. doi: 10.1038/s41580-019-0118-2. [DOI] [PMC free article] [PubMed] [Google Scholar]
- 36.Juszkiewicz S., Chandrasekaran V., Lin Z., Kraatz S., Ramakrishnan V., Hegde R.S. ZNF598 is a quality control sensor of collided ribosomes. Mol. Cell. 2018;72:469–481.e7. doi: 10.1016/j.molcel.2018.08.037. [DOI] [PMC free article] [PubMed] [Google Scholar]
- 37.Ikeuchi K., Tesina P., Matsuo Y., Sugiyama T., Cheng J., Saeki Y., Tanaka K., Becker T., Beckmann R., Inada T. Collided ribosomes form a unique structural interface to induce Hel2-driven quality control pathways. EMBO J. 2019;38 doi: 10.15252/embj.2018100276. [DOI] [PMC free article] [PubMed] [Google Scholar]
- 38.Narita M., Denk T., Matsuo Y., Sugiyama T., Kikuguchi C., Ito S., Sato N., Suzuki T., Hashimoto S., Machová I., et al. A distinct mammalian disome collision interface harbors K63-linked polyubiquitination of uS10 to trigger hRQT-mediated subunit dissociation. Nat. Commun. 2022;13 doi: 10.1038/s41467-022-34097-9. [DOI] [PMC free article] [PubMed] [Google Scholar]
- 39.Oltion K., Carelli J.D., Yang T., See S.K., Wang H.Y., Kampmann M., Taunton J. An E3 ligase network engages GCN1 to promote the degradation of translation factors on stalled ribosomes. Cell. 2023;186:346–362.e17. doi: 10.1016/j.cell.2022.12.025. [DOI] [PMC free article] [PubMed] [Google Scholar]
- 40.Gurzeler L.-A., Link M., Ibig Y., Schmidt I., Galuba O., Schoenbett J., Gasser-Didierlaurant C., Parker C.N., Mao X., Bitsch F., et al. 2023. Drug-induced eRF1 degradation promotes readthrough and reveals a new branch of ribosome quality control. [DOI] [PubMed] [Google Scholar]
- 41.Hafner M., Landthaler M., Burger L., Khorshid M., Hausser J., Berninger P., Rothballer A., Ascano M., Jr., Jungkamp A.C., Munschauer M., et al. Transcriptome-wide identification of RNA-binding protein and microRNA target sites by PAR-CLIP. Cell. 2010;141:129–141. doi: 10.1016/j.cell.2010.03.009. [DOI] [PMC free article] [PubMed] [Google Scholar]
- 42.Castello A., Fischer B., Eichelbaum K., Horos R., Beckmann B.M., Strein C., Davey N.E., Humphreys D.T., Preiss T., Steinmetz L.M., et al. Insights into RNA biology from an atlas of mammalian mRNA-binding proteins. Cell. 2012;149:1393–1406. doi: 10.1016/j.cell.2012.04.031. [DOI] [PubMed] [Google Scholar]
- 43.Trendel J., Schwarzl T., Horos R., Prakash A., Bateman A., Hentze M.W., Krijgsveld J. The human RNA-binding proteome and its dynamics during translational arrest. Cell. 2019;176:391–403.e19. doi: 10.1016/j.cell.2018.11.004. [DOI] [PubMed] [Google Scholar]
- 44.Liu J., Xu Y., Stoleru D., Salic A. Imaging protein synthesis in cells and tissues with an alkyne analog of puromycin. Proc. Natl. Acad. Sci. USA. 2012;109:413–418. doi: 10.1073/pnas.1111561108. [DOI] [PMC free article] [PubMed] [Google Scholar]
- 45.Yan L.L., Zaher H.S. Ribosome quality control antagonizes the activation of the integrated stress response on colliding ribosomes. Mol. Cell. 2021;81:614–628.e4. doi: 10.1016/j.molcel.2020.11.033. [DOI] [PMC free article] [PubMed] [Google Scholar]
- 46.Castello A., Horos R., Strein C., Fischer B., Eichelbaum K., Steinmetz L.M., Krijgsveld J., Hentze M.W. System-wide identification of RNA-binding proteins by interactome capture. Nat. Protoc. 2013;8:491–500. doi: 10.1038/nprot.2013.020. [DOI] [PubMed] [Google Scholar]
- 47.Perez-Perri J.I., Noerenberg M., Kamel W., Lenz C.E., Mohammed S., Hentze M.W., Castello A. Global analysis of RNA-binding protein dynamics by comparative and enhanced RNA interactome capture. Nat. Protoc. 2021;16:27–60. doi: 10.1038/s41596-020-00404-1. [DOI] [PMC free article] [PubMed] [Google Scholar]
- 48.Mordovkina D., Lyabin D.N., Smolin E.A., Sogorina E.M., Ovchinnikov L.P., Eliseeva I. Y-box binding proteins in mRNP assembly, translation, and stability control. Biomolecules. 2020;10 doi: 10.3390/biom10040591. [DOI] [PMC free article] [PubMed] [Google Scholar]
- 49.Baquero-Perez B., Antanaviciute A., Yonchev I.D., Carr I.M., Wilson S.A., Whitehouse A. The Tudor SND1 protein is an m(6)A RNA reader essential for replication of Kaposi's sarcoma-associated herpesvirus. eLife. 2019;8 doi: 10.7554/eLife.47261. [DOI] [PMC free article] [PubMed] [Google Scholar]
- 50.Frey S., Pool M., Seedorf M. Scp160p, an RNA-binding, polysome-associated protein, localizes to the endoplasmic reticulum of Saccharomyces cerevisiae in a microtubule-dependent manner. J. Biol. Chem. 2001;276:15905–15912. doi: 10.1074/jbc.M009430200. [DOI] [PubMed] [Google Scholar]
- 51.Pohl C., Dikic I. Cellular quality control by the ubiquitin-proteasome system and autophagy. Science. 2019;366:818–822. doi: 10.1126/science.aax3769. [DOI] [PubMed] [Google Scholar]
- 52.Michel M.A., Swatek K.N., Hospenthal M.K., Komander D. Ubiquitin linkage-specific affimers reveal insights into K6-linked ubiquitin signaling. Mol. Cell. 2017;68:233–246.e5. doi: 10.1016/j.molcel.2017.08.020. [DOI] [PMC free article] [PubMed] [Google Scholar]
- 53.Sugasawa K., Okuda Y., Saijo M., Nishi R., Matsuda N., Chu G., Mori T., Iwai S., Tanaka K., Tanaka K., et al. UV-induced ubiquitylation of XPC protein mediated by UV-DDB-ubiquitin ligase complex. Cell. 2005;121:387–400. doi: 10.1016/j.cell.2005.02.035. [DOI] [PubMed] [Google Scholar]
- 54.Pochopien A.A., Beckert B., Kasvandik S., Berninghausen O., Beckmann R., Tenson T., Wilson D.N. Structure of Gcn1 bound to stalled and colliding 80S ribosomes. Proc. Natl. Acad. Sci. USA. 2021;118 doi: 10.1073/pnas.2022756118. [DOI] [PMC free article] [PubMed] [Google Scholar]
- 55.Elia A.E., Boardman A.P., Wang D.C., Huttlin E.L., Everley R.A., Dephoure N., Zhou C., Koren I., Gygi S.P., Elledge S.J. Quantitative proteomic atlas of ubiquitination and acetylation in the DNA damage response. Mol. Cell. 2015;59:867–881. doi: 10.1016/j.molcel.2015.05.006. [DOI] [PMC free article] [PubMed] [Google Scholar]
- 56.Durcan T.M., Tang M.Y., Pérusse J.R., Dashti E.A., Aguileta M.A., McLelland G.L., Gros P., Shaler T.A., Faubert D., Coulombe B., et al. USP8 regulates mitophagy by removing K6-linked ubiquitin conjugates from parkin. EMBO J. 2014;33:2473–2491. doi: 10.15252/embj.201489729. [DOI] [PMC free article] [PubMed] [Google Scholar]
- 57.Rahmanto A.S., Blum C.J., Scalera C., Heidelberger J.B., Mesitov M., Horn-Ghetko D., Graf J.F., Mikicic I., Hobrecht R., Orekhova A., et al. K6-linked ubiquitylation marks formaldehyde-induced RNA–protein crosslinks for resolution. Mol Cell. 2023;83 doi: 10.1016/j.molcel.2023.10.011. [DOI] [PubMed] [Google Scholar]
- 58.Weickert P., Stingele J. DNA-protein crosslinks and their resolution. Annu. Rev. Biochem. 2022;91:157–181. doi: 10.1146/annurev-biochem-032620-105820. [DOI] [PubMed] [Google Scholar]
- 59.Gallina I., Hendriks I.A., Hoffmann S., Larsen N.B., Johansen J., Colding-Christensen C.S., Schubert L., Sellés-Baiget S., Fábián Z., Kühbacher U., et al. The ubiquitin ligase RFWD3 is required for translesion DNA synthesis. Mol. Cell. 2021;81:442–458.e9. doi: 10.1016/j.molcel.2020.11.029. [DOI] [PMC free article] [PubMed] [Google Scholar]
- 60.Ruggiano A., Vaz B., Kilgas S., Popović M., Rodriguez-Berriguete G., Singh A.N., Higgins G.S., Kiltie A.E., Ramadan K. The protease SPRTN and SUMOylation coordinate DNA-protein crosslink repair to prevent genome instability. Cell Rep. 2021;37 doi: 10.1016/j.celrep.2021.110080. [DOI] [PMC free article] [PubMed] [Google Scholar]
- 61.Stein K.C., Morales-Polanco F., van der Lienden J., Rainbolt T.K., Frydman J. Ageing exacerbates ribosome pausing to disrupt cotranslational proteostasis. Nature. 2022;601:637–642. doi: 10.1038/s41586-021-04295-4. [DOI] [PMC free article] [PubMed] [Google Scholar]
- 62.Wan L., Juszkiewicz S., Blears D., Bajpe P.K., Han Z., Faull P., Mitter R., Stewart A., Snijders A.P., Hegde R.S., Svejstrup J.Q. Translation stress and collided ribosomes are co-activators of cGAS. Mol. Cell. 2021;81:2808–2822.e10. doi: 10.1016/j.molcel.2021.05.018. [DOI] [PMC free article] [PubMed] [Google Scholar]
- 63.Borisova M.E., Wagner S.A., Beli P. Mass spectrometry-based proteomics for quantifying DNA damage-induced phosphorylation. Methods Mol. Biol. 2017;1599:215–227. doi: 10.1007/978-1-4939-6955-5_16. [DOI] [PubMed] [Google Scholar]
- 64.Michalski A., Damoc E., Hauschild J.P., Lange O., Wieghaus A., Makarov A., Nagaraj N., Cox J., Mann M., Horning S. Mass spectrometry-based proteomics using Q Exactive, a high-performance benchtop quadrupole Orbitrap mass spectrometer. Mol. Cell. Proteomics. 2011;10 doi: 10.1074/mcp.M111.011015. [DOI] [PMC free article] [PubMed] [Google Scholar]
- 65.Kelstrup C.D., Young C., Lavallee R., Nielsen M.L., Olsen J.V. Optimized fast and sensitive acquisition methods for shotgun proteomics on a quadrupole Orbitrap mass spectrometer. J. Proteome Res. 2012;11:3487–3497. doi: 10.1021/pr3000249. [DOI] [PubMed] [Google Scholar]
- 66.Olsen J.V., Macek B., Lange O., Makarov A., Horning S., Mann M. Higher-energy C-trap dissociation for peptide modification analysis. Nat. Methods. 2007;4:709–712. doi: 10.1038/nmeth1060. [DOI] [PubMed] [Google Scholar]
- 67.Veltri A.J., D'Orazio K.N., Lessen L.N., Loll-Krippleber R., Brown G.W., Green R. Distinct elongation stalls during translation are linked with distinct pathways for mRNA degradation. eLife. 2022;11 doi: 10.7554/eLife.76038. [DOI] [PMC free article] [PubMed] [Google Scholar]
- 68.McGlincy N.J., Ingolia N.T. Transcriptome-wide measurement of translation by ribosome profiling. Methods. 2017;126:112–129. doi: 10.1016/j.ymeth.2017.05.028. [DOI] [PMC free article] [PubMed] [Google Scholar]
- 69.Dobin A., Davis C.A., Schlesinger F., Drenkow J., Zaleski C., Jha S., Batut P., Chaisson M., Gingeras T.R. STAR: ultrafast universal RNA-seq aligner. Bioinformatics. 2013;29:15–21. doi: 10.1093/bioinformatics/bts635. [DOI] [PMC free article] [PubMed] [Google Scholar]
- 70.Cox J., Mann M. MaxQuant enables high peptide identification rates, individualized p.p.b.-range mass accuracies and proteome-wide protein quantification. Nat. Biotechnol. 2008;26:1367–1372. doi: 10.1038/nbt.1511. [DOI] [PubMed] [Google Scholar]
- 71.Ritchie M.E., Phipson B., Wu D., Hu Y., Law C.W., Shi W., Smyth G.K. limma powers differential expression analyses for RNA-sequencing and microarray studies. Nucleic Acids Res. 2015;43 doi: 10.1093/nar/gkv007. [DOI] [PMC free article] [PubMed] [Google Scholar]
- 72.Hornbeck P.V., Zhang B., Murray B., Kornhauser J.M., Latham V., Skrzypek E. PhosphoSitePlus, 2014: mutations, PTMs and recalibrations. Nucleic Acids Res. 2015;43:D512–D520. doi: 10.1093/nar/gku1267. [DOI] [PMC free article] [PubMed] [Google Scholar]
- 73.Wiredja D.D., Koyutürk M., Chance M.R. The KSEA App: a web-based tool for kinase activity inference from quantitative phosphoproteomics. Bioinformatics. 2017;33:3489–3491. doi: 10.1093/bioinformatics/btx415. [DOI] [PMC free article] [PubMed] [Google Scholar]
Associated Data
This section collects any data citations, data availability statements, or supplementary materials included in this article.
Supplementary Materials
Log2 intensities of RNA-crosslinked proteins isolated using XRNAX from cells treated with formaldehyde (FA) or PAR-CL (4-SU+UVA) or from untreated control (Ctrl) cells. Three biological replicates were measured per condition.
Statistical test results of phospho-site changes in all comparisons between untreated HAP1 AAVS1 cells (Ctrl) or after PAR-CL treatment (4-SU+UVA) and ZAK KO cells treated with PAR-CL (4-SU+UVA_ZAK) returned by limma. Four biological replicates were measured.
Normalized log2 intensities of all phospho-sites detected in untreated HAP1 AAVS1 cells (Ctrl) or after PAR-CL treatment (4-SU+UVA) and in ZAK KO cells treated with PAR-CL (4-SU+UVA_ZAK). Four biological replicates were measured per condition.
KSEA-App output table. Kinase-substrate enrichment scores based on significant hits in untreated vs. PAR-CL-treated cells (4-SU+UVA).
Log2 intensities of mRNA-crosslinked proteins isolated using polyA-PD from cells harvested after treatment with 4-SU alone (4-SU), UVA alone (UVA), 4-SU+UVA (4-SU+UVA_0H), and from untreated cells (Ctrl). Sorted by average log2 intensity. Three biological replicates were measured.
Statistical test results of comparisons of mRNA-crosslinked proteins isolated using polyA-PD between different time points (0 h, 0.5 h, and 1 h) after either PAR-CL (4-SU+UVA) treatment alone or including a pre-treatment with Ub-E1-inhibitor (Ub-E1i) returned by limma, and normalized LFQ intensities of PAR-CL-induced mRNA-crosslinked proteins isolated using polyA-PD at different time points (0, 0.5, and 1 h); treated either with PAR-CL (4-SU+UVA) alone or including a pre-treatment with Ub-E1-inhibitor (4-SU+UVA_E1). Four biological replicates were measured.
Statistical test results of comparisons of mRNA-crosslinked proteins isolated using polyA-PD between different time points (0, 0.5, and 1 h) after either PAR-CL (4-SU+UVA) treatment alone or including a pre-treatment with proteasome inhibitor (MG132) returned by limma, and normalized LFQ intensities of PAR-CL-induced mRNA-crosslinked proteins isolated using polyA-PD at different time points (0, 0.5, and 1 h); treated either with PAR-CL (4-SU+UVA) alone or including a pre-treatment with proteasome inhibitor MG132 (4-SU+UVA_MG132). Four biological replicates were measured.
Statistical test results of comparisons of mRNA-crosslinked proteins isolated using polyA-PD between different time points (0, 0.5, and 1 h) after either PAR-CL (4-SU+UVA) treatment alone or including a pre-treatment with translation inhibitor anisomycin (ANS) returned by limma, and normalized LFQ intensities of PAR-CL-induced mRNA-crosslinked proteins isolated using polyA-pull-down at different time points (0, 0.5, and 1 h); treated either with PAR-CL (4-SU+UVA) alone or including pre-treatment with translation inhibitor anisomycin (4-SU+UVA_ANS). Four biological replicates were measured.
Sequences of all gRNAs used in this study.
Statistical test results of comparisons of mRNA-crosslinked proteins isolated using polyA-PD between different time points (0, 0.5, and 1 h) after PAR-CL (4-SU+UVA) treatment either in AAVS1 control or RNF14 KO cells returned by limma, and normalized LFQ intensities of PAR-CL-induced mRNA-crosslinked proteins isolated using polyA-PD at different time points (0, 0.5, and 1 h) either from AAVS1 control or RNF14 KO cells. Four biological replicates were measured.
Data Availability Statement
-
•
Original western blot images have been deposited at Mendeley and are publicly available as of the date of publication. The mass spectrometry data reported in this manuscript were deposited to the ProteomeXchange Consortium (www.proteomexchange.org,) via the Proteomics Identification Database (PRIDE) partner repository and are publicly available as of the date of publication. Data shown in Figures 1F, 1G, 4C, 5A, 5B, 5D, 5E, 6A, 6B, S4A, S4B, S4E, S5B, S5C, and S5F–S5H were deposited with the dataset identifiers PXD038332 for all data sets; Data shown in Figures 2A and 2B reported in this manuscript were deposited with the dataset identifier PXD038398. RNA-seq data (Figures 3C–3E, S3C, and S5K) have been deposited in the GEO under accession code GSE240136. All identifiers and accession codes are listed in the key resources table.
-
•
All original code for the analysis of ribosome profiling data has been deposited at Zenodo and is publicly available as of the date of publication. DOI is listed in the key resources table.
-
•
Any additional information required to reanalyze the data reported in this paper is available from the lead contact upon request.