

Abstract
Background
Vaso-occlusive episodes (VOC) cause debilitating pain and are a common cause of emergency department (ED) visits, for people with sickle cell disease (SCD). Strategies for achieving optimal pain control vary widely despite evidence-based guidelines. We tested existing guidelines and hypothesized a patient-specific protocol (PSP) written by their SCD provider, may be more effective than weight-based (WB) dosing of parenteral opiate medication, in relieving pain.
Methods
Prospective, randomized controlled trial comparing a PSP versus WB protocol for patients presenting with VOC to six EDs. Patients were randomized to a PSP or WB protocol prior to an ED visit. SCD provider wrote their protocol and placed in the electronic health record for future ED visits with a VOC Exclusion criteria included: pre-existing PSP excluding parenteral opioid analgesia or out-patient use of buprenorphine or methadone, or highly suspected for COVID-19. Pain intensity scores, side effects and safety were obtained every 30 minutes for up to 6 hours post-ED bed placement. The primary outcome was change in pain intensity score from placement in an ED space to disposition or six hours.
Results
328 subjects were randomized, 104 participants enrolled (ED visit, target n=230) with complete data for 96 visits. The study was unable to reach the target sample size and stopped early due to the impact of COVID-19. We found no significant differences between groups in the primary outcome; patients randomized to a PSP had a shorter ED length of stay (p=.008); the prevalence of side effects was low in both groups. Subjects in both groups experienced both a clinically meaningful and statistically significant decrease in pain (27 mm on a 0–100 mm scale)
Conclusions
We found a shorter ED length of stay for patients assigned to a PSP. Patients in both groups experienced good pain relief without significant side effects.
INTRODUCTION
Background
Individuals with sickle cell disease (SCD) frequently experience acute pain often referred to as vaso-occlusive crises (VOC); it is the most common complication experienced throughout an individual’s with SCD lifetime. This pain is believed to be caused by tissue ischemia resulting from acute microvascular occlusions and can be severe and debilitating enough to require immediate treatment in an emergency department (ED). Evidence-based recommendations on the treatment of VOC exist and include rapid, aggressive treatment of pain with opioids to improve pain1,2 However, there is a long history of provider and patient dissatisfaction with VOC management. Patients often report inadequate or delayed treatment of pain, 3 and ED providers (including physicians, nurses and advanced practice providers) report not believing patients are experiencing severe sickle cell pain that warrants opioid analgesia.4 ED providers often express frustration in providing care to individuals with SCD due to varying responses to analgesia regimens that appear to require doses higher than seen with other patients and due to the frequent ED visits for some individuals with SCD. ED providers are often unaware of evidence-based guidelines for the treatment of VOC.4
In 2014, the National Heart, Lung and Blood Institute (NHLBI) published recommendations for the treatment of SCD, including rapid treatment of painful VOC with parenteral opioids, using individualized pain plans when possible. In 2020, the American Society of Hematology also recommended tailored opioid therapy, considering baseline opioid therapy and previously effective doses. Among the recommendations for rapid assessment, treatment, and re-administration of opioids for unrelieved pain, a core component was the use of patient-specific pain protocols (PSPs) when possible and use of a sickle cell disease (SCD)-specific protocol when PSPs are not available.2 These PSPs would be developed by the patient’s SCD provider and made available to ED providers via the electronic health record. Ideally, PSPs should provide direction on pain management (e.g., medication type and dosing recommendations) which may bolster ED provider confidence in determining a dose, especially if large doses are needed.
However, using GRADE methodology, the level of evidence for PSPs was rated as low certainty due to lack of evidence about effects in the ASH guidelines.1 In addition, the creation of PSPs requires ongoing commitment and effort from the SCD provider to develop and keep the pain plans updated. Many hospitals do not have a dedicated SCD program and associated SCD providers who are available to write these plans for individuals with SCD. Due to these barriers and the need to establish a standardized approach to managing SCD VOC that is acceptable to both the patients and the treating providers, we conducted and previously reported results from a two-site pilot randomized control trial (RCT) comparing pain relief between patients randomized to a PSP vs. a standard (defined as weight-based) SCD opioid analgesia protocol.5 Patients assigned to a PSP protocol reported a statistically and clinically significant greater reduction in pain than those assigned to the weight-based opioid protocol, as well as a trend towards lower rates of hospital admission and a quicker reduction in pain5,6. This study was conducted in only two ED’s with 52 different patients contributing data for a total of 126 ED visits.
Goals
To improve generalizability and strengthen the level of evidence, we conducted a multicenter RCT to compare PSP vs. weight-based opioid protocols, hypothesizing that individuals randomized to receive the patient-specific protocol would experience greater reductions in pain intensity scores. We also report side effects and safety of both protocols.
METHODS
Study Design and Ethics statement
We previously reported the design of this trial.7 Briefly, we conducted a phase III, multi-center, single-blinded RCT (registered in Clintrials.gov with identifier NCT03933397). The study was approved by a single IRB (sIRB), Duke University, and each participating site.
Study Setting and Participants
Six academic sites were selected based upon the following criteria: 1) minimum average of two ED visits/day by patients with SCD for treatment of VOC; 2) hematologist willing to randomize their patients with SCD to either a weight-based or PSP for treatment of VOC in the ED, and capacity to write PSPs as needed; 3) informatics support to post the protocols in the electronic health record (EHR); and 4) infrastructure that could support both enrollment of subjects and prospective data collection in the ED. An attempt to include sites with broad geographic representation across the US was made. Six sites were included from the following states: Ohio, Michigan (n=2), Texas, Maryland, and North Carolina.
Population for randomization
Adults ages 18 and older with the following genotypes were eligible for inclusion: SS, SC, Sβ0, and Sβ+. Patients were excluded if they had sickle cell trait, if they had a PSP that excluded the use of intravenous opioids (i.e., oral opioids only) in the ED for treatment of VOC, or if they were prescribed methadone or buprenorphine to treat pain. Initially, most participants were consented in SCD clinic, although some were consented at the end of an ED visit for participation during a future ED visit, should one occur. With the onset of the COVID-19 pandemic in March 2020, study teams contacted patients by phone to obtain consent either verbally or written (via mail), per institutional protocol. Consent and randomization prior to the ED visit were needed for the following reasons: 1) inability to obtain consent during a painful VOC (too ill), and 2) time needed by the SCD provider to write a PSP or determine the weight-based dose of pain medication and make it available in the electronic health record (EHR). Subjects consented to receiving either the weight based or PCP and were not aware of their randomization group at any time, however they were informed of the drug and dose they would receive. Subjects who were randomized but not enrolled at an ED visit were terminated from the study at the end of enrollment period and not included in the final analysis. (Figure 1)
Figure 1. Consort Diagram.
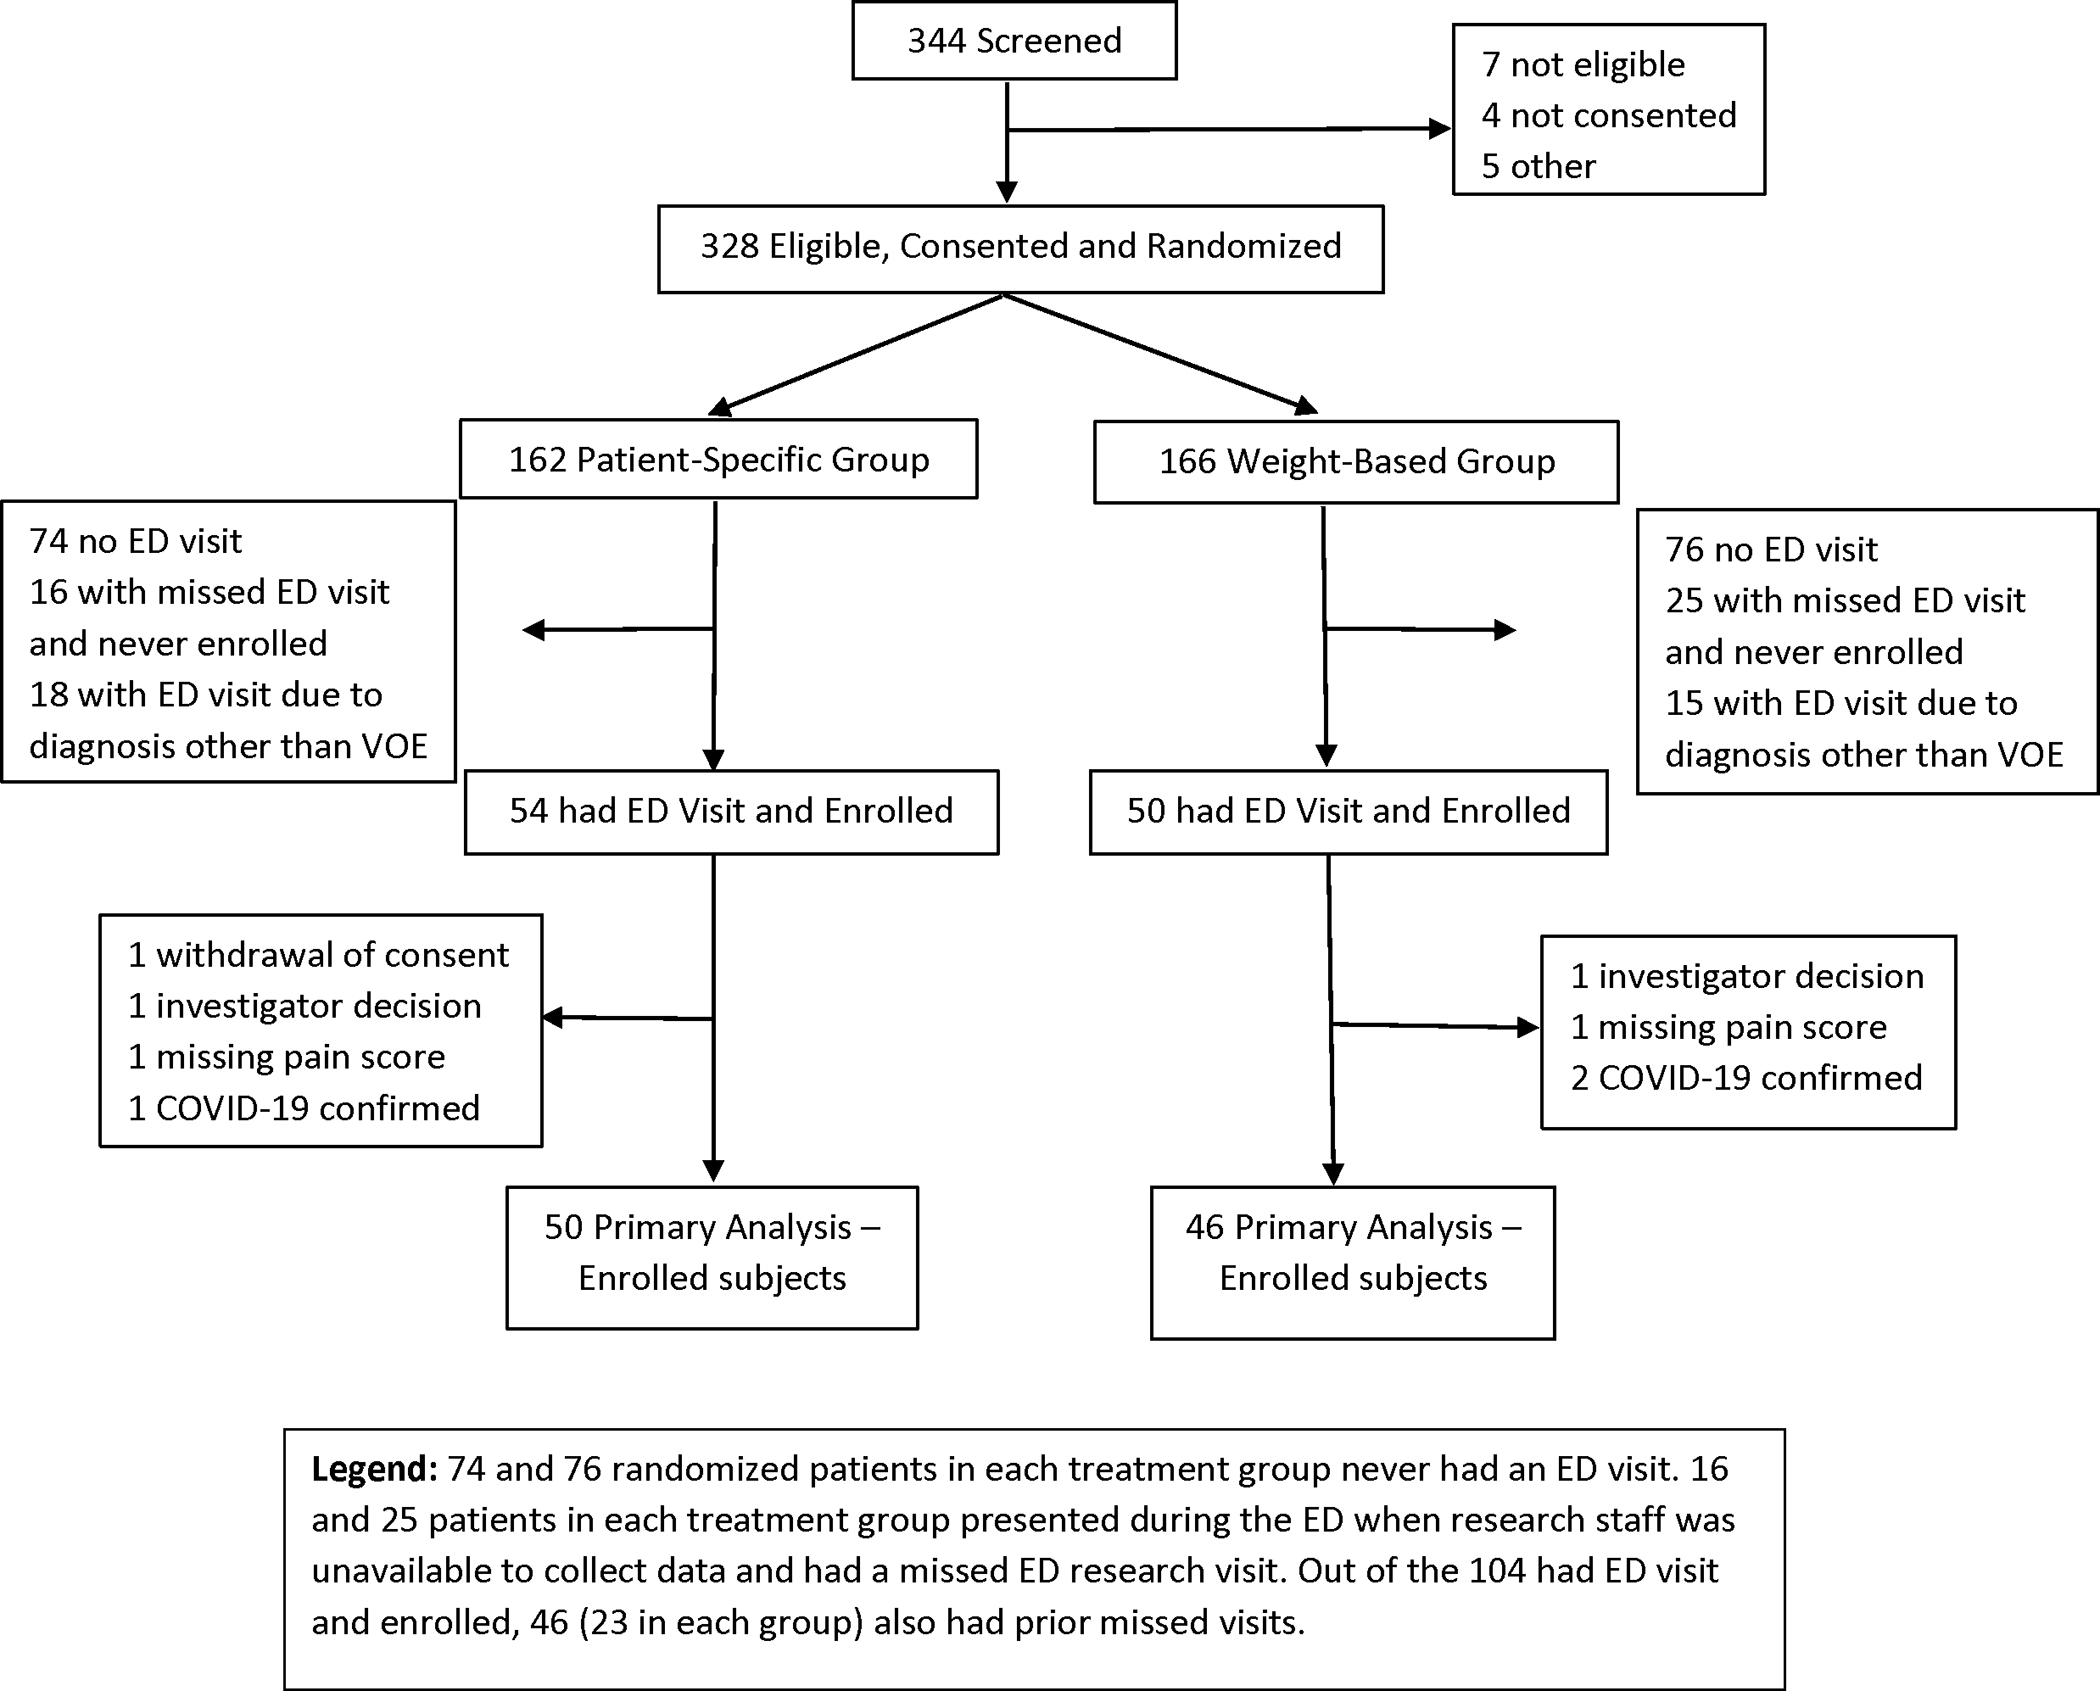
74 and 76 randomized patients in each treatment group never had an ED visit. 16 and 25 patients in each treatment group presented during the ED when research staff was unavailable to collect data and had a missed ED research visit. Out of the 104 had ED visit and enrolled, 46 (23 in each group) also had prior missed visits.
Population for Enrollment (ED visit criteria, primary outcome assessment)
Randomized patients who presented to an ED for VOC requiring parenteral opioids were eligible for enrollment in this trial. Exclusion criteria included presentation for other complications (e.g., acute chest pain or stroke). Suspected or confirmed COVID-19 was added as an exclusion criterion, as the pandemic started six months after study enrollment began, with the rationale that COVID-19 may affect the pain experience.8 Unless COVID-19 was highly suspected at the time of the ED visit, data was collected per protocol. Following an enrollment visit, study staff reviewed the medical record to identify participants diagnosed with COVID-19 during hospitalization; the data from any participant diagnosed with COVID-19 were not included in the primary outcome analysis per amended study protocol. Data from only one ED visit was collected for each enrolled subject. After the ED visit, the study developed PSP was to be removed from the electronic health record.
Study Procedures
Baseline data were collected at the time of consent and randomization, including completion of a demographics survey and medical history. The medical history included the pain medications usually taken by the subject on a day when experiencing severe pain. This information was given to the SCD provider to aid in writing the PSP.
Pain protocols were written by the patient’s SCD provider and consisted of similar data elements (e.g., route, monitoring, repeat dosing every 20–30 minutes), based on NHLBI recommendations (Supplemental Table 1).2 All morphine and hydromorphone doses were ordered in 2 mg and 0.5 mg increments respectively to avoid the need for the nurse to need to waste excess volumes of medication. The only difference between study arms was in the determination of the initial dose used in the ED which was based on home long and short acting opioid use. The initial dose ordered for the PSP is reported in Table 4. For those randomized to weight-based dosing arm, doses were determined using weight ranges. For those randomized to a PSP, the SCD provider used a calculator developed by the study team’s pain and SCD experts with experience in writing PSPs (JJS, JP, PLK) to determine the initial opioid analgesic and dose. Between one to two SCD providers at each site were responsible for working with the study team to use the calculator and develop the PSP’s. There was minimal turnover or refusal to participate from this group. If a new SCD provider joined the study site they were oriented to the calculator and worked with the study team to ensure comfort with calculating doses. The calculator converted the patient-reported home opioids (long- and short-acting) taken in a 24-hour period for severe pain to a first parental dose in the ED. This dose was then reconciled with past ED doses. If the dose determined by the calculator exceeded the last dose received in the ED by 10%, the doses were discussed and adjudicated with the site’s study team expert. If the proposed dose from the calculator was less than a weight-based dose, the weight-based dose was used. The first three plans at each site were reviewed by one of these experts, who was also available for consultation throughout the project; additional consultations rarely occurred. However, the experts provided booster refresher sessions with each site’s SCD providers as needed after COVID-19 research restrictions relaxed and sites were again able to enroll new subjects and write PSPs. Once the subject’s protocol (PSP or weight-based) was written, the research team ensured that the protocol was uploaded to the EHR and made visible to the ED provider. All ED providers were informed of the study and how to access the subject’s PSP protocol in the EHR. While they were encouraged to follow the protocols, the ED treating provider ultimately decided what medications were administered. We measured adherence to the protocol.
Table 4.
ED Analgesics Given, Initial Analgesic Order Protocol by SCD Provider, and ED Provider Adherence to Protocols
| Patient-Specific N=50 | Weight-Based N=46 | P-value | |
|---|---|---|---|
|
| |||
| Actual Total ED Analgesic Dose Delivered in IV MME | 50 | 46 | 0.146 |
| Mean (S.D.) | 35.5 (29.31) | 39.4 (27.96) | |
| Median (25th, 75th) | 21.0 (16.0, 41.7) | 32.5 (23.3, 46.7) | |
| Min, Max | 3.0, 133.3 | 6.7, 140.0 | |
| First Dose Ordered by hematologist/SCD provider | 50 | 46 | 0.683 |
| Mean (S.D.) | 10.4 (6.92) | 9.2 (2.47) | |
| Median (25th, 75th) | 6.7 (6.7, 13.3) | 10.0 (6.7, 10.0) | |
| Min, Max | 3.3, 33.3 | 4.0, 13.3 | |
| First Dose Administered | 50 | 46 | 0.402 |
| Mean (S.D.) | 10.3 (7.22) | 9.5 (2.83) | |
| Median (25th, 75th) | 6.7 (6.7, 13.3) | 10.0 (6.7, 10.0) | |
| Min, Max | 1.0, 33.3 | 4.0, 15.0 | |
| Study drug name assigned by protocol | |||
| Morphine sulfate, n (%) | 8 (16.0%) | 9 (19.6%) | 0.648 |
| Hydromorphone, n (%) | 46 (92.0%) | 38 (82.6%) | 0.165 |
| Others, n(%) | 6 (12.0%) | 7 (15.2%) | |
| 1st dose route administered | |||
| IV, n (%) | 50 (100.0%) | 45 (97.8%) | 0.295 |
| IM, n (%) | 0 | 1 (2.2%) | 0.479 |
| Adherence to analgesic protocol (per visit) – Dose 1 | |||
| Adherence: Dose 1 in IV MME (Administered Dose 1 – Ordered Dose 1) | 50 | 46 | 0.274 |
| Mean (S.D.) | −0.1 (2.89) | 0.4 (2.13) | |
| Median (25th, 75th) | 0.0 (0.0, 0.0) | 0.0 (0.0, 0.0) | |
| Min, Max | −9.3, 13.3 | −6.7, 9.0 | |
| Adherence: Medication name, n (%) | 45 (90.0%) | 44 (95.7%) | 0.287 |
| Adherence: Route (IV or IM), n (%) | 47 (94.0%) | 45 (97.8%) | 0.349 |
When randomized patients presented to the ED, research staff were alerted for potential enrollment. ED data collection began when the patient met enrollment criteria (i.e., visit was for VOC with no strong suspicion of COVID-19) and was placed in a treatment space (i.e., not upon arrival). During the ED visit, the research staff obtained pain intensity scores, vital signs, and safety measurements every 30 minutes until one of the following were met, whichever came first: 1) decision to discharge home, 2) decision to admit to the hospital or assigned observation status for continued pain management, or 3) after six hours of treatment for VOC. A ten-minute window was allowed for each 30-minute data collection point; if the patient was unavailable (e.g., in radiology), the data for that time point was considered missing.
Pain intensity scores were initially to be measured using a 0–100 millimeter (mm) visual analog scale (VAS); however, during the COVID-19 pandemic, one site removed paper forms from the ED as an infection control measure. The protocol was amended in August 2020 to add collection of a 0–100 verbal numerical rating scale (NRS). All sites were asked to obtain both a VAS (if possible) and a verbal NRS, collecting the VAS first. Research assistants (RA) were also trained to assess vital signs and side effects (e.g., nausea, vomiting, or itching) from the patient every 30 minutes. Sedation was also assessed at these data collection points using the Pasero Opioid-Induced Sedation Scale (scored from 0–4, with four indicating minimal or no response to verbal or physical stimulation).9,10 After completion of study visit, research staff collected data on all opioids and non-opioids, doses, routes, and timing of administration. All opioid doses were converted to intravenous morphine milligram equivalents (IV MME).
Outcome Measures
The primary study endpoint was the change in pain intensity score from placement in an ED treatment space to disposition decision or a maximum treatment duration of 6 hours, whichever came first, with a clinically meaningful change defined as 14 mm on VAS or 14 on verbal NRS (if VAS was unavailable). This difference has been previously determined to be associated with a clinically meaningful decrease in pain in ED’s,11,12 and in the ED with SCD13 Secondary endpoints included side effects, safety, ED length of stay, hospital admission for pain control, and health care utilization for pain (ED re-visit, hospitalization, or day hospital visit) within seven days of study visit.
Statistical Analysis
As reported in the protocol paper for this trial,7 we planned to randomize 460 participants to provide a sample size of 230 enrolled participants with ED visits. This sample size provided 90% power to detect a clinically significant difference of 14 units in change of pain intensity scores between the two groups with 0.05 type I error. The sample size calculation was based on t-test with assumptions drawn from the pilot study, observing the same standard deviation (SD) of 31 in change of pain intensity score in the two groups while accounting for 10% missing data rate on the change of pain intensity score.5 With a total of 104 subjects enrolled due to COVI9–19 impact, we have only 58% power to detect the same clinically significant difference with the same assumptions.
Descriptive statistics were used to summarize sociodemographic and clinical characteristics for all enrolled participants by randomized groups. Means, standard deviations, medians, 25th and 75th percentiles, minimum and maximum were calculated for continuous variables; the number and frequency of patients in each category were compiled for nominal variables. To examine whether those enrolled with an ED visit differ from those who were not enrolled when the enrollment period ended, comparisons of these characteristics between groups with and without recorded ED visits were performed. Chi-square test (or Fisher Exact test if low frequencies) was used for categorical variables and Wilcoxon rank sum test was used for continuous variables in comparisons between the two groups.
Linear regression was used to analyze the primary outcome, with change in pain intensity score as the dependent variable to assess the treatment effect of the pain plan randomized (weight-based vs PSP) and adjusting for the pre-specified covariates, namely initial pain intensity score at ED time of placement in a treatment area, SCD genotype, and subject age and gender. Sensitivity analyses with the best and worst scenarios were planned to examine impact of departure from the missing at random assumptions on the treatment effect, where the worst scenario is to impute the missing pain intensity score change to be zero for the PSP patients and observed maximum pain change for the weight-based patients and the reverse is used for the best scenario.
The same linear regression approach was also planned for the secondary outcome of the ED length of stay, measured from ED arrival to discharge, to assess the treatment effect. All other secondary outcomes were binary, therefore, a chi-square test or Fisher exact test (if frequency is below 5 or less) was performed to compare the two groups. The following a-priori sub-group analyses were planned based on sub-groups defined by sex, age (≥ or < 30 years), genotype (SS/SB0 vs. SC/SB+), route (IV or subcutaneous [SC]), and administration of non-steroidal anti-inflammatory drugs (yes or no).
Various side effects, adverse events (AE) or serious adverse events (SAE) were summarized with frequency and percent within the two groups. SAEs specific to this protocol included respiratory depression requiring naloxone administration within two hours of last administration of a pain protocol drug, death, life-threatening complications, admission to the intensive care unit, or intubation within seven days of first administration of pain protocol during the enrollment ED visit. A chi-square, Fisher’s exact, or other appropriate two-sample methods were used for comparison of the safety data between the groups. SAS version 9.4 was used for all data analyses. A p-value of 0.05 or less was considered statistically significant.
RESULTS
We screened 344 patients, randomized and consented 328 patients, of which 104 enrolled during an ED visit and had data collection, and 96 patients provided primary outcome measures (Figure 1). We began patient randomization and consent in August 2019, and ED enrollment and data collection in November 2019. In March 2020, due to the COVID-19 pandemic, all sites closed to both randomization and enrollment of new subjects for a minimum of six months; one site was shut down for 17 months. Due to the continued low rate of ED visits and data collection, the Data Safety Monitoring Board (DSMB), in collaboration with the study investigators and the NHLBI determined the trial would be stopped early, mid-May of 2022 when 328 subjects were randomized and 104 were enrolled. Out of 224 randomized but not enrolled subjects, 136 subjects did not have an ED visit, 55 had ED visits but were missed (mostly due to arrival at late night or early morning hours), and 33 had ED visits with a chief complaint other than VOC or the ED providers were highly suspicious for COVID-19 (Figure 1).
The final enrolled sample had a mean age of 30.3 years, was 62% female, 98% African American/Black, and 74% had SS or Sβ0 genotype (Table 1). There were no differences in demographic or clinical characteristics between assigned treatment protocols in the enrolled samples (N=104) and in those with primary outcome data (N=96, Supplemental Table 2). There were no significant differences in demographic or clinical characteristics of randomized subjects between those enrolled as compared to not enrolled except in history of acute chest syndrome (ACS) and retinopathy (Supplemental Table 3). More individuals with ACS were enrolled and had an ED visit which is expected and indicates a higher disease severity. Fewer patients with retinopathy had ED visits, however the reasons for this are unclear. Such few differences in characteristics implies that the enrolled patients are reasonable representation of the randomized patients.
Table 1.
Demographic and Clinical Characteristics
| Patient-Specific Protocol (Individualized) N=54 | Weight-Based N=50 | Total Enrolled with ED Study Visit N=104 | P-value | |
|---|---|---|---|---|
|
| ||||
| Demographic | ||||
| Age | 0.167 | |||
| Mean (S.D.) | 31.3 (8.63) | 29.3 (8.28) | 30.3 (8.48) | |
| Median (25th, 75th percentile) | 29.0 (25.0, 37.0) | 27.0 (24.0, 33.0) | 28.0 (24.0, 35.0) | |
| Age <30 | 28/54 (51.9%) | 31/50 (62.0%) | 59/104 (56.7%) | |
| Age >=30 | 26/54 (48.1%) | 19/50 (38.0%) | 45/104 (43.3%) | |
| Gender | 0.320 | |||
| Male | 18/54 (33.3%) | 21/49 (42.9%) | 39/103 (37.9%) | |
| Female | 36/54 (66.7%) | 28/49 (57.1%) | 64/103 (62.1%) | |
| Ethnicity | 0.496 | |||
| Hispanic | 2/54 (3.7%) | 0 | 2/103 (1.9%) | |
| Not Hispanic or Latino | 52/54 (96.3%) | 49/49 (100.0%) | 101/103 (98.1%) | |
| Race | 1.000 | |||
| African American/Black | 53/54 (98.1%) | 48/49 (98.0%) | 101/103 (98.1%) | |
| Others | 1/54 (1.9%) | 1/49 (2.0%) | 2/103 (1.9%) | |
| Clinical Genotypes | 0.366 | |||
| SS, SB0 | 42/54 (77.8%) | 35/50 (70.0%) | 77/104 (74.0%) | |
| SC, SB+ | 12/54 (22.2%) | 15/50 (30.0%) | 27/104 (26.0%) | |
| Weight (kg) | 0.785 | |||
| Mean (S.D.) | 73.8 (16.63) | 74.2 (16.49) | 74.0 (16.49) | |
| Median (25th, 75th percentile) | 72.0 (59.0, 90.0) | 72.9 (63.0, 83.0) | 72.3 (61.1, 86.3) | |
| Leg Ulcers | 3/53 (5.7%) | 2/50 (4.0%) | 5/103 (4.9%) | 1.000 |
| Pulmonary Hypertension | 10/51 (19.6%) | 6/48 (12.5%) | 16/99 (16.2%) | 0.337 |
| Acute Chest Syndrome | 39/53 (73.6%) | 35/48 (72.9%) | 74/101 (73.3%) | 0.940 |
| Retinopathy | 2/53 (3.8%) | 4/49 (8.2%) | 6/102 (5.9%) | 0.424 |
| Stroke | 11/50 (22.0%) | 8/50 (16.0%) | 19/100 (19.0%) | 0.444 |
| TIA (transient ischemic attack) | 3/49 (6.1%) | 1/49 (2.0%) | 4/98 (4.1%) | 0.617 |
| Avascular Necrosis | 22/53 (41.5%) | 17/47 (36.2%) | 39/100 (39.0%) | 0.585 |
| Kidney Dysfunction | 2/51 (3.9%) | 5/50 (10.0%) | 7/101 (6.9%) | 0.269 |
| Heart Failure | 3/52 (5.8%) | 1/50 (2.0%) | 4/102 (3.9%) | 0.618 |
| Gallbladder Disease | 18/52 (34.6%) | 15/50 (30.0%) | 33/102 (32.4%) | 0.618 |
| Seizure | 8/50 (16.0%) | 4/50 (8.0%) | 12/100 (12.0%) | 0.357 |
| Liver Dysfunction | 3/52 (5.8%) | 0 | 3/102 (2.9%) | 0.243 |
| Baseline Paine Score | N=53 | N=50 | N=103 | 0.942 |
| Mean (S.D.) | 78.0 (18.03) | 79.8 (13.44) | 78.9 (15.92) | |
| Median (25th, 75th percentile) | 80.0 (70.0, 94.0) | 80.0 (70.0, 90.0) | 80.0 (70.0, 92.0) | |
While some patients had a verbal NRS pain intensity score, all patients had VAS pain intensity scores and thus the VAS pain intensity score was used in all analyses. There was no significant difference between treatment groups, with an adjusted mean difference of 0.67 mm (95% confidence interval (CI): −10.91, 12.25) in the primary endpoint of change in pain intensity score with adjusted P value = 0.909 (unadjusted univariate P value = 0.921) (Table 2). With low missing data and few patients with later confirmed COVID-19, similar results were observed in the sensitivity analyses with N=104 subjects that included the 3 later confirmed COVID-19 subjects, best-case or worst-case scenarios accounting for missing data (P value from these sensitivity analyses ranges from 0.451 to 0.879). Multiple imputation method was not carried out due to lower than 5% missing data. The mean improvement in pain intensity scores in both groups was approximately 27 mm. There were no significant differences between the two groups in two exploratory binary outcomes, 1) those with ≥ 14 mm change in VAS pain intensity score and 2) those with ≥ 30% reduction in pain intensity score from arrival to discharge. Figure 2 depicts pain intensity scores over time between groups. Both groups started with the same median pain intensity score of 80 mm at the time of ED bed placement and appeared to have the greatest reduction in pain intensity at 180 minutes. Planned sub-group analyses also indicated that differential treatment effect between the two groups was not detected in pre-specified subgroups defined by sex, age (≥ or < 30 years), genotype (SS/SB0 vs. SC/SB+), and administration of non-steroidal anti-inflammatory drugs (yes or no) with interaction P value ranging from 0.194 to 0.873. The sub-group analysis based on route was not performed because all patients except one had IV route.
Table 2.
Primary Outcome and Secondary Endpoints, Vital Signs and Safety Data
| Patient-Specific N=50 | Weight-Based N=46 | P-value | |
|---|---|---|---|
|
| |||
| Primary Outcome | |||
| Change in Pain Score from bed placement | N=50 | N=46 | 0.909* |
| Mean (S.D) | −27.0 (27.54) | −27.6 (28.13) | 0.921 |
| Median (25th, 75th) | −16.0 (−45.0, −7.0) | −25.0 (−46.0, −7.0) | |
| Supplemental Primary Outcome Analysis | |||
| At least 14 mm change in pain score (arrival to discharge) | 27/50 (54.0%) | 28/46 (60.9%) | 0.497 |
| At least 30% reduction in pain score (arrival to discharge) | 22/50 (44.0%) | 24/46 (52.2%) | 0.423 |
| Secondary Outcomes | |||
| Length of Index ED Stay (hrs.) From Bed Placement to Discharge | 50 | 46 | 0.008 |
| Mean (S.D) | 3.4 (1.48) | 4.2 (1.72) | |
| Median (25th, 75th) | 3.1 (2.5, 4.0) | 4.2 (3.1, 5.6) | |
| Length of Care (hrs.) From Bed Placement to Last Drug Dose | 49 | 45 | 0.644 |
| Mean (S.D.) | 2.5 (1.46) | 2.6 (1.62) | |
| Median (25th, 75th) | 2.2 (1.7, 3.0) | 2.6 (1.4, 3.5) | |
| Hospitalized for VOC | 25/50 (50.0%) | 26/46 (56.5%) | 0.522 |
| Day Hospital Visits within 7 Days Post Enrollment Visit | 5/50 (10.0%) | 2/46 (4.3%) | 0.438 |
| Hospitalizations for VOC within 7 Days Post Enrollment Visit | 11/50 (22.0%) | 14/46 (30.4%) | 0.347 |
| Return ED Visits within 7 Days Post Enrollment Visit | 8/50 (16.0%) | 3/46 (6.5%) | 0.203 |
| Hospital Re-admission within 7 Days Post Enrollment Visit | 2/50 (4.0%) | 0 | 0.496 |
| Side Effects and Safety (at any time point during ED visit) | |||
| Nausea | 19/50 (38.0%) | 19/46 (41.3%) | 0.741 |
| Vomiting | 7/50 (14.0%) | 6/46 (13.0%) | 0.891 |
| Pruritus | 31/50 (62.0%) | 36/46 (78.3%) | 0.083 |
| SPO2 < 95% requiring supplemental oxygen via nasal cannula due to opioid therapy | 4/50 (8.0%) | 7/46 (15.2%) | 0.343 |
| Moderate to Severe Sedation (Sedation Score of >= 3) | 4/50 (8.0%) | 5/46 (10.9%) | 0.733 |
| Drowsiness | 15/50 (30.0%) | 9/46 (19.6%) | 0.238 |
| Respiratory Depression not requiring intubation | 0 | 1/46 (2.2%) | 0.479 |
| Low Blood Pressure (SBP < 90mmHg and/or DBP < 50 mmHg) | 3/50 (6.0%) | 1/46 (2.2%) | 0.618 |
P-value for the adjusted treatment effect based on linear regression that adjusted for baseline pain score, SCD genotype, age and gender.
All other p-values are univariate p-values.
FIGURE 2.
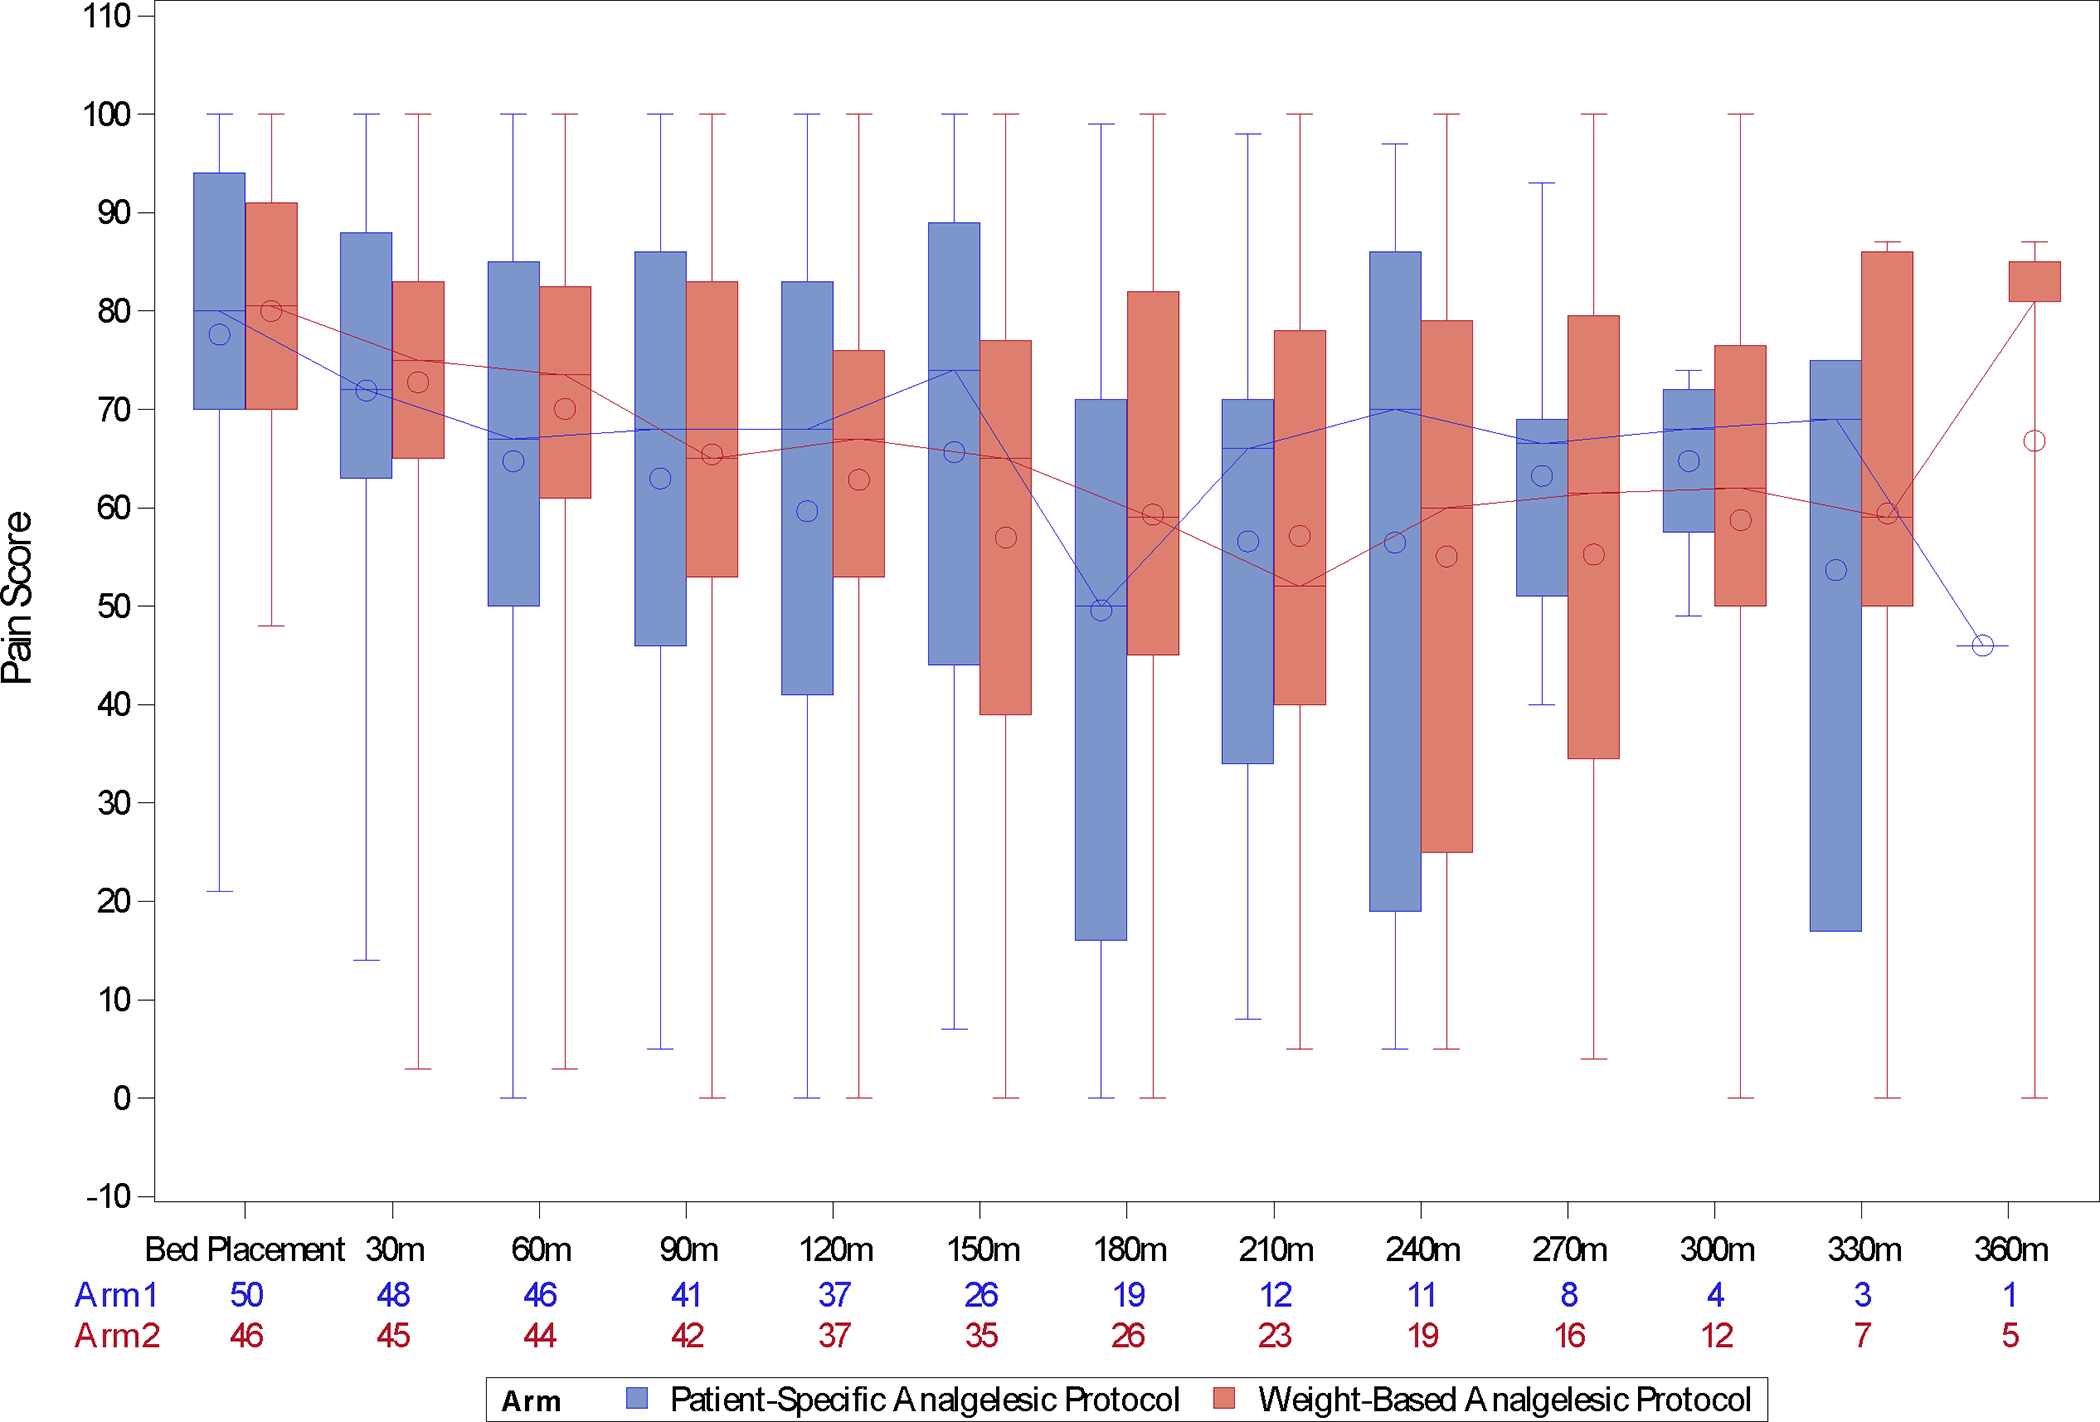
Pain intensity scores over time between groups
For the secondary outcomes, patients who were assigned to PSPs experienced a significantly shorter ED length of stay (P=0.008). When controlling for the same covariates as in the model for the primary outcome, sex and total administered IV opioid dose, we estimated from the linear regression that patients who received a PSP experienced a 46-minute (95% CI: 8 min, 86 min) shorter ED length of stay than those in the weight-based group (Model 1 in Table 3, Figure 3). The adjusted ED length of stay in PSP is 44 minutes shorter if total administered IV opioid dose is adjusted additionally (Model 2 in Table 3). No association is detected between the ED length of stay and the change of pain score (P=0.74 for the ED length of stay when it is added to regression model for change of pain score). No significant difference between groups was observed on hospitalization admission or health care utilization (ED re-visit, hospitalization, or day hospital visit) within seven days (Table 2).
Table 3.
Linear Regression on ED Length of Stay in Hrs.
| Variables | Regression Coefficient | Standard Error | P-value |
|---|---|---|---|
|
| |||
| Model 1 | |||
| Treatment (0=Patient Specific, 1=Weight-Based) | 0.78* | 0.33 | 0.02 |
| Age in years | −0.04 | 0.02 | 0.06 |
| Gender(1=Male, 0=Female) | 0.05 | 0.35 | 0.9 |
| Genotype (1 for SS, SB0, 0 for SC, SB+) | 0.51 | 0.38 | 0.18 |
| Baseline Pain Score | 0.007 | 0.01 | 0.49 |
| Model 2 | |||
| Treatment (0=Patient Specific, 1=Weight-Based) | 0.74 | 0.32 | 0.02 |
| Age in years | −0.05 | 0.02 | 0.02 |
| Gender(1=Male, 0=Female) | 0.10 | 0.34 | 0.71 |
| Genotype (1 for SS, SB0, 0 for SC, SB+) | 0.57 | 0.38 | 0.13 |
| Baseline Pain Score | 0.001 | 0.01 | 0.90 |
| Total IV Morphine Milligram Equivalent dose | 0.011 | 0.006 | 0.02 |
When controlling for sex and total administrated IV morphine milligram equivalent (MME) dose, we estimated from the linear regression that patients who received the patient specific protocol experienced a 46-minute or 0.78/1 hour (95% CI: 8 min, 86 min) shorter ED length of stay than those in the weight-based group.
FIGURE 3.
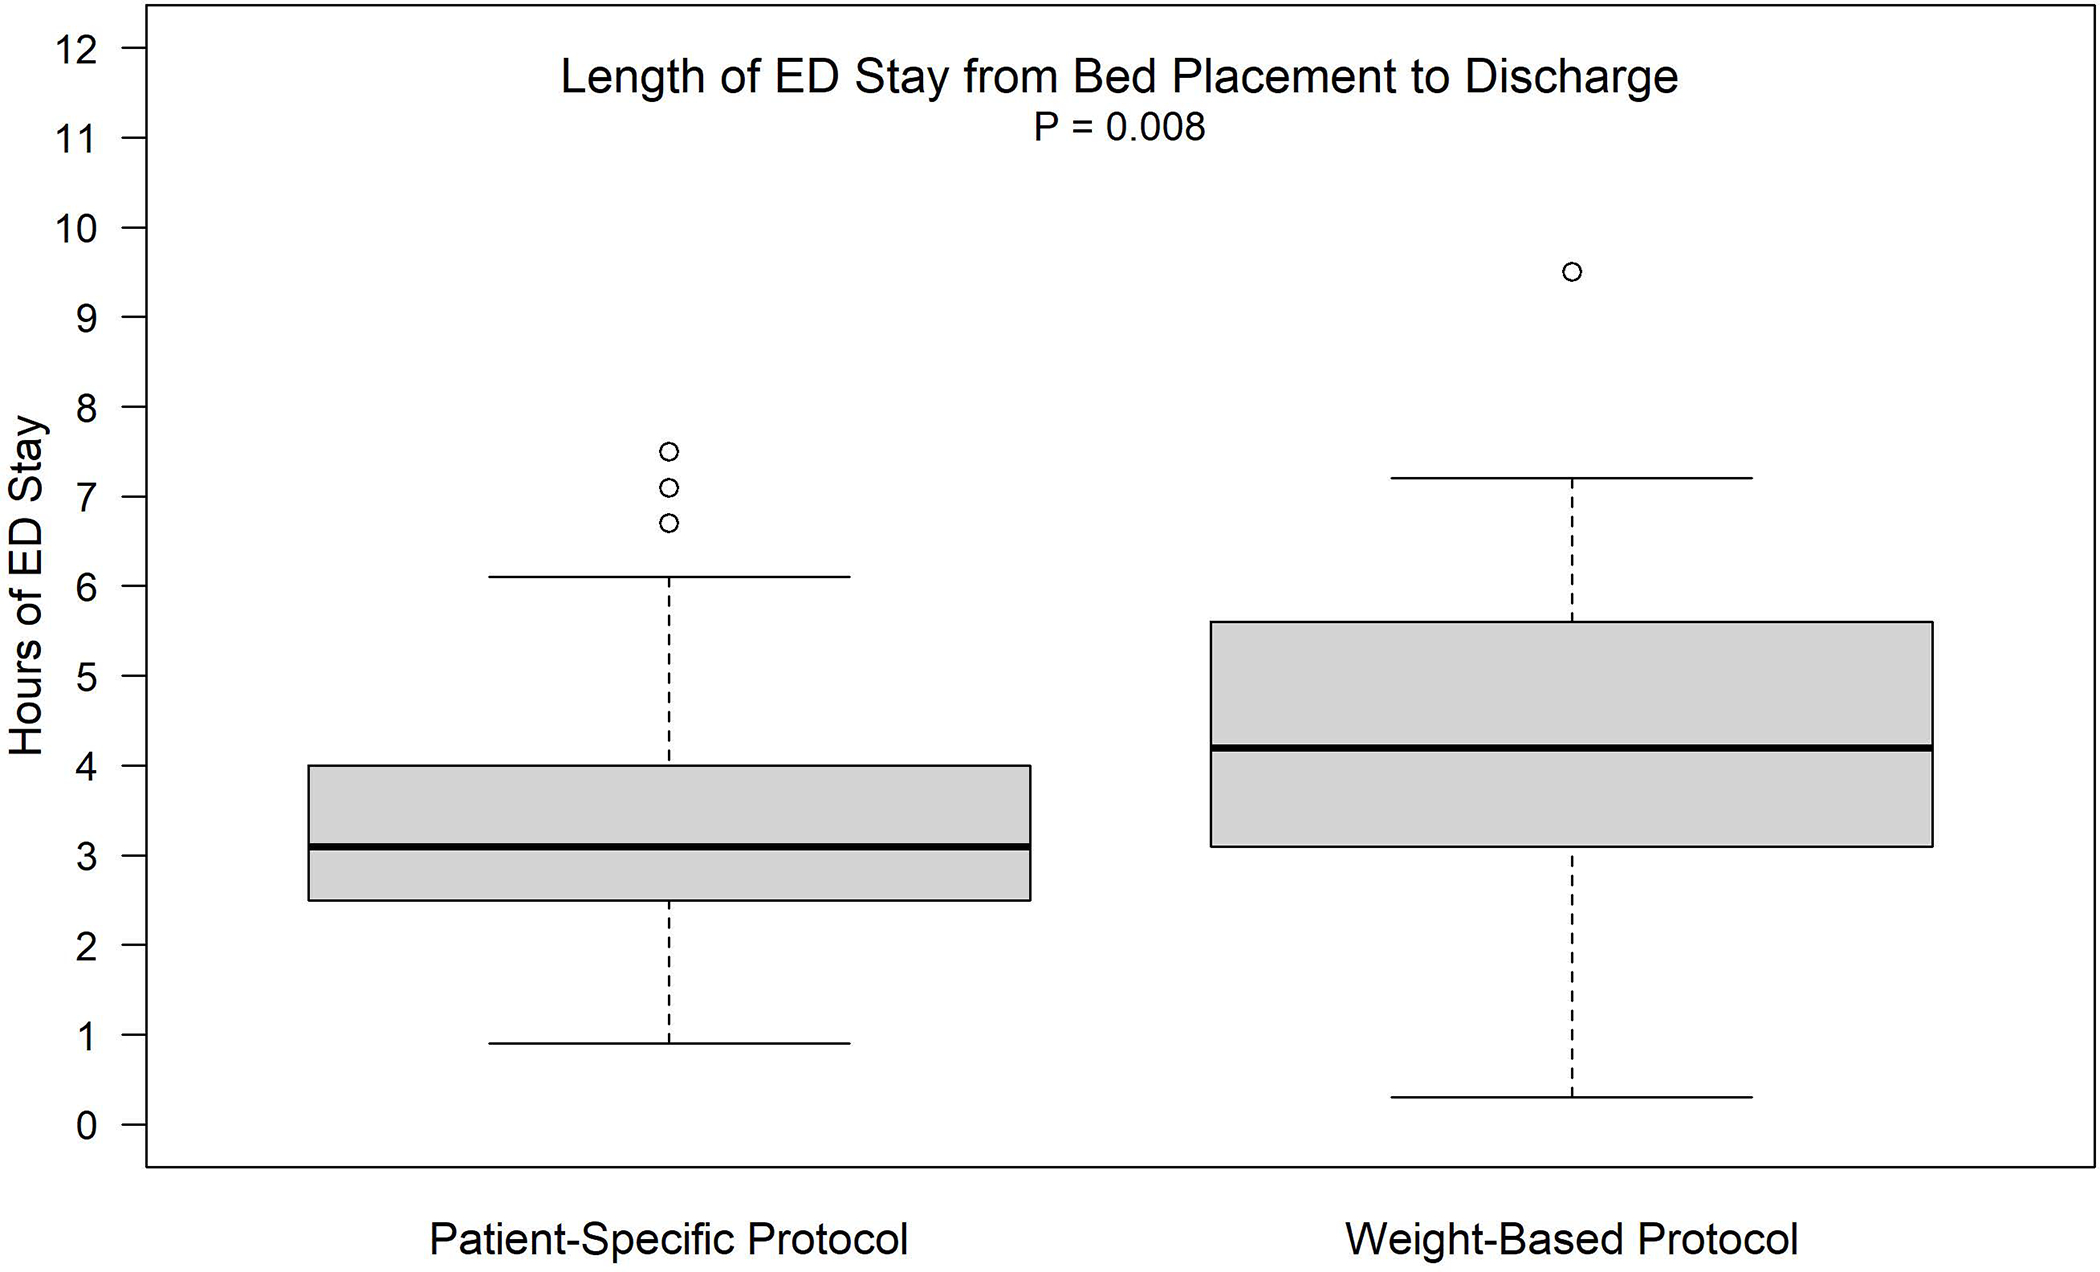
Length of ED stay from bed displacement to discharge (p = 0.008)
Table 4 reports actual drug name, dose, route and re-dosing frequency, as well as ED provider adherence to the protocols. There was no statistically significant difference in the total IV MME administered during the ED visit between treatment protocol groups. Patients received a total median (interquartile range (IQR)) IV MME of 21.0 (16.0 – 41.7) and 32.5 (23.3 – 46.7) in the PSP and weight-based protocol, respectively. The median (IQR) initial doses were 6.7 (6.7 – 13.3) and 10.0 (6.7 – 10.0), IV MME in PSP and weight-based protocol, respectively group. Hydromorphone was more frequently given in each treatment group (92% and 82.6%) than morphine. Only one patient in the weight-based protocol received an intra-muscular administration of analgesic; all other doses were administered intravenously. Adherence to the SCD provider recommended medication, dose, and route was excellent (Table 4). The correct drug and route were administered 90% and 97% of the time (PSP and weight-based protocol respectively). The median (IQR) difference of IV MME between administrated and ordered 1st dose was 0.0 (0.0 –0.0) for both groups. Subsequent doses are reported in Table 5. Most patients received three to four doses with a median of around 10 mg of IV MME per dose.
Table 5.
Subsequent Administered Doses
| Patient-Specific N=50 | Weight-Based N=46 | P-value | |
|---|---|---|---|
|
| |||
| Second Dose Administered | 48 | 42 | 0.360 |
| Mean (S.D.) | 11.2 (7.69) | 11.2 (4.98) | |
| Median (25th, 75th) | 8.3 (6.7, 14.2) | 10.0 (6.7, 13.3) | |
| Min, Max | 1.0, 33.3 | 4.0, 30.0 | |
| Third Dose Administered | 35 | 33 | 0.622 |
| Mean (S.D.) | 10.7 (6.93) | 11.1 (6.59) | |
| Median (25th, 75th) | 10.0 (6.0, 13.3) | 10.0 (6.7, 13.3) | |
| Min, Max | 1.0, 26.7 | 5.0, 40.0 | |
| Fourth Dose Administered | 18 | 24 | 0.293 |
| Mean (S.D.) | 13.7 (7.86) | 11.6 (7.68) | |
| Median (25th, 75th) | 13.3 (6.7, 16.7) | 10.0 (6.7, 13.3) | |
| Min, Max | 4.0, 26.7 | 5.0, 40.0 | |
| Fifth Dose Administered | 5 | 9 | 0.217 |
| Mean (S.D.) | 15.6 (7.39) | 11.9 (6.03) | |
| Median (25th, 75th) | 13.3 (13.3, 18.0) | 10.0 (10.0, 13.3) | |
| Min, Max | 6.7, 26.7 | 6.7, 26.7 | |
| Sixth Dose Administered | 1 | 5 | 0.756 |
| Mean (S.D.) | 13.3 (.) | 14.0 (7.60) | |
| Median (25th, 75th) | 13.3 (13.3, 13.3) | 13.3 (10.0, 13.3) | |
| Min, Max | 13.3, 13.3 | 6.7, 26.7 | |
| Seventh Dose Administered | 1 | 2 | 0.480 |
| Mean (S.D.) | 13.3 (.) | 16.7 (4.71) | |
| Median (25th, 75th) | 13.3 (13.3, 13.3) | 16.7 (13.3, 20.0) | |
| Min, Max | 13.3, 13.3 | 13.3, 20.0 | |
| Eighth Dose Administered | 0 | 2 | |
| Mean (S.D.) | 13.3 (0.00) | ||
| Median (25th, 75th) | 13.3 (13.3, 13.3) | ||
| Min, Max | 13.3, 13.3 | ||
| Ninth Dose Administered | 0 | 2 | |
| Mean (S.D.) | 10.0 (4.71) | ||
| Median (25th, 75th) | 10.0 (6.7, 13.3) | ||
| Min, Max | 6.7, 13.3 | ||
There were no significant differences in side effects or safety. Table 2 reports side effects per protocol. Pruritus was experienced most frequently (78% weight-based, 62% PSP), followed by nausea (41% weight-based, and 38% PSP). Moderate to severe sedation (≥3) was experienced in 11% and 8% of patients in the weight-based and PSP respectively. No patient required intubation or naloxone administration, or other SAEs in either protocol.
DISCUSSION
We report data from the largest RCT to date comparing the efficacy of treating VOC with a patient-specific vs. weight-based protocol for dosing of opioid analgesics, finding no difference in pain improvement between protocols. Due to the COVID-19 pandemic, we did not reach our target sample size of 230 subjects. More importantly, and to the surprise of the investigators, patients in both protocols received a very similar initial and total opioid dose. In the previously conducted pilot study, the doses for the PSP were developed at the discretion of the SCD provider.5 Subjects assigned to a PSP and weight-based protocol received a mean initial dose of 12 mg IV MME and 8.5 mg MME respectively, compared to mean initial dose of 10 mg IV MME in both groups in the current study. In the pilot RCT, subjects assigned to the patient-specific and weight-based protocols received a total mean dose of 59 mg IV MME and 49 mg MME (data collected on multiple ED visits) respectively; both groups receiving more than the mean doses provided to patients in the current study.5 Patients assigned to the current study PSP and weight based protocols received a total mean dose of 36 IV MME and 39 MME respectively. A real world implementation of an ED SCD specific protocol was conducted and previously reported. 14 The protocol allowed up to 10 mg of IV hydromorphone or 50 mg of IV morphine sulfate over the course of one hour to adults with SCD who took opioids within the last 24 hours. In that analysis of 603 ED visits from one center, patients received an average of 63 IV MME over the mean (SD) length of ED stay of 203 (143) minutes.14 It is likely that the lower doses administered in both groups in this trial contributed to the lack of difference in improvement in pain intensity scores.
In this study, subjects who received a PSP had a 45-minute shorter length of stay compared to those managed with a weight-based protocol, although similar doses were received by both groups. These results are encouraging, as it may highlight the benefit of developing a tailored dose for each patient. Given the incredible overcrowding situation in EDs,15 any improvement in ED length of stay is important. It is also important to note that the majority of patients experienced the maximum pain relief at 180 minutes from placement in an ED treatment space. Seventy one percent of subjects required three doses, 43% of subjects required a 4th dose, and only 15% and 6% of patients required a 5th and 6th dose respectively. In many EDs, the common practice is administration of three doses and then determine a disposition. ED providers are under pressure to make disposition decisions quickly, as increased ED length of stay contributes to overcrowding, decreases patient satisfaction and increases left without being seen rates.16 However, our data support the provision of the possible need for extra time and at least four doses to obtain adequate pain relief. If rapid administration of the initial dose, and adherence to the NHLBI and ASH guidelines of re-assessment and re-administration of repeat doses every 30 minutes can be achieved, the overall ED length of stay may be significantly shortened. Some EDs use clinical decision support systems to improve safe and efficient ED care based, including guidelines to treat pain in the ED prior to admission.17,18 Our data should help justify the additional dose of analgesic. Finally, many individuals with SCD report preferring to avoid hospital admission in favor of discharge from the ED if their pain is controlled sufficiently to be able to manage at home. While we found no difference between protocols with regards to hospital admission, our hospital admission rates are similar to other quality improvement projects that implemented PSPs in either adult or pediatric EDs, with admission rates ranging from 52% to 63%..19–22 Our pilot randomized controlled trial also had admission rates of 58% and 40% for patients randomized to weight-based and individualized pain protocols respectively.5 Future investigations will help gain an understanding of other factors needed to reduce hospital admission in addition to the use of PSPS. Together, these findings suggest that use of PSP or weight-based protocols results in significantly improved pain, without an increase in side effects and the use of PSP resulted in a shorter length of ED stay.
With regards to safety, while research staff closely monitored side effects and vital signs, no patient required intubation, assistance with ventilation, or administration of naloxone. We believe use of a sedation scale is important. Future work should investigate how PSP’s can advance the quadruple aim of improving health care (cost savings, improved health outcomes and patient satisfaction as well as a decrease in provider burden.
In the current study we carefully developed an opioid calculator which could be easily used by SCD providers to facilitate development of PSPs with a strong emphasis on safety. The calculator considers the use of long and short acting opioids which are often used to treat chronic and acute pain in SCD. In addition, the calculator provides a standardized method for SCD providers to determine an initial and repeat dosing to treat VOE in the ED. Three experts on the study team collaborated and based the function of the calculator on a previously developed and published calculator used to develop weight-based plans for children with SCD. One of the strong contributions of this project is the calculator; our team is investigating a permanent website for the calculator. The calculator can serve as an aid for SCD providers not ED providers, to develop patient specific pain plans to manage VOC in the ED. The calculator will be posted on the National Association of Sickle Cell Centers website which is a resource for sickle cell hematologists and other providers that care for individuals with SCD. The calculator is not proprietary and will be available for use free of charge. The calculator is not intended to be used by emergency providers, however, the weight-based calculator is included and maybe helpful. Both the PSP and weight-based protocol doses determined by the calculator resulted in what is considered a statistically and clinically important reduction in pain intensity (14 mm and 30% reduction).
In our previous study and in the current project, EM providers had excellent adherence to the protocol. 5 This may indicate that written recommendations from SCD providers may give ED providers greater confidence that they are ordering appropriate doses to manage their patients’ VOC pain. We previously surveyed ED physicians immediately after using either the patient-specific or weight-based protocol.23 ED physicians reported being satisfied with the clarity of the order (97.6%), its ability to manage pain (91%), and better than their usual ED strategy (70%). 23 Patient specific analgesic protocols to treat VOC have been found to decrease time to administration of first opioid, overall time to disposition when guidelines are followed, and a decrease in hospital admission rates.19,20,22,24,25
Our data support previous data that administration of a patient-specific and weight-based opioid protocols are safe. There were no serious adverse events throughout the current or previous study.5 The most common side effects continue to be nausea and pruritis, and again, no patients required intubation or Naloxone. These results are similar to a previous analysis of 603 ED visits by 72 unique patients using a high-dose protocol.14There were 63 episodes experienced by 13 unique patients who had either a SpO2 <92% (n=61) or respirations less than 10 breaths per minute (n=2).14 No administration of Narcan or intubation was required to treat these episodes. Monitoring sedation and vital signs is important, especially as more EDs are forced to treat patients with VOC in non-traditional settings such as hallways and waiting rooms due to overcrowding. Excellent monitoring protocols should be in place and monitoring of the adherence should be performed.
LIMITATIONS
There are several limitations in this study. First, we were unable to achieve our targeted sample size due to the COVID-19 pandemic, resulting in our inability to determine if there are differences in pain relief between protocols as the power is only 58% with a total of 104 subjects enrolled. However, both standardized approaches led to clinically meaningful decreases in VOC pain intensity during the ED visit. Second, we excluded patients with SCD on methadone and buprenorphine to manage chronic pain, due to lack of scientific agreement regarding potency of these agents. Calculating conversions would be challenging. Additionally, for those patients on chronic outpatient opioid therapy, we had a conservative approach to increasing individualized opioid doses for PSPs compared to prior ED treatment that may have resulted in lower than optimal doses for some opioid tolerant participants. This lower dose is an important limitation. Our conservative approach was intentional as we aimed to examine the safety of the protocols. Patients receiving outpatient chronic opioid therapy deserve additional study, as there are little data to guide acute-on-chronic pain in the ED setting. An additional limitation was the inability to capture all ED visits, many of which occurred during late night or early morning hours based on the captured reasons for the missed ED visits. A total of 46 patients with missed ED visit had ED visits later that were captured and enrolled. Thus, we do not have reason to believe these patients are different with regards to their experience of pain. We also did not include any patients experiencing complicated VOC including signs of infection or acute chest syndrome. ED physicians were not blinded to the study protocol which may have contributed to the shorter length of ED stay for those patients assigned to the PSP. Finally, our study was conducted in large academic centers with research infrastructure in the ED, which may limit the generalizability of our findings.
CONCLUSIONS
In this study, both the patient specific protocols (PSPs) and weight-based protocol provided clinically meaningful pain relief. The use of a standardized approach that allowed up to six hours and included the use of a calculator to determine PSP and weight-based opioid dosing for individuals with SCD, had high adherence by ED providers, were found to be safe, and resulted in a reduction in pain intensity of 27 mm. Most patients required three to four hours of analgesic treatment in the ED. Patients treated with a PSP had a shorter ED length of stay. This study provides evidence for using a standardized approach to VOC management in the ED, as recommended by national guidelines (NHLBI, ASH).
Supplementary Material
Financial Support
Funder: National Heart, Lung, and Blood Institute (NHLBI)
Grant/Award Number:1UG3/UH3 -HL137856 and U24HL137907
Footnotes
Conflict of Interest Disclosure
RH, PK, IO,PV, JP, HY, H Barnhart reports no conflict of interest
PT is a consultant for CSL Behring and received funding for salary support from the NHLBI
SI is part of an advisory board for bluebird bio. SI received honoraria
HB reports research funding through HB’s institution from BeBetter Therapeutics, Boehringer Ingelheim, Esperion, Improved Patient Outcomes, Merck, NHLBI, Novo Nordisk, Otsuka, Sanofi, VA. Elton John Foundation, Hilton Foundation, and Pfizer. HB also provides consulting services for Abbott, Imatar, Novartis, Sanofi, Vidya, Walmart, and WebMD. He was also on the board of directors of Preventric Diagnostics.
JM reports research funding unrelated to the topic of this investigation from Abbott, Roche, Beckman Coulter, Calcimedica, Astrazeneca, BioXcel Therapeutics, Quidel and Qiagen. JM has also received research support from the National Institutes of Health (5UG1DA015831 and R01HL157596-01) and the Patient Centered Outcomes Research Insititute (DI-2020C2-20363)
J Paxton reports research funding unrelated to the topic of this investigation from MindRhythm Inc, PerSys Medical, Calcimedica Inc, Janssen Pharmaceuticals, Hospi Corporation, and 410 Medical during the study period.
AP reports research funding unrelated to the topic of investigation from the Society for Academic Emergency Medicine Foundation. She is an elected Member-at-Large of the Society for Academic Emergency Medicine Board of Directors.
JJS received research funding from Takeda for a Phase 1/2 study of SHP-655 for the treatment of sickle cell disease and from Agios for Phase 3 studies of mitapivat for transfusion dependent and non-transfusion dependent thalassemia.
RGW has received research support from Regeneron, Eli Lilly, Cepheid, CoapTech, Global Blood Therapeutics, Novartis, EndPoint Health, Roche, Vapotherm, and Eldon. He has received research support from the National Heart, Lung, and Blood Institute (No. U24HL137907) and the National Institute for Diabetes and Digestive and Kidney Diseases (No. R44DK115325). He has been a contracted author for Elsevier Publishing and Relias Learning LLC.
Presentations
No results have been presented at a scientific meeting.
REFERENCES
- 1.Brandow AM, Carroll CP, Creary S, et al. American Society of Hematology 2020 guidelines for sickle cell disease: management of acute and chronic pain. Blood advances 2020;4(12):2656–2701. [DOI] [PMC free article] [PubMed] [Google Scholar]
- 2.U.S. Department of Health and Human Services National Heart Lung, and Blood Institute. Evidence-Based Management of Sickle Cel Disease, Expert Panel Report, 2014. (http://www.nhlbi.nih.gov/health-pro/guidelines/sickle-cell-disease-guidelines/).
- 3.Porter J, Feinglass J, Artz N, Hafner J, Tanabe P. Sickle cell disease patients’ perceptions of emergency department pain management. J Natl Med Assoc 2012;104(9–10):449–54. [DOI] [PubMed] [Google Scholar]
- 4.Linton EA, Goodin DA, Hankins JS, et al. A Survey-Based Needs Assessment of Barriers to Optimal Sickle Cell Disease Care in the Emergency Department. Ann Emerg Med 2020;76(3s):S64–s72. [DOI] [PMC free article] [PubMed] [Google Scholar]
- 5.Tanabe P, Silva S, Bosworth HB, et al. A randomized controlled trial comparing two vaso-occlusive episode (VOE) protocols in sickle cell disease (SCD). Am J Hematol 2018;93(2):159–168. [DOI] [PMC free article] [PubMed] [Google Scholar]
- 6.Tanabe P, Bosworth HB, Crawford RD, et al. Time to pain relief: A randomized controlled trial in the emergency department during vaso-occlusive episodes in sickle cell disease. Eur J Haematol 2023;110(5):518–526. [DOI] [PMC free article] [PubMed] [Google Scholar]
- 7.Ibemere SO, Dubbs SB, Barnhart HX, et al. Trial design of comparing patient-specific versus weight-based protocols to treat vaso-occlusive episodes in sickle cell disease (COMPARE-VOE). Contemp Clin Trials 2021;101:106252. [DOI] [PMC free article] [PubMed] [Google Scholar]
- 8.Drożdżal S, Rosik J, Lechowicz K, et al. COVID-19: Pain Management in Patients with SARS-CoV-2 Infection-Molecular Mechanisms, Challenges, and Perspectives. Brain Sci 2020;10(7):465. [DOI] [PMC free article] [PubMed] [Google Scholar]
- 9.Pasero C Assessment of sedation during opioid administration for pain management. J Perianesth Nurs 2009;24(3):186–90. [DOI] [PubMed] [Google Scholar]
- 10.Nisbet A, Mooney-Cotter M. Post Opioid Sedation Scales: Validity, reliability, accuracy and performance in adult non-critical care setting. ASPMN National Meeting. Tuscon, Az2008. [Google Scholar]
- 11.Todd KH, Funk KG, Funk JP, Bonacci R. Clinical Significance of Reported Changes in Pain Severity. Ann Emerg Med 1996;27(4):485–489. [DOI] [PubMed] [Google Scholar]
- 12.Bird SB, Dickson EW. Clinically significant changes in pain along the visual analog scale. Ann Emerg Med 2001;38(6):639–43. [DOI] [PubMed] [Google Scholar]
- 13.Lopez BL, Flenders P, Davis-Moon L, Corbin T, Ballas SK. Clinically significant differences in the visual analog pain scale in acute vasoocclusive sickle cell crisis. Hemoglobin 2007;31(4):427–32. [DOI] [PubMed] [Google Scholar]
- 14.Tanabe P, Martinovich Z, Buckley B, Schmelzer A, Paice JA. Safety of an ED High-Dose Opioid Protocol for Sickle Cell Disease Pain. J Emerg Nurs 2015;41(3):227–35. [DOI] [PubMed] [Google Scholar]
- 15.American College of Emergency Physicians. Policy Statement: Crowding. 2019. (https://www.acep.org/patient-care/policy-statements/crowding/).
- 16.Chang AM, Lin A, Fu R, McConnell KJ, Sun B. Associations of Emergency Department Length of Stay With Publicly Reported Quality-of-care Measures. Acad Emerg Med 2017;24(2):246–250. [DOI] [PMC free article] [PubMed] [Google Scholar]
- 17.InterQual (R) Level of Care Criteria. (https://www.changehealthcare.com/clinical-decision-support/interqual/level-of-care-criteria). Accessed April 19, 2023.
- 18.MCG Health HH. Industry-leading clinical decision support. (https://www.mcg.com/about/company-overview/).Accessed April 19, 2023.
- 19.Della-Moretta S, Delatore L, Purcell M, et al. The Effect of Use of Individualized Pain Plans in Sickle Cell Patients Presenting to the Emergency Department. Ann Emerg Med 2020;76(3s):S21–s27. [DOI] [PubMed] [Google Scholar]
- 20.Kato-Lin YC, Krishnamurti L, Padman R, Seltman HJ. Does e-pain plan improve management of sickle cell disease associated vaso-occlusive pain crisis? a mixed methods evaluation. Int J Med Inform 2014;83(11):814–24. [DOI] [PubMed] [Google Scholar]
- 21.Kavanagh PL, Sprinz PG, Wolfgang TL, et al. Improving the Management of Vaso-Occlusive Episodes in the Pediatric Emergency Department. Pediatrics 2015;136(4):e1016–25. [DOI] [PubMed] [Google Scholar]
- 22.Schefft MR, Swaffar C, Newlin J, Noda C, Sisler I. A novel approach to reducing admissions for children with sickle cell disease in pain crisis through individualization and standardization in the emergency department. Pediatr Blood Cancer 2018;65(10):e27274. [DOI] [PubMed] [Google Scholar]
- 23.Knight LMJ, Onsomu EO, Bosworth HB, et al. Exploring Emergency Department Provider Experiences With and Perceptions of Weight-Based Versus Individualized Vaso-Occlusive Treatment Protocols in Sickle Cell Disease. Adv Emerg Nurs J 2019;41(1):86–97. [DOI] [PMC free article] [PubMed] [Google Scholar]
- 24.Arnold T, Coffee RL Jr., Rosenberg L, et al. A Quality Improvement Initiative to Decrease Time to Analgesia in Patients With Sickle Cell and Vaso-Occlusive Crisis: A Population With Disparities in Treatment. Cureus 2022;14(9):e29569. [DOI] [PMC free article] [PubMed] [Google Scholar]
- 25.Lyon M, Sturgis L, Lottenberg R, et al. Outcomes of an Emergency Department Observation Unit-Based Pathway for the Treatment of Uncomplicated Vaso-occlusive Events in Sickle Cell Disease. Ann Emerg Med 2020;76(3s):S12–s20. [DOI] [PubMed] [Google Scholar]
Associated Data
This section collects any data citations, data availability statements, or supplementary materials included in this article.